
ABSTRACT
Climate change results in the alteration of the size structure of plankton, which consequently may affect higher trophic levels, such as planktivorous seabirds. In this study Laser Optical Plankton Counter measurements were performed over seven summer seasons (2010–2016) to test the ratio of large versus small zooplankton in relation to environmental conditions. Investigated transects were repeated during the same time of the year (July/August) in different zones of the West Spitsbergen Shelf crossing the Arctic front. The plankton particles were grouped into two size fractions: “Calanus”, potentially consisting of a majority of the high-energetic, older life stages of the preferred prey for little auk (Alle alle) and the “small” fraction including less preferred items. The vertical availability of the Calanus fraction was tested on the background of usually abundant smaller zooplankton, which may hinder the detection of larger zooplankters by little auk. Larger zooplankton were found closer to the coast, in the upper 20-m depth layer in years characterized by significantly lower mean temperatures. Potential availability of prey for the little auk thus could be higher in colder years than in warmer years. Additionally, our study indicated the tendency of the small plankton fraction to concentrate near the locations of the highest chlorophyll fluorescence, in the 20–30-m water layer. The high spatial and temporal resolution of the data indicated a variation in the proportion of large versus small zooplankton, and thus in the availability of Calanus to little auk with respect to temperature.
Plankton are free-floating in the water column and respond rapidly to changes in temperature and ocean circulation by expanding or contracting their geographical ranges (Taylor et al. Citation2002). As a result, plankton represent an excellent indicator of climate change in the marine environment. In recent years, systematic changes in abundance, community structure and ranges of plankton distribution in many of the world’s oceans have been ascribed to large-scale climate fluctuations and processes, particularly the reduction in phytoplankton and ice algae blooms (Hallegraeff Citation2010; Ji et al. Citation2013; Post et al. Citation2013; Post Citation2017). A northward expansion of zooplankton communities associated with warm waters, resulting in decreasing numbers of colder-water species, has been observed recently (Buchholz et al. Citation2012; Dalpadado et al. Citation2012; Woodworth-Jefcoats et al. Citation2016; Haug et al. Citation2017). A biogeographical shift in the increasing dominance of warm-temperate-boreal copepod species has been witnessed over the last decade in the Arctic (e.g., Weydmann et al. Citation2014). In addition to changes in the distribution, abundance and biomass of zooplankton, the body size of an organism provides an important source of information about changes in ecosystems and their properties (Heckmann et al. Citation2012; Trudnowska et al. Citation2014). Although the total secondary production has been modelled to increase with higher temperatures (Slagstad et al. Citation2011), the longer open-water season in the warmer Arctic could potentially drive the zooplankton community towards smaller body sizes and shorter life cycles (Daufresne et al. Citation2009; Garzke et al. Citation2016), resulting in a decrease in the overall zooplankton biomass in the future. As these processes occur gradually, long-term monitoring and multiyear observations are crucial to estimate and predict possibly negative effects of the changes (Kwasniewski et al. Citation2012).
The distribution of zooplankton is highly variable in both horizontal and vertical space (Trudnowska et al. Citation2015; Trudnowska et al. Citation2016; Gluchowska et al. Citation2017). This is mainly due to seasonality, feeding and ontogenic migrations (Vinogradov Citation1997). The copepod vertical distribution is strongly correlated with temperature gradients and food concentrations (Leising & Franks Citation2000; Daase et al. Citation2008; Trudnowska et al. Citation2016). To survive copepods need to find food levels that are sufficient for growth, and their vertical distribution tends to correlate strongly with temperature gradients and food concentrations (Leising & Franks Citation2000). For example, Calanus finmarchicus CV and Pseudocalanus minutus females are able to remain within, respond to and track the movements of microscale vertical phytoplankton patches (Bohrer Citation1980). The vertical variability of zooplankton is high, making knowledge of spatial heterogeneity crucial for studying the feeding ecology of the little auk (Alle alle), the most abundant seabird in the Arctic, which needs to locate prey patches of appropriate size to maintain sufficiently high feeding rates (Vogedes et al. Citation2014).
The temperature and volume of Atlantic-origin waters flowing into the Arctic have increased in recent years, causing shifts in hydrographical fronts and water masses (Blindheim et al. Citation2000; Schauer et al. Citation2004; Walczowski & Piechura Citation2007; Walczowski et al. Citation2012, Citation2017). The large frontal system situated along the WSS (Sakshaug et al. Citation2009) is formed by two currents separated by a density gradient between the warm Atlantic Water of the West Spitsbergen Current and the cold Arctic water of the coastal Sørkapp Current (Saloranta & Svendsen Citation2001; Nilsen et al. Citation2008; Kwasniewski et al. Citation2010). While the total abundance of zooplankton is much higher in Atlantic waters, Arctic waters carry organisms of larger body size and with a higher lipid content, which results in their higher biomass and calorific value (Weslawski et al. Citation1999; Kwasniewski et al. Citation2010, Citation2012). Copepods of the genus Calanus have extremely high calorific values (50–70% lipids of dry mass; Lee et al. Citation2006; Falk-Petersen et al. Citation2009) and are key species in the Arctic ecosystems (Stempniewicz Citation2001; Falk-Petersen et al. Citation2002; Frandsen et al. Citation2014), where they represent significant food items for planktivorous predators from the higher trophic levels, such as birds, fish and mammals (Falk-Petersen et al. Citation1990). Calanus glacialis, especially CV, is the main diet component for little auk during the breeding season (Mehlum & Gabrielsen Citation1993; Karnovsky et al. Citation2003; Jakubas et al. Citation2007; Karnovsky et al. Citation2010; Kwasniewski et al. Citation2010; Hovinen et al. Citation2014). The little auk itself plays a key role in the Arctic ecosystem, transporting a large amount of organic matter from the sea to the nutrient-poor Arctic tundra (Stempniewicz Citation2001; González-Bergonzoni et al. Citation2017).
To estimate the relative attractiveness of a foraging ground for little auk, it is important to consider the proportion of preferred species abundance in relation to total zooplankton abundance (Kwasniewski et al. Citation2010; Stempniewicz et al. Citation2013). Visual planktivores such as little auk need their prey to be abundant and also easily available, i.e., to occur in a high proportion compared to other zooplankton species. Although the total abundance of C. glacialis might be similar in Atlantic and Arctic waters, the ratio of C. glacialis to other species may provide a more suitable indicator to assess the quality of a feeding ground for little auks (Kwasniewski et al. Citation2010). Cold Arctic type waters provide particularly favourable conditions for feeding, where rather low total zooplankton abundance is compensated for by very high proportions of C. glacialis. On the other hand, Atlantic type water masses, which usually contain high total zooplankton abundance but a relatively low proportion of preferred copepods, are typically avoided by little auk (Kwasniewski et al. Citation2010; Stempniewicz et al. Citation2013).
Historically, the accurate estimation of zooplankton distributions was limited until the development of automatic instruments with high spatial resolution, e.g., video plankton recorders, moored stations, satellites, acoustic sounders and optical counters (Wiebe & Benfield Citation2003). The LOPC used in our study expanded the potential for studying zooplankton distributions over large spatial and temporal scales and has also enabled biological data to be collected concurrently with physical parameters (Pinca & Huntley Citation2000; Trudnowska et al. Citation2012). This method is especially valuable in areas where the abundance of zooplankton is relatively large and dominated by few species, because it allows taxonomic species distributions to be determined in the different size groups recorded by the LOPC. This is especially true in north Atlantic and Arctic waters, where studies based on optical plankton counters were able to distinguish Calanus species (Basedow et al. Citation2014; Gaardsted et al. Citation2010; Trudnowska et al. Citation2014).
The aim of this study was to analyse the fluctuations in the summer distribution and abundance of zooplankton in vulnerable WSS region. We hypothesized that the spatial availability of large zooplankton for the planktivorous predator little auk differs among three selected zones (Arctic, Atlantic and Frontal) under lower versus higher seawater temperature.
Materials and methods
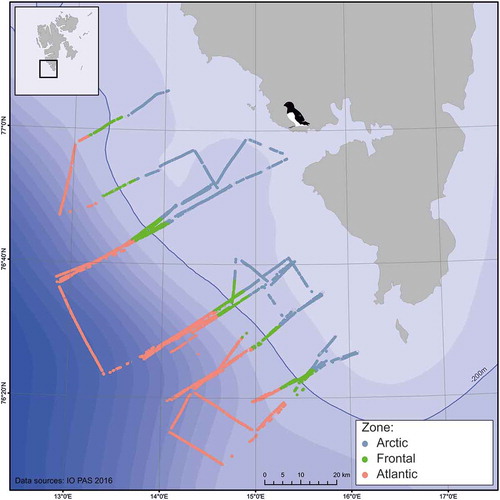
This study was conducted in the south-western part of the WSS near the Hornsund fjord during seven summer seasons (2010–16). Sampling was performed during 3–4 days at the turn of July and August each year (26 – 29 July 2010, 27–29 July 2011, 27–29 July 2012, 31 July – 2 August 2013, 1–3 August 2014, 31 July – 1 August 2015, 27–28 July 2016), on board the Oceania, the research vessel of the Institute of Oceanology, Polish Academy of Sciences (). Sections were arranged to be spread across the hydrographical front, the position of which is well-correlated with bathymetry and the shelf edge, and is known to be situated above the 200 m isobath (Saloranta & Svendsen Citation2001; Kwasniewski et al. Citation2010). The data set was divided into three consecutive zones of the Hornsund area on the basis of the front position: the Frontal Zone – the data points lying above the 200 m isobath and within a distance of 5 km from it; the Arctic Zone – extending over 5 km east of the 200 m isobath towards the Spitsbergen coast; and the Atlantic Zone – extending over 5 km west of the 200 m isobath ().
Figure 1. The Hornsund region study area. Sections of an LOPC-CTD-F platform towed across the West Spitsbergen Shelf over seven summer seasons (July-August 2010–2016) are indicated by measuring points assigned to three zones. The shelf break (200 m isobath) is marked by a solid blue line. The bird icon indicates the location of the little auk colony in Hornsund.
The measurements were performed by using an instrument platform equipped with a LOPC (Brooke Ocean Technology Ltd.), a CTD (SBE 911plus, Seabird Electronics Inc.) and a fluorometer (F; Seapoint Sensors Inc.). The LOPC is an in situ sensor that autonomously and reliably measures the abundance and size structure of plankton and particles passing the beam path in the sampling tunnel (7 × 7 cm wide; 49 cm2 cross-section). As a particle passes the sensor, the portion of blocked light is measured and recorded as a digital size and converted to an ESD. This value represents the diameter of a sphere that would have the same cross-sectional area as the particle being measured, using a semi-empirical formula based on calibration with black spheres of known diameters (Herman Citation1992; Herman et al. Citation2004). Processing the raw LOPC data requires extensive post-processing filtering and interpretation in several steps. Software provided by Rolls-Royce Naval Marine Canada (formerly ODIM Brooke Ocean), was used for field measurements control, data acquisition and pre-processing. Post-processing tools written in Matlab were developed to count higher-level parameters. The recorded count data and flow data were used to calculate the abundance of plankton, which is expressed as the number of individuals per cubic metre (ind. m−3). The LOPC-CTD-F platform was towed horizontally at a fixed water depth (20–30 m, hereafter “mid-surface depth layer”), chosen arbitrarily as the most representative and productive zone of the upper water column in a region (Trudnowska et al. Citation2014) during the first two summer seasons (2010–11), and in an undulating mode (oscillating between surface and 50-m depth) during the next five years (2012–16). It was necessary to restrict the horizontal long-term (seven years: 2010–16) analysis to a depth of approximately 20–30 m (data averaged over 5-m distance intervals), to determine the inter-annual variability in hydrographic conditions and distribution of small zooplankton (which according to weighted mean depth analysis concentrates mainly in this water layer). The measurements performed in the undulating sampling mode provided data with high vertical resolution (data averaged vertically over 1-m depth intervals) of the hydrography, chlorophyll and zooplankton distribution patterns during five years (2012–16). The mean depth of small and large zooplankton concentrations and chlorophyll fluorescence were analysed. Additionally, the proportion of large versus small zooplankton in relation to environmental conditions were presented in a vertical (50–0 m) and horizontal (different zones: Arctic, Frontal and Atlantic) perspectives.
This study provides only high-resolution LOPC measurements – information about zooplankton species composition is based on numerous previous studies conducted in the same study area (e.g., Kwasniewski et al. Citation2010; Kwasniewski et al. Citation2012; Jakubas et al. Citation2013; Stempniewicz et al. Citation2013; Trudnowska et al. Citation2014; Trudnowska et al. Citation2015; Trudnowska et al. Citation2016). Using the abundance estimates and size structure data derived from the LOPC, we grouped plankton into two size fractions: a small size fraction (0.25–1.0 mm ESD), consisting of, e.g., Calanus nauplii, Oithona spp., Microcalanus spp., Pseudocalanus spp., and a large size fraction (1.0–2.5 mm ESD) – hereafter Calanus – represented predominantly by the older life stages (CIV, CV, adult) of Calanus spp. (Basedow et al. Citation2010). In accordance with Basedow et al. (Citation2010), particles <0.25 mm ESD were considered to be noise (e.g., Zhou et al. Citation2009). We decided to broaden the size range for Calanus spp. suggested by Basedow et al. (Citation2010) to the upper limit applied by Jakubas et al. (Citation2013), who combined net sampling together with LOPC measurements taken together at the same time in the research area. The Calanus size fraction classified as the size range of 1–2.5 mm according to Jakubas et al. (Citation2013) and Trudnowska et al. (Citation2014) was composed of Calanus spp. CIV, CV and adults. We are aware that this size fraction includes the older life stages of both co-occurring and morphologically similar Calanus species, the Atlantic C. finmarchicus and the Arctic C. glacialis (Kwasniewski et al. Citation2012; Daase et al. Citation2013). However, based on our experience gained from long-term Hornsund plankton monitoring and from multiyear observations (Kwasniewski et al. Citation2012) that showed the substantial domination of C. glacialis older copepodite stages over C. finmarchicus in the Arctic shelf community at this time of the year, we assumed that the preferred zooplankton prey of the little auk, C. glacialis (CV), constituted a substantial part of the large size fraction in this particular zone.
For comparison of temperature, salinity, chlorophyll fluorescence, abundance and percentage of both zooplankton size fractions among years and zones, the nonparametric Kruskal-Wallis test and computation of the 95% CI were used. The differences were regarded as not significant at p < 0.05 if the 95% CI overlapped (Colwell et al. Citation2004). For multiple comparisons nonparametric post hoc Dunn’s test was used. All tests were performed in Statistica 12.0. The Ocean Data View software programme (Schlitzer Citation2015) and ArcGIS 10.0. were used to prepare map figures.
In accordance with Daase et al. (Citation2008), using the method of Manly (Citation1977), we characterized the vertical distributions of small zooplankton, large zooplankton and chlorophyll fluorescence by the weighted mean depth of the frequency distribution among the depth axis.
Results
Mean depth of small and large zooplankton concentrations in relation to chlorophyll fluorescence in the upper 50 m
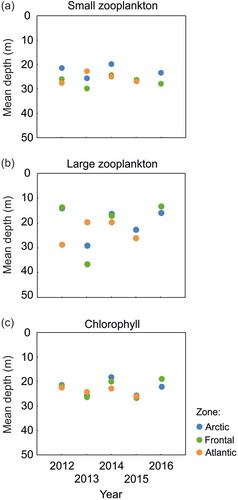
The small zooplankton were concentrated predominantly at 20–30-m depth in all three zones: Arctic, Frontal and Atlantic during all five years 2012–16 (). The highest concentrations of large zooplankton were observed in a wider range of depths in the three studied zones, especially in the Frontal Zone (). The mean depth of the highest chlorophyll fluorescence, which was located mainly in the 20–30 m water layer largely coincided with the mean depth of the small zooplankton, particularly in the Arctic Zone ().
Figure 2. Mean depths of concentration of (a) small zooplankton, (b) large zooplankton and (c) chlorophyll fluorescence in the upper 50 m water layer over five summer seasons (2012–16) in three different zones of the West Spitsbergen Shelf area.
Multiyear observations: hydrographic conditions and distribution of small zooplankton in the 20–30-m depth layer
Since the mean depths of the highest concentrations of both chlorophyll and the small zooplankton fractions were distributed within the depth ranges of horizontal tows (20–30-m depth layer), all these data together with seawater temperature were used for multiyear comparisons (2010–16).
The seawater temperature differed significantly over the seven years of study, from 2010 to 2016 (Kruskal-Wallis test H = 15,834.43, p < 0.001) and between zones (Kruskal-Wallis test H = 35,941.14 p < 0.05). The highest differences were noted between 2013 and 2011, 2010, 2015 (Dunn test z = 109.46, p < 0.001; z = 107.37, p < 0.001; z = 89.57, p < 0.001, respectively) and between Arctic and Atlantic zones (Dunn test z = 186.95, p < 0.05). The lowest temperature was detected in 2011 and the highest in 2013 (). However, there were no statistically significant differences in seawater temperature between the years 2010 and 2012 (Dunn test z = 2.02, p > 0.05) or in 2011 and 2016 (Dunn test z = 3.02, p > 0.05).
Figure 3. Distribution of the (a) seawater temperature, (b) chlorophyll fluorescence and (c) small zooplankton (ind. m−3) over seven summer seasons (2010–16) at 20–30-m depth layer along transect on the West Spitsbergen Shelf. Note the scale difference.
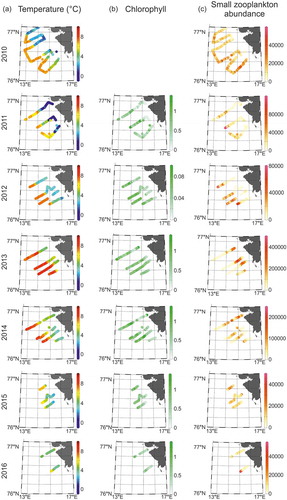
Chlorophyll fluorescence also differed significantly over the years of study (Kruskal-Wallis test H = 5589.95 p < 0.001) and between zones (Kruskal-Wallis test H = 4445.97, p < 0.001). The greatest differences were noted between 2012 and 2013 (Dunn test z = 59.24, p < 0.05) and between Arctic and Atlantic zones (Dunn test z = 64.70, p < 0.05). The lowest chlorophyll fluorescence was found in 2012, and the highest in 2013 and 2014 ().
Statistically significant differences were found in small zooplankton abundance over years (Kruskal-Wallis test H = 23,843.95, p < 0.001) and zones (Kruskal-Wallis test H = 8143.1, p < 0.001). The greatest differences were noted between 2013 and 2014 (Dunn test z = 149.76, p < 0.05), 2010 and 2014 (Dunn test z = 106.52, p < 0.05) and between Arctic and Atlantic zones (Dunn test z = 86.77, p < 0.05). In general, the small zooplankton was the most abundant in 2013 in the Arctic Zone and the lowest abundances were noted in 2014 in all three zones, and in 2012 in the Arctic and Frontal zones (, ).
Table 1. Average abundance (ind. m−3) of the small size fraction over seven summer seasons (2010–16) in three zones (Arctic, Frontal and Atlantic) of the WSS at 20–30-m depth.
Table 2. Average abundance (ind. m−3) of the small size fraction (small) and the Calanus size fraction (large) over five summer seasons (2012–16) in three zones (Arctic, Frontal and Atlantic) of the WSS in the upper 50 m layer.
Large versus small zooplankton in relation to environmental conditions: vertical perspective in the upper 50 m
In 2012 the largest percentage of large zooplankton, reaching on average 25–30% was observed in the lower temperature Arctic and Frontal zones, in contrast to the Atlantic Zone, which contained the lowest share of large zooplankton (not exceeding on average 5 %) in the total zooplankton abundance (). The observed values of chlorophyll fluorescence in all three zones were similar and very low (<0.1; ).
Figure 4. Vertical profiles of the mean and 95% CI of the (a) water temperature, (b) chlorophyll fluorescence and (c) percentage of large zooplankton in total plankton abundance the upper 50 m water layer over five summer seasons (2012–16) in three different zones (Arctic Zone marked in blue, Frontal Zone marked in green and Atlantic Zone marked in orange).
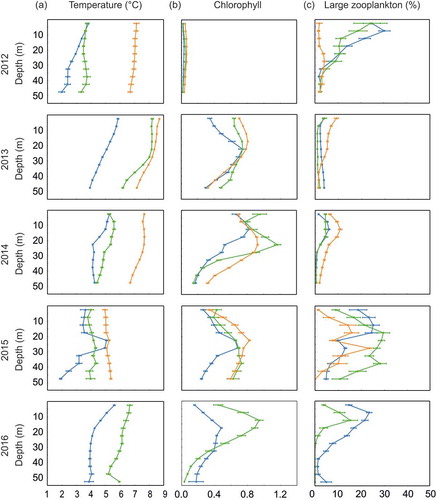
The observed seawater temperatures in all three zones in 2013 were significantly higher than in the previous year, while the average percentage of large zooplankton in total plankton abundance was significantly lower, being less than 10% (). The highest percentage of large zooplankton was found in the warmest Atlantic Zone, mainly in the upper 30 m, while in the Arctic and Frontal zones the percentage of large organisms in total plankton abundance remained relatively low and constant throughout the 50 m water column (). The peak of chlorophyll fluorescence was recorded at about 20-m depth layer in all three zones ().
In 2014 (and similarly in 2013), the sea temperature in all three zones was relatively high, but the temperature values in the Frontal Zone were closer to those recorded in the Arctic Zone (). The percentage of large zooplankton was relatively low in all three zones, not exceeding 12% on average (). The highest share of large organisms was observed in the Atlantic Zone with a distinct peak at depths of 10–15 m (). A similar distribution, but with slightly lower shares was noted in the Arctic and Frontal zones (). The chlorophyll fluorescence values were relatively high in our survey and their peaks coincided with the highest share of large zooplankton in the Arctic Zone at a depth of about 10–25 m. In the Frontal Zone lower concentrations of chlorophyll fluorescence coincided with a decrease in the percentage representing the large zooplankton fraction ().
The seawater temperatures observed in all three zones in 2015 were lower than in the two preceding years, and closer to the values recorded in 2012 (). Differences between zones were relatively small (). In all three zones, the peak of chlorophyll fluorescence was observed at a depth of 20–30 m (). The average share of large fraction in all zones was relatively high, up to about 30% through almost the whole of the investigated water column (50–0 m) in the Frontal Zone (). The smallest percentage of large fraction was found in the Atlantic Zone (). In the Arctic and Atlantic zones, the highest share of large organisms was detected twice at a depth of the upper 20 m and within 25–30-m depth range in the Atlantic Zone (). The highest percentage of the large fraction was detected in the Frontal Zone within the 20–40-m depth range ().
In 2016, the temperature recorded in the Arctic and at the Frontal Zone was relatively high (). The highest percentage of large organisms was on average 25% in the colder Arctic Zone and around 15% in the Frontal Zone (). In both the Arctic and Frontal zones, the highest percentage of large plankton was observed at the depths of the upper 5–20 m, which coincided with high values of chlorophyll fluorescence within this depth layer ().
Discussion
Plankton measurements performed over seven years in a very dynamic and productive region of the south-west Spitsbergen provided the opportunity to assess the summer temporal variability in spatial distribution of zooplankton in relation to various environmental conditions. Differences in zooplankton distribution and size structure were related to differences in seawater temperature and chlorophyll fluorescence. Our results indicated that with the lower water temperature, the availability of the large fraction – a potential food for predators such as planktivorous seabirds – increased, whereas higher water temperatures favoured the small zooplankton fractions.
Oceanographic conditions strongly influence the species composition and distribution of zooplankton (Scott et al. Citation2000; Beaugrand et al. Citation2002), especially temperature (Mackas et al. Citation2007; Blachowiak-Samolyk et al. Citation2008; Alcaraz et al. Citation2014), which in our study was analysed within different oceanographic domains (Arctic, Atlantic, Frontal). The temperature differed substantially (on average 3–5°C) between Arctic and Atlantic zones. The values obtained within the Frontal Zone were intermediate, but either closer to the Arctic or Atlantic domains, implying a dynamic nature of the position and seawater properties within this sector. As the abundance and size proportions of the zooplankton also differed significantly among various investigated zones, it can be concluded that our classification reflected a natural ecological gradient, since Atlantic and Arctic zones represent separate foraging areas for planktivores (Dale et al. Citation2001; Kwasniewski et al. Citation2010). A 2–4°C temperature increase is predicted by 2100 in the North Atlantic, with an even greater rise in its northern parts (Houghton et al. Citation2001). Temperature has already been reported as the most important environmental driver affecting distribution and abundance of C. glacialis (Broms et al. Citation2009; Matsuno et al. Citation2016); moreover, it influences also the growth and thus the timing and rates of development of calanoids (Huntley & Lopez Citation1992; Møller et al. Citation2012). In addition to the phenology, the abundance, zoogeographic ranges and the size structure of zooplankton are likely to be substantially shifted in a warmer Arctic (Mackas et al. Citation2012).
Since Arctic C. glacialis generally prefers low seawater temperatures (≤ 3°C), the values of 5.1°C (Kwasniewski et al. Citation2012) and/or 6°C (Carstensen et al. Citation2012) were found to be the upper limit for the distribution of the typically Arctic zooplankton representative in the area of our study. This was also the basis for our assumption that in examining the larger Calanus fraction obtained from LOPC measurements we were mainly determining the older life stages of C. glacialis in the Arctic Zone and of C. finmarchicus in the Atlantic Zone. The net zooplankton catches described by Jakubas et al. (Citation2013) in the same area (Arctic-type waters, the Hornsund area) and at the same period as our study (the end of July) showed that C. glacialis represented 70% of the older life stages (CIV, CV and adults) of both mentioned Calanus species and that the fifth copepodite of C. glacialis constituted half of this amount. Moreover, multiyear observations conducted by Kwasniewski et al. (Citation2012) showed the substantial domination of C. glacialis older copepodite stages over C. finmarchicus in the Arctic shelf community at this time of the year.
The smaller the size of the planktonic organisms, the more their distribution depends on the structure of the environment (Trudnowska et al. Citation2016); thus, studying this size fraction provides beneficial information about the relationship between hydrography and zooplankton dynamics. Indeed, the abundance of the small size fraction in the overall zooplankton community was highest in 2013 (), characterized by the maximum water temperature within the Arctic Zone, supporting the prediction that the gradual Atlantification of Arctic waters will result in much higher total zooplankton abundances (Daase & Eiane Citation2007). What is more, relatively high water temperature recorded during this year in the Arctic Zone was similar to that observed in the Atlantic Zone in 2012, which was also related to higher abundance of small zooplankton size fraction. Different size fractions have been shown to exhibit different associations with the environment (Trudnowska et al. Citation2016), and this was also demonstrated in our study, as the highest share of small fraction coincided with higher sea temperatures. A similar association, represented by a decline in Calanus abundance, observed together with the elevated importance of small-sized copepods in the upper 60 m in September 2006/2007 has already been documented in the Fram Strait region (Svensen et al. Citation2011).
The small size plankton fraction was concentrated within 20–30 m (Trudnowska et al. Citation2015) in each of the examined zones over five years of our study, corresponding well with the highest measured chlorophyll fluorescence. However, this clear relation between distribution of small zooplankton and chlorophyll fluorescence may indicate that LOPC data included also phytoplankton colonies or various aggregates (Jackson et al. Citation1997), since the LOPC is not able to distinguish between suspended particulate matter and organisms (Schultes & Lopes Citation2009; Espinasse et al. Citation2014). To minimize this problem, the smallest particles (<0.25 mm ESD), which may include phytoplankton aggregations, suspended matter or marine snow have been excluded from the analysis (Basedow et al. Citation2010; Trudnowska et al. Citation2014; Trudnowska et al. Citation2016). It was assumed that this fraction consisted mainly of smaller mesozooplankton such as Oithona and Pseudocalanus (Trudnowska et al. Citation2014; Trudnowska et al. Citation2015). Similarly, Trudnowska et al. (Citation2016) found the peak of chlorophyll fluorescence at 10–30-m depth in the similar West Spitsbergen Current region. As found in our survey, the greatest patches of the dominant copepod species in the North Sea such as C. finmarchicus, Oithona similis or Acartia spp. were restricted to the 20–30-m depth layer – the zone where the food concentrations were high enough to meet their daily feeding requirements in the summer (Daro Citation1988).
Variation in vertical distribution of the large zooplankton fraction may be explained by habitat selection (Falkenhaug et al. Citation1997; Pearre Citation2003); Calanus species are known to concentrate in the upper water layer during summer to build up lipid reserves for the winter (e.g., Conover & Huntley Citation1991; Kosobokova Citation1999; Falk-Petersen et al. Citation2009). It is known that the surface waters of WSS offer different micro-habitats characterized by various water characteristics (Trudnowska et al. Citation2015). In our study the highest proportion between large versus small size fraction was correlated with low temperature, <4–4.5°C. High-resolution LOPC measurements within the upper 0–50-m depth layer showed that the percentage of large fraction in terms of the total plankton abundance was generally greatest in the upper 20 m. Since the large size fraction consisted of both C. glacialis and C. finmarchicus our results correspond with previous observations showing that C. finmarchicus and C. glacialis predominated in the top surface and subsurface water layer (Trudnowska et al. Citation2015). Patches with the highest proportions of the large fraction were located mainly in the Arctic and Frontal zones during years characterized by lower seawater temperature (2012, 2015 and 2016) and could consist predominately of C. glacialis CV, which is closely related to cold Arctic-origin water masses on the WSS (Weydmann & Kwasniewski Citation2008). This is in agreement with Kwasniewski et al. (Citation2012) who used traditional zooplankton net sampling over years 2001–08 and recognized this part of the Hornsund area as a rich prey source (98% C. glacialis) for foraging planktivorous seabirds. In our investigation in 2013 and 2014 the percentage of large zooplankton was relatively low, not exceeding 10–12% on average, with the highest share of large fraction observed in the Atlantic Zone. However, because the temperature in all three zones, including the Arctic Zone, was relatively high, reaching the upper limit for C. glacialis (Carstensen et al. Citation2012; Kwasniewski et al. Citation2012), it may suggest that in those two years C. finmarchicus could dominate the large size fraction in all three zones, which explains the slightly higher values observed in the Atlantic Zone. In addition, since the differences in the percentage of large zooplankton in the three tested zones in 2013 and 2014 were very small, up to a maximum of 4%, it is very difficult to demonstrate a clear relationship, in contrast to the three colder years, when the maximum difference was up to 30%. The availability of preferred prey, expressed as its percentage in the total zooplankton abundance, seems to be a reliable proxy for assessing the quality of little auk foraging grounds (Kwasniewski et al. Citation2010; Stempniewicz et al. Citation2013). In this context, our study may suggest that the concentration of potential high-quality food in the Arctic and Frontal Zone over colder years and close to the surface in the upper 20 m water layer may be related to potentially more favourable foraging conditions for little auks (Karnovsky et al. Citation2003; Karnovsky et al. Citation2010; Brown et al. Citation2012)
Conclusions
Whilst long-term monitoring is needed to survey general trends in the relationship between temperature and the distribution of the various size fractions of zooplankton, shorter, but reliable time series analyses enable us to follow more subtle climatic fluctuations. Our multi-year study demonstrated existing patterns between environmental conditions and distribution of different zooplankton size fractions in the dynamic and sensitive region of the WSS. Our seven years of research clearly confirmed that plankton size is among the best traits to follow the changes occurring nowadays in marine ecosystems. The relationship between small and large zooplankton fractions varied clearly in response to changes in the oceanographic conditions (e.g., small fraction abundance peaks versus the highest chlorophyll fluorescence values). The obtained trends are in line with previous studies reporting the possible reorganization of the zooplankton size structure towards smaller fractions along with the progressing climate warming in the Arctic. Comprehensive monitoring of this phenomenon will help scientists to elucidate the structure and functioning of the short food webs that drive nutrient and energy flows in the Arctic ecosystems. Observed in our survey trends (e.g., higher availability of food preferred by the little auks in the years when seawater temperature was lower) can be extremely important from the point of view of planktivorous predators in the scenario of further changes in the Arctic environment facing global warming.
Acknowledgements
KB has been supported as a PhD student by the Centre for Polar Studies, Leading National Research Centre, Poland. We thank Joanna Pardus for help with GIS visualizations.
Disclosure statement
No potential conflict of interest was reported by the authors.
Additional information
Funding
References
- Alcaraz M., Felipe J., Grote U., Arashkevich E. & Nikishina A. 2014. Life in a warming ocean: thermal thresholds and metabolic balance of Arctic zooplankton. Journal of Plankton Research 36, 3–12.
- Basedow S., Zhou M. & Tande K.S. 2014. Secondary production at the Polar Front, Barents Sea, August 2007. Journal of Marine Systems 130, 147–159.
- Basedow S.L., Tande K.S. & Zhou M. 2010. Biovolume spectrum theories applied: spatial patterns of trophic levels within a mesozooplankton community at the polar front. Journal of Plankton Research 32, 1105–1119.
- Beaugrand G., Reid P.C., Ibañez F., Lindley A. & Edwards M. 2002. Reorganization of North Atlantic marine copepod biodiversity and climate. Science 296, 1692–1694.
- Blachowiak-Samolyk K., Søreide J.E., Kwasniewski S., Sundfjord A., Hop H., Falk-Petersen S. & Nøst Hegseth E. 2008. Hydrodynamic control of mesozooplankton abundance and biomass in northern Svalbard waters (79–81°N). Deep Sea Research Part II: Topical Studies in Oceanography II 55, 2210–2224.
- Blindheim J., Borokov V., Hansen B., Malmberg S.A., Turrell W.R. & Østerhus S. 2000. Upper layer cooling and freshing in the Norwegian Sea in relation to atmospheric forcing. Deep Sea Research Part I: Oceanographic Research Papers 47, 655–680.
- Bohrer R.N. 1980. Experimental studies on diel vertical migration. In W.C. Kerfoot (ed.): Evolution and ecology of zooplankton communities. Pp. 111–121. London: University Press of New England.
- Broms C., Melle W. & Kaartvedt S. 2009. Oceanic distribution and life cycle of Calanus species in the Norwegian Sea and adjacent waters. Deep Sea Research Part II: Topical Studies in Oceanography II 56, 1910–1921.
- Brown Z.W., Welcker J., Harding A.M.A., Walkusz W. & Karnovsky N.J. 2012. Divergent diving behavior during short and long trips of a bimodal forager, the little auk Alle alle. Journal of Avian Biology 43, 215–226.
- Buchholz F., Werner T. & Buchholz C. 2012. First observation of krill spawning in the High Arctic Kongsfjorden, west Spitsbergen. Polar Biology 35, 1273–1279.
- Carstensen J., Weydmann A., Olszewska A. & Kwasniewski S. 2012. Effects of environmental conditions on the biomass of Calanus spp. in the Nordic Seas. Journal of Plankton Research 34, 951–966.
- Colwell R.K., Mao C.X. & Chang J. 2004. Interpolating, extrapolating and comparing incidence-based species accumulation curves. Ecology 85, 2717–2727.
- Conover R.J. & Huntley M. 1991. Copepods in ice-covered seas – distribution, adaptations to seasonally limited food, metabolism, growth patterns and life cycle strategies in polar seas. Journal of Marine Research 2, 1–41.
- Daase M. & Eiane K. 2007. Mesozooplankton distribution in northern Svalbard waters in relation to hydrography. Polar Biology 30, 969–981.
- Daase M., Eiane K., Aksnes D.L. & Vogedes D. 2008. Vertical distribution of Calanus spp. and Metridia longa at four Arctic locations. Marine Biology Research 4, 193–207.
- Daase M., Falk-Petersen S., Varpe Ø., Darnis G., Søreide J.E., Wold A., Leu E., Berge J., Philippe B. & Fortier L. 2013. Timing of reproductive events in the marine copepod Calanus glacialis: a pan-Arctic perspective. Canadian Journal of Fisheries and Aquatic Sciences 70, 871–884.
- Dale T., Kaartvedt S., Ellertsen B. & Amundsen R. 2001. Large-scale oceanic distribution and population structure of Calanus finmarchicus, in relation to physical environment, food and predators. Marine Biology 139, 561–574.
- Dalpadado P., Ingvaldsen R.B., Stige L.C., Bogstad B., Knutsen T., Ottersen G. & Ellertsen B. 2012. Climate effects on Barents Sea ecosystem dynamics. ICES Journal of Marine Science 69, 1303–1316.
- Daro M.H. 1988. Migratory and grazing behavior of copepods and vertical distributions of phytoplankton. Bulletin of Marine Science 43, 710–729.
- Daufresne M., Lengfellner K. & Sommer U. 2009. Global warming benefits the small in aquatic ecosystems. Proceedings of the National Academy of Sciences of the USA 106, 12788–12793.
- Espinasse B., Carlotti F., Zhou M. & Devenon J.L. 2014. Defining zooplankton habitats in the Gulf of Lion (NW Mediterranean Sea) using size structure and environmental conditions. Marine Ecology Progress Series 506, 31–46.
- Falkenhaug T., Tande K.S. & Semenova T. 1997. Diel, seasonal and ontogenic variations in the vertical distribution of four marine copepods. Marine Ecology Progress Series 149, 105–119.
- Falk-Petersen S., Dahl T.M., Scott C.L., Sargent J.R., Gulliksen B., Kwasniewski S., Hop H. & Millar R.M. 2002. Lipid biomarkers and trophic linkages between ctenophores and copepods in Svalbard waters. Marine Ecology Progress Series 227, 187–194.
- Falk-Petersen S., Haug T., Hop H., Nilssen K.T. & Wold A. 2009. Transfer of lipids from plankton to bubbler of harp and hooded seals off East Greenland. Deep Sea Research Part II: Topical Studies in Oceanography 56, 2080–2086.
- Falk-Petersen S., Sargent J.R. & Hopkins C.C.E. 1990. Trophic relationships in the pelagic Arctic food web. In M. Barnes & R.N. Gibson (eds.): Trophic relationships in the marine environment. Pp. 315–333. Aberdeen: Scotland University Press.
- Frandsen M.S., Fort J., Rigét F.F., Galatius A. & Mosbech A. 2014. Composition of chick meals from one of the main little auk (Alle alle) breeding colonies in northwest Greenland. Polar Biology 37, 1055–1060.
- Gaardsted F., Tande K.S. & Basedow S.L. 2010. Measuring copepod abundance in deep water winter habitats in the NE Norwegian Sea: intercomparison of results from laser optical plankton counter and multinet. Fisheries Oceanography 19, 480–492.
- Garzke J., Ismar S.M.H. & Sommer U. 2016. Climate change affects low trophic level marine consumers: warming decreases copepod size and abundance. Oecologia 177, 849–860.
- Gluchowska M., Trudnowska E., Goszczko I., Kubiszyn A.M., Blachowiak-Samolyk K., Walczowski W. & Kwasniewski S. 2017. Variations in the structural and functional diversity of zooplankton over vertical and horizontal environmental gradients en route to the Arctic Ocean through the Fram Strait. PLoS One 12, e0171715, doi: 10.1371/journal.pone.0171715
- González-Bergonzoni I., Johansen K.L., Mosbech A., Landkildehus F., Jeppesen E. & Davidson T.A. 2017. Small birds, big effects: the little auk (Alle alle) transforms High Arctic ecosystems. Proceedings of the Royal Society B: Biological Sciences 284, 1849.
- Hallegraeff G.M. 2010. Ocean climate change, phytoplankton community responses, and harmful algal blooms: a formidable predictive challenge. Journal of Phycology 46, 220–235.
- Haug T., Bogstad B., Chierici M., Gjøsæter H., Hallfredsson E.H., Høines Å.S., Hoel A.H., Ingvaldsen R.B., Jørgensen L.L., Knutsen T., Loeng H., Naustvoll L.J., Røttinger I. & Sunnanå K. 2017. Future harvest of living resources in the Arctic Ocean north of the Nordic and Barents seas: a review of possibilities and constraints. Fisheries Research 188, 38–57.
- Heckmann L., Drossel B., Brose U. & Guill C. 2012. Interactive effects of body-size structure and adaptive foraging on food-web stability. Ecology Letters 15, 243–250.
- Herman A.W. 1992. Design and calibration of a new optical plankton counter capable of sizing small zooplankton. Deep Sea Research Part A: Oceanographic Research Papers 39, 395–415.
- Herman A.W., Beanlands B. & Phillips E.F. 2004. The next generation of Optical Plankton Counter: the Laser-OPC. Journal of Plankton Research 26, 1135–1145.
- Houghton J.T., Ding Y., Griggs D.J., Noguer N., van der Linden P.J., Xiaosu D., Maskell K. & Johnson C.A. (eds.) 2001. Climate change 2001: the scientific basis. Contribution of Working Group I to the third assessment report of the Intergovernmental Panel on Climate Change. Cambridge: Cambridge University Press.
- Hovinen J.E.H., Wojczulanis-Jakubas K., Jakubas D., Hop H., Berge J., Kidawa D., Karnovsky N.J. & Steen H. 2014. Fledging success of little auks in the High Arctic: do provisioning rates and the quality of foraging grounds matter? Polar Biology 37, 665–674.
- Huntley M.E. & Lopez M.D.G. 1992. Temperature-dependent production of marine copepods: a global synthesis. The American Naturalist 140, 201–242.
- Jackson G.A., Maffione R., Costello D.K., Alldredge A.L., Logan B.E. & Dam H.G. 1997. Particle size spectra between 1 μm and 1 cm at Monterey Bay determined using multiple instruments. Deep Sea Research Part I: Oceanographic Research Papers I 44, 1739–1767.
- Jakubas D., Trudnowska E., Wojczulanis-Jakubas K., Iliszko L., Kidawa D., Darecki M., Blachowiak-Samolyk K. & Stempniewicz L. 2013. Foraging closer to the colony leads to faster growth in little auks. Marine Ecology Progress Series 489, 263–278.
- Jakubas D., Wojczulanis-Jakubas K. & Walkusz W. 2007. Response of dovekie to changes in food availability. Waterbirds 30, 421–428.
- Ji R., Jin M. & Varpe Ø. 2013. Sea-ice phenology and timing of primary production pulses in the Arctic Ocean. Global Change Biology 19, 734–741.
- Karnovsky N.J., Harding A.M.A., Walkusz W., Kwasniewski S., Goszczko I., Wiktor Jr. J., Routti H., Bailey A., McFadden L., Brown Z.W., Beaugrand G. & Grémillet D. 2010. Foraging distributions of little auks Alle alle across the Greenland Sea: implications of present and future Arctic climate change. Marine Ecology Progress Series 415, 283–293.
- Karnovsky N.J., Kwasniewski S., Weslawski J.M., Walkusz W. & Beszczynska-Möller A. 2003. The foraging behavior of little auks in a heterogeneous environment. Marine Ecology Progress Series 253, 289–303.
- Kosobokova K.N. 1999. The reproductive cycle and life history of the Arctic copepod Calanus glacialis in the White Sea. Polar Biology 22, 254–263.
- Kwasniewski S., Gluchowska M., Jakubas D., Wojczulanis-Jakubas K., Walkusz W., Karnovsky N.J., Blachowiak-Samolyk K., Cisek M. & Stempniewicz L. 2010. The impact of different hydrographic conditions and zooplankton communities on provisioning dovekies along the West coast of Spitsbergen. Progress in Oceanography 87, 72–82.
- Kwasniewski S., Gluchowska M., Walkusz W., Karnovsky N.J., Jakubas D., Wojczulanis-Jakubas K., Harding A.M.A., Goszczko I., Cisek M., Beszczynska-Möller A., Walczowski W., Weslawski J.M. & Stempniewicz L. 2012. Interannual changes in zooplankton on the West Spitsbergen Shelf in relation to hydrography and their consequences for the diet of planktivorous seabirds. Journal of Marine Science 69, 890–901.
- Lee R.F., Hagen W. & Kattner G. 2006. Lipid storage in marine zooplankton. Marine Ecology Progress Series 307, 273–306.
- Leising A.W. & Franks P.J.S. 2000. Copepod vertical distribution within a spatially variable food source: a simple foraging-strategy model. Journal of Plankton Research 22, 999–1024.
- Mackas D.L., Batten S. & Trudel M. 2007. Effects on zooplankton of a warmer ocean: recent evidence from the Northeast Pacific. Progress in Oceanography 75, 223–252.
- Mackas D.L., Pepin P. & Verheye H. 2012. Interannual variability of marine zooplankton and their environments: within- and between-region comparisons. Progress in Oceanography 97-100, 1–14.
- Manly B.J.F. 1977. A further note on Kiritani and Nakasuji’s model for stage frequency data including comments on the use of Tukey’s jackknife technique for estimating variances. Researches on Population Ecology 18, 177–186.
- Matsuno K., Abe Y., Yamaguchi A. & Kikuchi T. 2016. Regional patterns and controlling factors on summer population structure of Calanus glacialis in the western Arctic Ocean. Polar Science 10, 503–510.
- Mehlum F. & Gabrielsen G.W. 1993. The diet of High Arctic seabirds in coastal and ice-covered, pelagic areas near the Svalbard Archipelago. Polar Research 11, 1–20.
- Møller E.F., Maar M., Jónasdóttir S.H., Nielsen T.G. & Tönnesson K. 2012. The effect of changes in temperature and food on the development of Calanus finmarchicus and Calanus helgolandicus populations. Limnology and Oceanography 57, 211–220.
- Nilsen F., Cottier F., Skogseth R. & Mattson S. 2008. Fjord–shelf exchanges controlled by ice and brine production: the interannual variation of Atlantic Water in Isfjorden, Svalbard. Continental Shelf Research 28, 1838–1853.
- Pearre S. 2003. Eat and run? The hunger/satiation hypothesis in vertical migration: history, evidence and consequences. Biological Reviews of the Cambridge Philosophical Society 78, 1–79.
- Pinca S. & Huntley M.E. 2000. Spatial organization of particle size composition in an eddy-jet system off California. Deep Sea Research Part I: Oceanographic Research Papers 47, 973–996.
- Post E. 2017. Implications of earlier sea ice melt for phenological cascades in Arctic marine food webs. Food Webs 13, 60–66.
- Post E., Bhatt U.S., Bitz C.M., Brodie J.F., Fulton T.L., Hebblewhite M., Kerby J., Kutz S.J., Stirling I. & Walker D.A. 2013. Ecological consequences of sea-ice decline. Science 341, 519–524.
- Sakshaug E., Johnsen G. & Kovacs K. 2009. Ecosystem Barents Sea. Trondheim: Tapir Academic Press.
- Saloranta E. & Svendsen H. 2001. Across the Arctic Front west of Spitsbergen: high-resolution CTD sections from 1998-2000. Polar Research 20, 174–184.
- Schauer U., Fahrbach E., Østerhus S. & Rohardt G. 2004. Arctic warming through the Fram Strait – oceanic heat transport from three years of measurements. Journal of Geophysical Research—Oceans 109, C06026, doi: 10.1029/203JC001823
- Schlitzer R. 2015. Ocean data view software package, version 4.7.2. Accessed at http://odv.awi.de.
- Schultes S. & Lopes R.M. 2009. Laser optical Plankton Counter and Zooscan intercomparison in tropical and subtropical marine ecosystems. Limnology and Oceanography: Methods 7, 771–784.
- Scott C.L., Kwasniewski S., Falk-Petersen S. & Sargent J.R. 2000. Lipids and life strategies of Calanus finmarchicus, Calanus glacialis and Calanus hyperboreus in late autumn, Konsgsfjorden, Svalbard. Polar Biology 23, 510–516.
- Slagstad D., Ellingsen I.H. & Wassmann P. 2011. Evaluating primary and secondary production in an Arctic Ocean void of summer sea ice: an experimental simulation approach. Progress in Oceanography 90, 117–131.
- Stempniewicz L. 2001. Alle alle little auk. BWP Update. The Journal of Birds of the Western Palearctic 3, 175–201.
- Stempniewicz L., Darecki M., Trudnowska E., Blachowiak-Samolyk K., Boehnke R., Jakubas D., Keslinka-Nawrot L., Kidawa D., Sagan S. & Wojczulanis-Jakubas K. 2013. Visual prey availability and distribution of foraging little auks (Alle alle) in the shelf waters of West Spitsbergen. Polar Biology 36, 949–955.
- Svensen C., Seuthe L., Vasilyeva Y., Pasternak A. & Hansen E. 2011. Zooplankton distribution across Fram Strait in autumn: are small copepods and protozooplankton important? Progress in Oceanography 91, 534–544.
- Taylor A.H., Allen I. & Clark P.A. 2002. Extraction of a weak climatic signal by an ecosystem. Nature 416, 629–632.
- Trudnowska E., Basedow S. & Blachowiak-Samolyk K. 2014. Mid-summer mesozooplankton biomass, its size distribution, and estimated production within glacial Arctic fjord (Hornsund, Svalbard). Journal of Marine Systems 137, 55–66.
- Trudnowska E., Gluchowska M., Beszczynska-Möller A., Blachowiak-Samolyk K. & Kwasniewski S. 2016. Plankton patchiness in the Polar Front region of the West Spitsbergen Shelf. Marine Ecology Progress Series 560, 1–18.
- Trudnowska E., Sagan S., Kwasniewski S., Darecki M. & Blachowiak-Samaolyk K. 2015. Fine-scale zooplankton vertical distribution in relation to hydrographic and optical characteristics of the surface waters on the Arctic shelf. Journal of Plankton Research 37, 120–133.
- Trudnowska E., Szczucka J., Hoppe L., Boehnke R., Hop H. & Blachowiak-Samolyk K. 2012. Multidimensional zooplankton observation on the northern West Spitsbergen Shelf. Journal of Marine Systems 98-99, 18–25.
- Vinogradov G.M. 1997. Some problems of vertical distribution of meso- and macroplankton in the ocean. Advances in Marine Biology 32, 1–92.
- Vogedes D., Eiane K., Båtnes A.S. & Berge J. 2014. Variability in Calanus spp. abundance on fine-to mesoscales in an Arctic fjord: implications for little auk feeding. Marine Biology Research 10, 437–448.
- Walczowski W., Beszczynska-Möller A., Wieczorek P., Merchel M. & Grynczel A. 2017. Oceanographic observations in the Nordic Sea and Fram Strait in 2016 under the IO PAN long-term monitoring program AREX. Oceanologia 59, 187–194.
- Walczowski W. & Piechura J. 2007. Pathways of the Greenland Sea warming. Geophysical Research Letters 34, L10608.
- Walczowski W., Piechura J., Goszczko I. & Wieczorek P. 2012. Changes in Atlantic Water properties: an important factor in the European Arctic marine climate. ICES Journal of Marine Science 69, 864–869.
- Weslawski J.M., Stempniewicz L., Mehlum F. & Kwasniewski S. 1999. Summer feeding strategy of the little auk Alle alle from Bjørnøya, Barents Sea. Polar Biology 21, 129–134.
- Weydmann A., Carstensen J., Goszczko I., Dmoch K., Olszewska A. & Kwasniewski S. 2014. Shift towards the dominance of boreal species in the Arctic: inter-annual and spatial zooplankton variability in the West Spitsbergen Current. Marine Ecology Progress Series 501, 41–52.
- Weydmann A. & Kwasniewski S. 2008. Distribution of Calanus populations in a glaciated fjord in the Arctic (Hornsund, Spitsbergen) – the interplay between biological and physical factors. Polar Biology 31, 1023–1035.
- Wiebe P.H. & Benfield M.C. 2003. From the Hensen net toward four-dimensional biological oceanography. Progress in Oceanography 56, 7–136.
- Woodworth-Jefcoats P.A., Polovina J.J. & Drazen J.C. 2016. Climate change is projected to reduce carrying capacity and redistribute species richness in North Pacific pelagic marine ecosystems. Global Change Biology 23, 1000–1008.
- Zhou M., Tande K.S., Zhu Y. & Basedow S. 2009. Productivity, trophic levels and size spectra of zooplankton in northern Norwegian shelf regions. Deep Sea Research Part II: Topical Studies in Oceanography II 56, 1934–1944.