
Abstract
Hepatic lipidosis (HL) is a serious metabolic disorder that affects transient high-producing dairy cows. However, there are many laboratory methods could help in the assessment of HL in dairy cows, the definite diagnosis of the disease under field conditions remains a challenge because of the non-specificity of clinical parameters. The aim of the study was to investigate the utility of serum biomarkers, and ultrasonography (US) measurement to diagnose HL in dairy cows. Forty Holstein dairy cows underwent physical examination and were divided into three groups: non-HL, mild HL, and severe HL groups based on US findings, and the concentrations of beta-hydroxybutyric acid (BHBA) and nonesterified fatty acids (NEFAs). Ultrasound images showed hyperechoic lesions and increased pixel intensity (PI) values of liver echotexture in the HL groups. A significant increase was observed in mild and severe HL groups in the activity of serum aspartate aminotransferase (AST), alanine aminotransferase (ALT), gamma-glutamyl transferase (GGT), BHBA, NEFAs, malondialdehyde (MDA), and nitric oxide (NO) while the concentrations of triglyceride (TG), glutathione (GSH), and total antioxidant capacity (TAC) were significantly decreased. The classification accuracy was in the interest of NEFAs (cut off 0.62 mmol/L, sensitivity 82.6%, specificity 91.7%, and an AUC of 0.913) and BHBA (cut off 1.35 mmol/L, sensitivity 91.31%, specificity of 86.4%, and an AUC 0.812) as important diagnostic parameters. This study offers new insights into the importance of serum biochemical parameters and oxidative stress biomarkers especially, AST, NEFAs, BHBA, and GSH with the digital values of US images for prompt use of minimally invasive techniques to diagnose HL under farm conditions.
Serum metabolites and oxidative stress indices could diagnose hepatic lipidosis in dairy cows
NEFA and BHBA concentrations and ultrasound digital values can use as a non-invasive way to the classification of hepatic lipidosis degrees in cows under farm condition.
HIGHLIGHTS
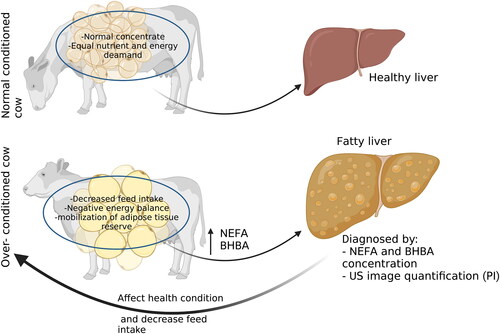
GRAPHICAL ABSTRACT
Introduction
Hepatic lipidosis (HL), which is commonly referred to as fatty liver syndrome, is a multifactorial syndrome affecting periparturient dairy cattle (Imhasly et al. 2014). HL represents a major metabolic problem of most dairy cows in early lactation and is usually associated with economic losses because of decreased milk production, poor reproductive performance, and the general health status of the affected cows (Bobe et al. Citation2004; Shen et al. Citation2018).
The transition period from pregnancy to lactation, which is defined as the period from three weeks before calving until three weeks post-calving, is critical in high-producing dairy cows (Cardoso et al. Citation2013; Shen et al. Citation2018). The occurrence of negative energy balance during the first 2 weeks after parturition and the decrease in feed intake consumption are critical in the pathophysiology of HL (Rossi et al. Citation2008; Gross et al. Citation2011). Moreover, the decrease in nutrients and energy needed for milk production, especially in high lactating cow, enhance the mobilisation of adipose tissue reserves. Subsequently, elevation in the plasma nonesterified fatty acids (NEFAs) which are taken up by the liver, re-esterified to triacylglycerols, and deposited in the form of fat vacuoles inside hepatocytes and causing fatty liver (Adewuyi et al. Citation2005; Gerspach et al. Citation2017).
The liver biopsy test followed by cytological evaluation (Grades der Leberverfettung or Gdl) or quantification of the triglycerides in the sampled parenchyma is most reliable and gold standard test for diagnosis of HL in dairy cows (Kalaitzakis et al. Citation2007). Yet, in clinical practice, the use of such invasive way (i.e. Liver biopsy) is undesirable for many breeders and associated with complications and inevitable risks that make it impractical under farm condition (Eisenberg et al. Citation2003; Starke et al. Citation2011). Hence, various biochemical parameters and liver-specific enzymes such as NEFA and β-hydroxy butyric acid (BHBA), aspartate aminotransferase enzyme (AST), bilirubin and albumin could help in a presumptive diagnosis of HL (Shen et al. Citation2018; Batista et al. Citation2022). Also, the deficiency of amino acids and other active ingredients in the cellular processes could cause problems. The analysis of these metabolomics could offer a detailed description of how high yielding dairy cows respond to metabolic stimuli during the transition period (Imhasly et al. 2014; Gerspach et al. Citation2017; Lisuzzo et al. Citation2022). In addition, during the transition period, dairy cows are usually subjected to multiple stressors that cause an imbalance between oxidative stress and antioxidant capacity (Osorio et al. Citation2014; Abuelo et al. Citation2015; Singh et al. Citation2017). The increase in free radicals and reactive oxygen metabolites production leads to various inflammatory and metabolic disorders including hepatic insufficiency (Bernabucci et al. Citation2005).
In the past, severe HL was diagnosed by ultrasound (US) with linear probes (such as reproductive probes) that lacked the power in comparison of the modern ultrasound scanners (Braun and Steininger Citation2011). In short, Braun and Steininger (Braun and Steininger Citation2011), stated that in severe HL, a lot of fat accumulated and consequently, ultrasound images of the liver were anechoic or isoechoic. With the improvement of the US device, it was seen that especially in mild and moderate HL, authors have seen visual changes in the liver parenchyma (brilliance of the liver and related veins, etc.) (Tharwat et al. Citation2011; Youssef et al. Citation2016; Giannuzzi et al. Citation2021a). On the other hand, other researchers, based on measurements made in the tenth or eleventh intercostal space, have found correlations between the degree of lipidosis, biochemical parameters and measurements of the depth of the liver or in the depth and dimension of the main veins (Fiore et al. Citation2017; Citation2018). Instead, in the last 5 years algorithms have been invented using the evaluation of the texture of the liver parenchyma, but the prediction in percentage of fat content in liver based on correlations made on fat quantifications using liver biopsies need to be validated on a large scale of animals (Banzato et al. Citation2016; Giannuzzi et al. Citation2021b; Piazza et al. Citation2022).
Notably, research on the diagnosis of HL has received minimal attention, with most researchers focusing on the pathophysiology of HL while overlooking its diagnosis probably because of difficult therapy. Here, we aimed to investigate the role of traditional serum biochemical parameters, oxidative stress biomarkers, and US image quantification in the diagnosis of HL in Holstein dairy cows with special regard to its degree based on the results of the receiver operator curve (ROC) analysis.
Material and methods
Animals and descriptive statistics
This study was conducted on three dairy herds in the governorate of Beheira Egypt between September 2020 to May 2021. In total, 77 Holstein dairy cows from the three herds were examined. Forty cows were included in this study while the other 37 cows were excluded because they exhibited clinical signs as evidence of systemic infections such as genital tract infections and fever with or without ketosis. The included cows (i.e. 40 cows) were (mean ± SD) 5.9 ± 1.2 years old, weighing 500.35 ± 49 kg, parity 1.925 ± 0.82, and an average milk yield of 32.45 ± 5.21 kg/d. A schematic illustration for the study design and classification of the Holstein dairy cows is included (Figure ). All animals underwent a thorough physical examination including assessment of feed intake, milk yield, rectal temperature, respiratory rate, and heart rate, as well as auscultation and percussion of both sides of the abdomen. The body condition score (BCS) of each cow was recorded as described previously (Roche et al. Citation2004) (Table ). All cows were kept in closed tie-stall barns with free access to water, the animals were received the same diet components which consisted of a total mixed ration of 60.1% concentrate and 39.9% roughage (dry matter DM basis) and feed three times daily and milked 3 times a day. The inclusion criteria for considering the 40 Holstein cows were at risk of HL as they fulfil the following: (I) clinical signs compatible with liver disease ranged from mild to severe anorexia, lethargy, and decrease in milk production. (II) historical onset of disease (early lactation stage (mean ± SD; 21.7 ± 6 DIM). (III) serum biochemistry analysis. The cows were categorised into three groups, namely, non-HL (n = 10, NEFAs <0.4 mEq/L, and BHBA <1 mmol/L), mild HL (n = 11, NEFAs 0.4 − 0.7 mEq/L, and BHBA − 1.8 mmol/L), and severe HL (n = 19, NEFAs >0.7 mEq/L, and BHBA >1.8 mmol/L) with optimal cut-off value of 0.62 mEq/L and 1.35 mmol/L for NEFA and BHBA, respectively.
Figure 1. Flow diagram outlining the study design, sampling process and classification of the Holstein dairy cows into three groups. DIM: days in milk; ROC: receiver operating characteristic; PI: pixel intensity; NEFA: nonesterified fatty acid; BHBA: beta-hydroxybutyric acid; HL; hepatic lipidosis.

Table 1. Clinical signs of the three groups of Holstein dairy cows.
The current study was carried out according to the regulations agreed by the Ethical Board of Animal Experimentation and Diseases at the Faculty of Veterinary Medicine, Damanhour University (DMU/VetMed-2021-/0150).
Laboratory analysis
Blood samples were collected after 21.8 ± 5.9 days after calving from the jugular vein into disposable plain vacutainer tubes and placed in an upright position for 20 min at room temperature before centrifugation at 1750 g for 10 min in an Ultra8F centrifuge (LW scientific, CAT No. ULC-01AF-17501, US). Subsequently, the serum was carefully harvested and decanted into plastic Eppendorf tubes at −20 °C. Serum samples were then shipped on dry ice to a specialised laboratory for the analysis of biochemical and oxidative stress markers. The liver enzymes alanine aminotransferase (ALT), aspartate aminotransferase (AST), and gamma-glutamyl transferase (GGT) were analysed using commercial kits (Human Co., Germany). Commercial test kits (Ben-Biochemical Enterprise, Italy) were used to assay BHBA, triglyceride (TG), and NEFAs concentrations. Oxidative stress profiles were determined by assessing the serum glutathione (GSH), malondialdehyde (MDA), and nitric oxide (NO) concentrations as well as the total antioxidant capacity (TAC) through colorimetric assay using available commercial kits. All serum biochemical and oxidative stress parameters were measured spectrophotometrically (5010 V5+, photometer, RIELE Co. Germany), according to the manufacturer’s guidelines (Jerry Kaneko et al. Citation2008; Bjerre-Harpøth et al. Citation2012; Osorio et al. Citation2013).
Hepatic ultrasound examination
Ultrasound imaging was carried out on the same day of blood sampling using a SonoScape M12 Expert E1V Veterinary Ultrasound scanner (Toshiba Inc., Tokyo, Japan) with convex probe. Transcutaneous US examination was performed on all cows in a standing position under no sedation. The area of interest, the right abdominal wall from the 6th to 12th intercostal spaces (ICSs) was clipped, washed, and disinfected with 70% alcohol (Fujifilm Wako Pure Chemical Co. Japan), and covered with US transmission gel. Firstly, the liver was examined for the presence of any morphological lesions (e.g. tumour and abscess). After that, the ICS of 10th and 11th were carefully scanned in a dorsoventral direction with the probe held parallel to the ribs. The ultrasound settings were kept constant for visualisation of all cows in this study with frequency 2.5 MHz at depth 20 cm, gain 90% and time-gain compensation remained in neutral position. US images from each group were captured, excluding large blood vessels (as possible), to avoid misinterpretation of further quantification. Images were retrieved on an internal magnetic disc and copied to a personal computer for further analysis.
Pixel intensity (PI) values were used to assess liver echotexture. The PI value determines the average pixel value within a selected scanned area of the liver based on a greyscale of 1–255, with one representing blackish-gray colouration (i.e. normal liver tissue) and 255 denoting white colouration or brightness suggestive of liver echotexture deterioration due to fat deposition in fatty liver syndrome. In the current study, Adobe Photoshop CC software (version 2019) was used to measure the PI values of US images in all groups. Values collected from 10 images in each group (at least one image per cow) were averaged for statistical analysis. The captured images were calculated using the spot methods in Adobe Photoshop CC software. A total of three rectangular-shaped spots (5 × 10 mm) were positioned on each saved image of similar hepatic parenchyma, excepting artefacts (i.e. portal vein, gall bladder, and abdominal wall) as much as possible. The procedure for using the computer software was blindly operated by three investigators (one author and two external investigators). The average measurements of the three investigators were used for statistical analysis and HL discrimination between cows.
Statistical analysis
Following the exclusion criteria mentioned above, the data collected from the preliminary classification of the three groups of 40 Holstein dairy cows were used for statistical analysis. All values were verified for normal distribution through Shapiro–Wilk method. Data were analysed by computer software using the one-way analysis of variance by GraphPad Prism7 version 7.01 (Graph Pad Software Inc., San Diego, California). Bonferroni’s post hoc test was used to detect the significance among variables. In order to determine the main effect, a preliminary analysis was performed including the descriptive variables such as herd differences, DIM, and parity. No association have been noticed between the probability of HL and the effect of herd (p = 0.49), parity (p = 0.10) and DIM (p = 0.13) variables which were considered fixed effects with no statistical difference in the model analysis. The concentration of NEFA and BHBA were considered the main risk values of interest associated with disease development, so both metabolites are treated as continuous variables. To further evaluate if the concentration of NEFA and BHBA can be used as predictors for the degree of HL in Holstein dairy cows, the sensitivity and specificity of those parameters were calculated. The discrimination efficacy based on these parameters was measured by the receiver operating characteristics (ROC) curve (Gardner and Greiner Citation2006). The area under the curve (AUC), sensitivity (true positive fraction), and specificity (true negative fraction) were measured to determine the power of these parameters to show significant differences between the non-HL, mild HL, and severe HL groups. The point on the ROC curve that had the highest collective sensitivity and specificity was reflected the critical threshold. Pearson’s correlation was used to explore the relationship of the digital values of US images (PI) with serum biochemical and oxidative stress parameters. The calculation of possible correlation (p < 0.3 = weak correlation, 0.3 < p < 0.6 = mild correlation, 0.6 <p < 1.0 strong correlation, + or – indicate positive or negative correlation, respectively. In all statistical analyses, p < 0.05 was considered significant.
Results
Clinical findings
Most of the investigated Holstein dairy cows had no prominent clinical signs except inappetence and decreased milk yield and were physiologically healthy. Respiratory rate, temperature, and heart rate were not significantly different among the groups. On contrast, the body condition score (BCS) was significant (p < 0.01) between the three groups and found to be 2.2 ± 0.1, 2.9 ± 0.4, and 3.3 ± 0.8 for the non-HL, mild HL, and severe HL group, respectively (Table ).
Biochemical and oxidative stress analysis
The concentrations of serum biochemical markers are compared between the 3 groups of dairy cows (Figure ). Serum enzymes AST, ALT, and GGT were significantly higher in cows suffering from mild and severe HL than in non-HL cows (p < 0.001, 0.01, and 0.01, respectively). Similarly, the concentrations of BHBA and NEFAs were greater in the mild and severe HL groups compared to the non-HL group (p < 0.001 and 0.001, respectively). On the other hand, serum TG concentration was found to be significantly lower in both HL groups than in the non-HL group (p <0.01). Furthermore, compared with mild HL, cows with severe HL showed increase in the activity of AST, ALT, and GGT, higher concentration of BHBA, NEFAs, and significantly lower TG (p <0.001). Compared with the non-HL group, cows with mild and severe HL had significantly higher serum MDA and NO concentrations but lower levels of GSH and TAC (p <0.001 and 0.01, respectively). Non-significant difference was observed between the mild HL and non-HL groups concerning the concentrations of oxidative biomarkers except MDA (Figure ).
Figure 2. Comparison of serum biochemical parameters in the blood of the three groups of dairy cows collected around three weeks (21.7 ± 6 DIM) after parturition. (*) represents p < 0.05, (**) represents p < 0.01, and (***) represents p < 0.001. Abbreviations: AST: aspartate aminotransferase; GGT: gamma-glutamyl transferase; ALT: alanine aminotransferase; BHBA: beta-hydroxybutyric acid; NEFAs: nonesterified fatty acids; TG: triglyceride, HL: hepatic lipidosis.

Figure 3. Comparison of oxidative stress biomarkers in the blood of the three groups of dairy cows collected around three weeks (21.7 ± 6 DIM) after parturition. (*) represents p < 0.05, (**) represents p < 0.01, and (***) represents p < 0.001. Abbreviations: MDA: malondialdehyde; NO: nitric oxide; GSH: glutathione; TAC: total antioxidant capacity; HL: hepatic lipidosis.

Hepatic US findings
Ultrasound examination of the liver echotexture was thoroughly undertaken in all groups. On the hepatic US images of cows with mild and severe HL, the liver appeared brighter than normal with a highly echogenic texture due to the sharp beam reflectivity of the hepatic parenchyma, suggesting diffuse fatty liver disease caused by the accumulation of fat vacuoles in hepatocytes. Focal hyperechoic lesions of various shapes, sizes, and locations in the HL groups were observed (Figure ). During the US examination of non-HL cows, we noticed many fine echoes with a homogenous distribution all over the scanned areas of the liver parenchyma, which appeared more echogenic than the renal cortex and spleen. PI values were used for the quantitative analysis of hepatic US images. The values of the three investigators were checked for the normal distribution and successfully passed using the Shapiro–Wilk test. There is no significant difference between operators and the obtained measurements were positively correlated. The PI values of US images were significantly larger in the severe HL group compared with the mild and non-HL groups (p <0 .01 and 0.001, respectively) (Figure ).
Figure 4. US images of the liver in the three study groups were carried out on the same day of blood collection. (a) The non-HL group, showing homogeneously distributed fine echoes all over the entire liver parenchyma. (b) The mild HL group, showing mild focal white lesions in the liver tissue (arrows). (c) The severe HL group, appearing brighter than the other 2 groups, with severe fatty infiltration over the liver parenchyma (arrows). Abbreviations: AW: abdominal wall; HV: hepatic vein; HP: hepatic lipidosis; US: ultrasound.

Figure 5. (a) US image processing in Adopephotoshop software, 3 designated square in each image represent the selected area of measurement, lasso spot was used to mark the outlines of the artefacts or blood vessels. (b) PI values of the hepatic US images from the study groups. The severe HL group had higher PI values than did the mild HL and non-HL groups. (**) represents p < 0.01, and (***) represents p < 0.001. Abbreviations: PI: pixel intensity; US: ultrasound; HL: hepatic lipidosis.

The correlations between PI values and serum biomarkers for the detection of HL in dairy cows are presented (Table ). In the mild HL group, the PI value exhibited moderately to strongly significant positive correlations with the serum concentrations of AST (r = 0.79, p =0.01), BHBA (r = 0.61, p =0.001), and NEFAs (r = 0.72, p =0.008) as well as a strongly significant negative correlation with the serum GSH concentration (r = −0.78, p =0.02). In the severe HL group, however, strongly significant positive correlations were observed between the PI value and AST (r = 0.71, p =0.001), BHBA (r = 0.82, p =0.0001), and NEFAs (r = 0.76, p =0.01); moreover, the PI value was found to be strongly and negatively correlated with GSH (r = −0.82) and TAC (r = −0.71).
Table 2. The correlations between the PI values of US images and biochemical and oxidative stress parameters in the study groups.
Biochemical classification and accuracy of detection
The accuracy of the classification of NEFAs to discriminate the non-HL cows from the affected dairy cows was tested as the mild HL group (NEFAs 0.4–0.7 mmol/L) or severe HL group (NEFAs >0.7 mmol/L). NEFAs concentration proved to be a good predictor of fatty liver in dairy cows and classified them as mild and severe HL cows with an AUC of 0.913 (95% CI, 0.90–0.98), and the optimal cut-off value of 0.62 mmol/L provided a sensitivity of 82.6% and a specificity of 91.7% (Figure ). Likewise, the classification based on BHBA concentration revealed 2 groups, mild HL (BHBA 1–1.8 mmol/L) and severe HL (BHBA >1.8 mmol/L), with an AUC of 0.812 (95% CI, 0.810–0.889), and the cut-off at 1.35 mmol/L yielded a sensitivity of 91.31% and a specificity of 86.4% (Figure ).
Figure 6. (a) Results of the receiver operator curve (ROC) for cows classified under non-HL, mild HL, and severe HL groups if NEFAs <0.4–0.7 < mmol/L, respectively. The AUC was 0.913 (95% CI, 0.90–0.98), and the optimal cut-off value of 0.62 mmol/L provided a sensitivity of 82.6% and a specificity of 91.7%. (b) Results of the receiver operator curve (ROC) for cows classified as non-HL, mild HL, and severe HL if BHBA <1–1.8 < mmol/L, respectively. The AUC was 0.812 (95% CI, 0.810–0.889), and the cut-off at 1.35 mmol/L yielded a sensitivity of 91.31% and a specificity of 86.4%.

Discussion
High-milking dairy cows in transition stage are prone to negative energy balance which usually complicated with various metabolic disorder such as mobilisation of adipose tissue fat. Hepatic lipidosis is one of the most common metabolic disorders occurs in this stage, the incidence of which may increase to 50% during the transition period (Bobe et al. Citation2004). In the current study, HL was reported in 75% (30 cows out of 40) of the studied group (mild HL, 27.5%; severe HL, 47.5%). The percentage of HL in our study is greater than the previously reported incidence rate of 53.6% in the same postpartum period (approximately 30 days after calving) (Shen et al. Citation2018).
The tools that able to monitor the hepatic status under the field condition are lacking. We aimed in this study to investigate the utility of traditional serum biochemical and oxidative stress parameters in diagnosing HL and their relationship with one of the non-invasive promising tools used for the detection of HL in dairy cows, US.
Under farm conditions, the use of ultrasonographic measurments and serum biochemical parameters is still an easy-to-perform method for rapid screening of metabolic disorders in dairy cows. Within this scenario, we can reduce the negative outcomes of the liver biopsy approach, such as invasiveness, sampling errors, post-technique consequences, and time consumption (Bobe et al. Citation2008; Sumida et al. Citation2014; Melendez et al. Citation2018). The serum enzymes AST, ALT, and GGT were higher in Holstein dairy cows suffering from mild and severe HL, which is probably attributable to the existence of pathological conditions in hepatocytes and/or necrotic changes in the liver. These enzymes are concentrated inside hepatocytes and are extensively increased in the blood circulation following morpho pathological changes in the composition of the hepatocellular membrane (MacNeill Citation2009; González et al. Citation2011). We also found that the concentration of AST was highest among the other serum enzymes, which gave it special diagnostic importance for liver injury due to fatty infiltration and this is in agreement with some studies (Kalaitzakis et al. Citation2007; Borchardt Citation2010; González et al. Citation2011; Sun et al. Citation2015). Whereas others (Sumida et al. Citation2014; Melendez et al. Citation2018; Mohsin et al. Citation2021), have reported concerns about the sensitivity of AST as it increases in muscle degeneration. In our study, no cows were classified as downer cows in which the elevation of AST is mainly attributed to liver damage. HL due to fat deposition rarely causes intrahepatic duct obstruction, thus casting doubt on the importance of elevated serum GGT and ALT concentrations—which are known to be good indicators of cholestasis (Doré et al. Citation2007; Calamari et al. Citation2015)—in the diagnosis of HL. In clinical practice, the use of hepatic serum enzymes is best when conjugated with the US examination of the liver; furthermore, changes in these enzymes could predict the prognosis of HL over the treatment period.
Metabolic parameters can be used to assess the animal welfare. Among these parameters are the concentration of BHBA and NEFAs (Ospina et al. Citation2010). A recent study has used BHBA and NEFAs concentrations to determine a critical threshold for defining clinical diseases, such as abomasal displacement, retained placenta, metritis, and ketosis. In line with this report, we used both parameters to identify different degrees of HL in dairy cows. A cut-off value of 0.62 mmol/L for NEFAs could be considered as a guideline to identify cows with HL, which is closely related to the critical threshold of 0.6 mmol/L reported previously for the detection of some clinical diseases. Concerning BHBA, we identified 1.35 mmol/L as the optimal cut-off value for detecting HL in Holstein dairy cattle, which is higher than the threshold (≥ 10 mg/dL or ≥ 0.55 mmol/L) reported previously (Ospina et al. Citation2010). The sensitivity of the cut-off values for BHBA and NEFAs in the current study was 91.31% and 82.6%, respectively, implying that the BHBA threshold would be more accurate in diagnosing postpartum HL, as opposed to the NEFAs threshold. This result is in agreement with previous studies stating that the use of NEFAs is a good indicator of prepartum energy imbalance while BHBA is better for postpartum status (Duffield Citation2000; Ospina et al. Citation2010). Compared with the non-HL group, the serum TG concentration was significantly lower in the mild HL (p < 0.01) and severe HL (p <0.001) groups, which may be attributed to the accumulation of TGs inside hepatocytes (Đoković et al. Citation2005; González et al. Citation2011). Also, cows with severe HL had higher levels of serum MDA and NO and lower levels of GSH and TAC. These changes in the oxidative stress profile might have been caused by alterations in the function of hepatocytes after fat accumulation in the liver and increased vulnerability to reactive oxygen metabolites and the inability of hepatic cells to produce endogenous antioxidants, which is in agreement with previous studies (Cichoz-Lach and Michalak Citation2014; Tariq et al. Citation2014; Konvičná et al. Citation2015; Passos et al. Citation2015).
Ultrasound examination of the liver parenchyma showed beam attenuation and backscattering. Fine echogenicity, focal hyperechoic lesions of various shapes and sizes, and increased vascular blurring, as well as increased hepatic size and rounded margins, were observed, which is in agreement with previous literature (Braun Citation1996; Mahdi Komeilian et al. Citation2011). The hyperechoic features of fatty liver disease are probably attributable to the echotexture of liver tissue, which enforces US beams to attenuate. To avoid interobserver variability in the assessment of US images between veterinarians, we analysed US images quantitatively using PI, the mean gray value intensity. Many approaches have been introduced to quantify the degree of HL in cattle (Bobe et al. Citation2008; Starke et al. Citation2010; Rafia et al. Citation2012; Weijers et al. Citation2012); however, the current study employed the gray values calculated using Adobe Photoshop CC software. Based on the greyscale of colour changes (1–255), we can evaluate the degree of HL in different images. PI values were found to be highest in the severe HL group, indicating that the US images from this group showed more brightness (white colour) than did the other two groups due to the accumulation of fat vacuoles in the liver parenchyma. The positive significant correlation of PI digital values of US images with AST, NEFAs, BHBA, and GSH data confirmed the diagnostic value of these parameters for HL disease in dairy cows with, at least partially, overwhelming of the faults of direct evaluation of hepatic echogenicity. Overall, our findings demonstrated that the measurement of some biochemical parameters (e.g. AST, NEFAs, and BHBA) could be coupled with US examination and PI quantification to detect HL in Holstein dairy cows, and to determine different grades of HL.
The findings of the current study have to be considered in presence of some limitations. First, although several steps have been taken to prevent disease misclassification (case definition, careful follow-up), the absence of the gold standard technique such as liver biopsy test may induce misclassification of the disease between studied cows. We tested only the critical threshold of NEFA and BHBA that represented good diagnostic importance for HL in dairy cows in this study, but we did not explore the importance of the critical threshold of other biochemical parameters which could be investigated in future studies. Also, a study to validate the promising PI technique with a gold standard test such as a liver biopsy test or histopathological evaluation should be performed in future analysis.
Conclusion
This study exploited that the measurement of serum biochemical parameters—especially AST, NEFAs, and BHBA—and investigation of oxidative stress profiles are of diagnostic importance in determining the degrees of HL in Holstein dairy cows under the farm condition. Moreover, the digital value of hepatic ultrasonogram image could be used as a promising rapid non-invasive and on-farm method for diagnosis of HL in Holstein dairy cows along with other biochemical parameters. Future investigations on a larger sample size are needed to prompt the use of these parameters for the early diagnosis of HL in dairy cows.
Ethical approval
The current study was carried out according to the regulations agreed by the Ethics Team of Animal Experimentation and Diseases at the Faculty of Veterinary Medicine, Damanhour University (DMU/VetMed-2021-/0150).
Supplemental Material
Download MS Word (816.8 KB)Acknowledgment
The authors would like to extend their best regards to the Damanhour University, Egypt and the Mission Sector, Ministry of High Education, Egypt and Deanship of Scientific Research (DSR), King Khalid University, Abha, Saudi Arabia, under grant no. RGP.1/282/43. Also, the authors would like to thank Professor Mervat A. Abdel-latif for her support.
Disclosure statement
No potential conflict of interest was reported by the author(s).
Data availability statement
The data of this study are available from the corresponding author, [AE], upon reasonable request.
References
- Abuelo A, Hernández J, Benedito JL, Castillo C. 2015. The importance of the oxidative status of dairy cattle in the periparturient period: revisiting antioxidant supplementation. J Anim Physiol Anim Nutr. 99(6):1003–1016.
- Adewuyi AA, Gruys E, van Eerdenburg FJCM. 2005. Non esterified fatty acids (NEFA) in dairy cattle. A review. Vet Q. 27(3):117–126.
- Banzato T, Fiore E, Morgante M, Manuali E, Zotti A. 2016. Texture analysis of B-mode ultrasound images to stage hepatic lipidosis in the dairy cow: a methodological study. Res Vet Sci. 108:71–75.
- Batista CP, Gonçalves RS, Contreras LVQ, De Faria Valle S, González F. 2022. Correlation between liver lipidosis, body condition score variation, and hepatic analytes in dairy cows. Rev Bras Med Vet. 44:e005121.
- Bernabucci U, Ronchi B, Lacetera N, Nardone A. 2005. Influence of body condition score on relationships between metabolic status and oxidative stress in periparturient dairy cows. J Dairy Sci. 88(6):2017–2026.
- Bjerre-Harpøth V, Friggens NC, Thorup VM, Larsen T, Damgaard BM, Ingvartsen KL, Moyes KM. 2012. Metabolic and production profiles of dairy cows in response to decreased nutrient density to increase physiological imbalance at different stages of lactation. J Dairy Sci. 95(5):2362–2380.
- Bobe G, Amin VR, Hippen AR, She P, Young JW, Beitz DC. 2008. Non-invasive detection of fatty liver in dairy cows by digital analyses of hepatic ultrasonograms. J Dairy Res. 75(1):84–89.
- Bobe G, Young JW, Beitz DC. 2004. Invited review: pathology, etiology, prevention, and treatment of fatty liver in dairy cows. J Dairy Sci. 87(10):3105–3124.
- Borchardt S. 2010. Untersuchungen zum Einsatz der NEFA und der BHB zur Stoffwechselüberwachung von Transitkühen unter besonderer Berücksichtigung von gepoolten Serumproben . Dissertation, Freien Universität Berlin D188.
- Braun U. 1996. Ultrasonographic examination of the liver and gallbladder in cows: normal findings. Compend Contin Educ Pract Vet. 18(Suppl 2):1255–1269.
- Braun U, Steininger K. 2011. Ultrasonographic characterization of the liver, caudal vena cava, portal vein, and gallbladder in goats. Am J Vet Res. 72(2):219–225.
- Calamari L, Gobbi L, Russo F, Piccioli Cappelli F. 2015. Pattern of γ-glutamyl transferase activity in cow milk throughout lactation and relationships with metabolic conditions and milk composition. J Anim Sci. 93(8):3891–3900.
- Cardoso FC, LeBlanc SJ, Murphy MR, Drackley JK. 2013. Prepartum nutritional strategy affects reproductive performance in dairy cows. J Dairy Sci. 96(9):5859–5871.
- Cichoz-Lach H, Michalak A. 2014. Oxidative stress as a crucial factor in liver diseases. World J Gastroenterol. 20(25):8082–8091.
- Đoković R, Šamanc H, Bogosavljević-Bošković S, Radović V. 2005. Changes of characteristic blood parameters in ketotic cows. Veterinarski glasnik. 59(supl. 1-2):221–228.
- Doré E, Fecteau G, Hélie P, Francoz D. 2007. Liver abscesses in Holstein dairy cattle: 18 Cases (1992–2003). J Vet Intern Med. 21(4):853–856.
- Duffield T. 2000. Subclinical ketosis in lactating dairy cattle. Vet Clin North Am Food Anim Pract. 16(2):231–253.
- Eisenberg E, Konopniki M, Veitsman E, Kramskay R, Gaitini D, Baruch Y. 2003. Prevalence and characteristics of pain induced by percutaneous liver biopsy. Anesth Analg. 96(5):1392–1396.
- Fiore E, Perillo L, Morgante M, Giudice E, Contiero B, Curone G, Manuali E, Pavone S, Piccione G, Gianesella M. 2018. Ultrasonographic measurement of liver, portal vein, hepatic vein and perivisceral adipose tissue in high-yielding dairy cows with fatty liver during the transition period. J Dairy Res. 85(4):431–438.
- Fiore E, Piccione G, Perillo L, Barberio A, Manuali E, Morgante M, Gianesella M. 2017. Hepatic lipidosis in high-yielding dairy cows during the transition period: haematochemical and histopathological findings. Anim Prod Sci. 57(1):74–80.
- Gardner IA, Greiner M. 2006. Receiver-operating characteristic curves and likelihood ratios: improvements over traditional methods for the evaluation and application of veterinary clinical pathology tests. Vet Clin Pathol. 35(1):8–17.
- Gerspach C, Imhasly S, Gubler M, Naegeli H, Ruetten M, Laczko E. 2017. Altered plasma lipidome profile of dairy cows with fatty liver disease. Res Vet Sci. 110:47–59.
- Gerspach C, Imhasly S, Klingler R, Hilbe M, Hartnack S, Ruetten M. 2017. Variation in fat content between liver lobes and comparison with histopathological scores in dairy cows with fatty liver. BMC Vet Res. 13(1):98.
- Giannuzzi D, Tessari R, Pegolo S, Fiore E, Gianesella M, Trevisi E, Ajmone Marsan P, Premi M, Piccioli-Cappelli F, Tagliapietra F, et al. 2021a. Associations between ultrasound measurements and hematochemical parameters for the assessment of liver metabolic status in Holstein–Friesian cows. Sci Rep. 11(1):1–15.
- Giannuzzi D, Tessari R, Pegolo S, Fiore E, Gianesella M, Trevisi E, Ajmone Marsan P, Premi M, Piccioli-Cappelli F, Tagliapietra F, et al. 2021b. Associations between ultrasound measurements and hematochemical parameters for the assessment of liver metabolic status in Holstein–Friesian cows. Sci Rep. 11(1):16314.
- González FD, Muiño R, Pereira V, Campos R, Benedito JL. 2011. Relationship among blood indicators of lipomobilization and hepatic function during early lactation in high-yielding dairy cows. J Vet Sci. 12(3):251–255.
- Gross J, van Dorland HA, Bruckmaier RM, Schwarz FJ. 2011. Performance and metabolic profile of dairy cows during a lactational and deliberately induced negative energy balance with subsequent realimentation. J Dairy Sci. 94(4):1820–1830.
- Imhasly S, Naegeli H, Baumann S, von Bergen M, Luch A, Jungnickel H, Potratz S, Gerspach C. 2014a. Metabolomic biomarkers correlating with hepatic lipidosis in dairy cows. BMC Vet Res. 10(1):122.
- Jerry Kaneko J, Harvey JJ, Bruss ML. 2008. Clinical biochemistry of domestic animals. San Diego: Academic Press.
- Kalaitzakis E, Roubies N, Panousis N, Pourliotis K, Kaldrymidou E, Karatzias H. 2007. Clinicopathologic evaluation of hepatic lipidosis in periparturient dairy cattle. J Vet Intern Med. 21(4):835–845.
- Konvičná J, Vargová M, Paulíková I, Kováč G, Kostecká Z. 2015. Oxidative stress and antioxidant status in dairy cows during prepartal and postpartal periods. Acta Vet Brno. 84(2):133–140.
- Lisuzzo A, Laghi L, Faillace V, Zhu C, Contiero B, Morgante M, Mazzotta E, Gianesella M, Fiore E. 2022. Differences in the serum metabolome profile of dairy cows according to the BHB concentration revealed by proton nuclear magnetic resonance spectroscopy (1H-NMR). Sci Rep. 12(1):2525.
- MacNeill A. 2009. Clinical biochemistry of domestic animals, 6th edition by editors: J. Jerry Kaneko, John W. Harvey, and Michael L. Bruss. Vet Clin Pathol 38(4):545–545.
- Mahdi Komeilian M, Sakha M, Gholi Nadalian M, Veshkini A. 2011. Hepatic ultrasonography of dairy cattle in postpartum period: finding the sonographic features of fatty liver syndrome. Aust J Basic Appl Sci. 5(8):701–706.
- Melendez P, Whitney M, Williams F, Pinedo P, Manriquez D, Moore SG, Lucy MC, Pithua P, Poock SE. 2018. Technical note: evaluation of fine needle aspiration cytology for the diagnosis of fatty liver in dairy cattle. J Dairy Sci. 101(5):4483–4490.
- Mohsin MA, Yu H, He R, Wang P, Gan L, Du Y, Huang Y, Abro MB, Sohaib S, Pierzchala M, et al., 2021. Differentiation of subclinical ketosis and liver function test indices in adipose tissues associated with hyperketonemia in postpartum dairy cattle. Front Vet Sci. 8:796494.
- Osorio JS, Ji P, Drackley JK, Luchini D, Loor JJ. 2013. Supplemental smartamine m or metasmart during the transition period benefits postpartal cow performance and blood neutrophil function. J Dairy Sci. 96(10):6248–6263.
- Osorio JS, Trevisi E, Ji P, Drackley JK, Luchini D, Bertoni G, Loor JJ. 2014. Biomarkers of inflammation, metabolism, and oxidative stress in blood, liver, and milk reveal a better immunometabolic status in peripartal cows supplemented with Smartamine M or MetaSmart. J Dairy Sci. 97(12):7437–7450.
- Ospina PA, Nydam DV, Stokol T, Overton TR. 2010. Evaluation of nonesterified fatty acids and β-hydroxybutyrate in transition dairy cattle in the northeastern United States: critical thresholds for prediction of clinical diseases. J Dairy Sci. 93(2):546–554.
- Passos E, Ascensão A, Martins MJ, Magalhães J. 2015. Endoplasmic reticulum stress response in non-alcoholic steatohepatitis: the possible role of physical exercise. Metabolism. 64(7):780–792.
- Piazza M, Giannuzzi D, Tessari R, Fiore E, Gianesella M, Pegolo S, Schiavon S, Trevisi E, Piccioli-Cappelli F, Cecchinato A, et al. 2022. Associations between ultrasound hepatic measurements, body measures, and milk production traits in Holstein cows. J Dairy Sci. 105(8):7111–7124.
- Rafia S, Taghipour-Bazargani T, Asadi F, Vajhi A, Bokaie S. 2012. Evaluation of the correlation between serum biochemical values and liver ultrasonographic indices in periparturient cows with different body condition scores. Am J Vet Res. 73(6):830–837.
- Roche JR, Dillon PG, Stockdale CR, Baumgard LH, VanBaale MJ. 2004. Relationships among international body condition scoring systems. J Dairy Sci. 87(9):3076–3079.
- Rossi F, Righi F, Romanelli S, Quarantelli A. 2008. Reproductive efficiency of dairy cows under negative energy balance conditions. Ann Fac Medic Vet di Parma. XXVIII:173–180.
- Shen Y, Chen L, Yang W, Wang Z. 2018. Exploration of serum sensitive biomarkers of fatty liver in dairy cows. Sci Rep. 8(1):1–7.
- Singh R, Randhawa SNS, Randhawa CS. 2017. Oxidative stress, hemato-biochemical and plasma mineral profile in transition buffaloes. Proc Natl Acad Sci India Sect B Biol Sci. 87(4):1091–1099.
- Starke A, Haudum A, Weijers G, Herzog K, Wohlsein P, Beyerbach M, de Korte CL, Thijssen JM, Rehage J. 2010. Noninvasive detection of hepatic lipidosis in dairy cows with calibrated ultrasonographic image analysis. J Dairy Sci. 93(7):2952–2965.
- Starke A, Schmidt S, Haudum A, Scholbach T, Wohlsein P, Beyerbach M, Rehage J. 2011. Evaluation of portal blood flow using transcutaneous and intraoperative Doppler ultrasonography in dairy cows with fatty liver. J Dairy Sci. 94(6):2964–2971.
- Sumida Y, Nakajima A, Itoh Y. 2014. Limitations of liver biopsy and non-invasive diagnostic tests for the diagnosis of nonalcoholic fatty liver disease/nonalcoholic steatohepatitis. World J Gastroenterol. 20(2):475–485.
- Sun Y, Wang B, Shu S, Zhang H, Xu C, Wu L, Xia C. 2015. Critical thresholds of liver function parameters for ketosis prediction in dairy cows using receiver operating characteristic (ROC) analysis. Vet Q. 35(3):159–164.
- Tariq Z, Green CJ, Hodson L. 2014. Are oxidative stress mechanisms the common denominator in the progression from hepatic steatosis towards non-alcoholic steatohepatitis (NASH)? Liver Int. 34(7):e180-90–e190.
- Tharwat M, Oikawa S, Buczinski S. 2011. Ultrasonographic prediction of hepatic fat content in dairy cows during the transition period. J Veterinar Sci Technol. 03(01):1–5.
- Weijers G, Starke A, Thijssen JM, Haudum A, Wohlsein P, Rehage J, de Korte CL. 2012. Transcutaneous vs. intraoperative quantitative ultrasound for staging bovine hepatic steatosis. Ultrasound Med Biol. 38(8):1404–1413.
- Youssef M, El-Ashker M, El-Sayed A, Ibrahim F, Awad M. 2016. Hepatic ultrasonography and biochemical alterations in Barki sheep under negative energy balance. Egypt J Chem Environ Health. 2(2):265–281.