
 ?Mathematical formulae have been encoded as MathML and are displayed in this HTML version using MathJax in order to improve their display. Uncheck the box to turn MathJax off. This feature requires Javascript. Click on a formula to zoom.
Abstract
National trotting races held in Spain between 1990–2022 were used to estimate genetic para-meters for 5 precocity criteria: age at first ranked race (AFR), age when the animal reached 50% of ranked races (A50%), age when the animal reached the first 10 ranked races (A10), total number of races in which the animal has competed before the first ranked race (NRC) and percentage of first placings/year of participation (PFP), in order to evaluate their usefulness for genetic evaluation and their possible inclusion in the Spanish Trotter Horse official genetic program. A total of 176,137 records belonging to 4947 animals were used. A Bayesian multivariate BLUP animal model showed heritability values between 0.08 (NRC) and 0.44 (A10). Medium-high genetic co-rrelations were obtained between precocity traits, ranging between −0.78 (A10-PFP) and 0.96 (A50%-A10). NRC and PFP exhibited negative correlations, with the lowest range for NRC. Additionally, a Random Regression Model (RRM) was applied to PFP to evaluate changes in performance during the animals’ sporting life. Heritability values decreased slightly up to 4 years of age (0.26–0.17), with a slight increase after the age of 5 (0.22). Genetic and permanent environmental correlations between age groups were in the high range between the nearest age groups. Variations of the expected breeding values (EBV) over the trajectory of all the age groups allowed us to differentiate robust and plastic animals (animals capable of maintaining sporting potential throughout their lives or not). Correlations between the EBV estimated with both methodologies evidenced the benefits of PFP for the early selection of performance traits in STH. Therefore, the application of an RRM for the PFP trait is recommended as it has shown acceptable heritability and adequate correlations with the rest of the precocity criteria studied. The incorporation of this trait in the breed improvement program will allow breeders to have early genetic information on animal precocity potential and ensure the inclusion of more robust individuals in their mating design.
Introduction
Because of the considerable economic importance worldwide of horse breeding for trotter races, the ge-netic evaluation of performance traits for trotter horses is estimated each year in different countries (Swedish standard-bred, Árnason Citation1999; German, Röhe et al. 2001 and Bugislaus et al. Citation2005; French, Langlois and Blouin, 2004, 2006; Italian, Pieramati et al. Citation2007, Citation2011; and Spanish trotters, Gómez et al. Citation2010a).
The Spanish Trotter Horse (STH) is of particular significance in Spain, participating in approximately 1150 races annually in 7 hippodromes, with around 650 horses taking part each year (FECT Citation2022). As the STH is a composite breed (Gómez et al. Citation2010a), its studbook allows the inclusion of breeding stock from other trotter populations, with registrations largely originating from France, the USA, Sweden, Denmark, Italy, and Germany (ASTROT Citation2022). The main aims of the officially approved breeding program, initiated in 2005, include enhancing functional performance in national and international trot competitions, using a repeatability multivariate BLUP animal model (Gómez et al. Citation2010a). The Association of Breeders and Owners of Trotting Horses (ASTROT) annually publishes a Catalogue of Breeding Stock, selecting animals based on genetic criteria through breeding value estimations, to plan a better selection policy than simply mass selection based on phenotype data (Blouin and Langlois Citation2007). The genetic evaluation is based on the following four criteria: a logarithmic transformation of the annual earnings, the square root of the per-centage of wins/year, time per kilometre, and the best ra-cing time/hippodrome/type of start (Gómez et al. Citation2010a), without any age distinction. While the BLUP model evaluates each trait as a traversal character, assuming that it is controlled by the same genes and with the same gene expression levels, regardless of the age at which each animal is competing (Gómez et al. Citation2011), evidence suggests that gene expression varies between developmental stages and that genes affect the traits, changing the physiology and perfor-mance of trotter horses (Langlois and Vrijenhoek Citation2004; Bugislaus et al. Citation2006; Gómez et al. Citation2010b, Citation2011).
Trotter horses compete over different distances and ages, with careers in Spain spanning from 2 to 18 years or more. Ricard et al. (Citation2000) advocated for economically adaptive horses with superior precocity and longevity. Solé et al. (Citation2017) conducted a longevity analysis in STH, considering that the number of starts should align with the industry’s customary emphasis on quick returns for invested resources. The most prestigious trotting races in Spain, like the National Grand Prix, focus on 3-year-old horses, favouring precocious competitors which can not only start competing, but also win, at an early age, as in other trotter populations (Jäderkvist Fegraeus et al. Citation2017). Therefore, breeders need further information to select breeding stocks on the basis of breeding values and economic interests, as the key factor to consider is that the breeder’s goal is to earn money: owning a fast horse is merely a tool to achieve this (Thiruvenkadan et al. Citation2009). For this reason, a horse’s precocity and performance over its sporting years, particularly in racing horses, are crucial considerations for breeders when developing their strategies.
Precocity, as a performance trait in trotters, was initially defined by Minkema (Citation1975) in the Netherlands, who quantified it as the money earned in the first years compared with the total earnings throughout the horse’s entire trotting career. This trait is also a prioritised goal in German Trotters (Katona and Distl Citation1989). Studies indicate that horses starting their careers early tend to outperform others and have extended racing longevity (Saastamoinen and Ojala Citation1994; Saastamoinen and Nylander Citation1996).
The aim of this study was to investigate the usefulness of five different criteria related with the genetic evaluation of precocity in the STH population (age at the first ranked race, age of the animal when it reaches 50% of ranked races in the reference period, age of the animal when it reaches the first 10 ranked races, total number of races in which the animal competes before the first ranked race, and percentage of first placings in the races by year of participation) to evaluate their possible inclusion in the official ge-netic program, with the final aim of facilitating genetic management for the best selection strategy for parents of future competitors in the STH population.
Material and methods
In this study, we used the performance data of the Spanish Trot Federation for harness races spanning from 1990 to 2022 (FECT Citation2022). The dataset included race times, earnings (adjusted for inflation), and rank positions for each participating horse, and main envi-ronmental factors such as sex, year of birth, country of birth, breeder, owner, trainer, date, hippodrome, race distance, type of start (auto-start or handicap), type of race (harness or mounted), and driver. A total of 475,049 records from 8368 animals (4964 males and 3404 females) were included, with an average participation rate per horse of 56.8.
To evaluate the heritability of the precocity criteria, we included only harness races for national animals (registered at birth in the Stud-book of STH) in the first 60 months of their life, which was reference period for this analysis. Geldings, animals starting their sport career after 42 months of life, and animals with no registered participation during 12 consecutive months were excluded. The final dataset included 176,137 records, from 4947 different animals, with an average of 35.60 records/animal. These animals descended from 1851 sires (average progeny by sire 2.67) and 4478 dams (average progeny by dam 1.10). The pedigree file was generated from the official genealogical information taken from the STH Studbook managed by ASTROT (ASTROT Citation2022), inclu-ding all the ancestors of the animals on record until the fourth generation, producing a final total of 15,938 animals.
The genetic models to estimate the genetic para-meters of the precocity traits were designed taking into account the results of a general linear model, which included all the proposed effects, with only significant effects being considered (results not shown). To evaluate the criteria of precocity, a multivariate BLUP animal model was used to test the following five traits:
Age at the first ranked race (for animals placed between 1st to 3rd place in the ranking) measured in months (AFR).
Age of the animal when it reaches 50% of the ranked races in the reference period (A50%).
Age of the animal when it reaches the first 10 ranked races (A10).
Total number of races in which the animal has competed before the first ranked race (NRC).
Percentage of first placings (1st to 3rd) in the races by year of participation (PFP).
A genetic analysis was performed, with a Bayesian approach via Gibbs sampling using the GIBBSF90+ module of the BLUPF90 family software (Misztal et al. Citation2016). The Gibbs sampler was run for 250,000 rounds, with the first 50,000 considered as burn-in and then every sample was saved for later analysis. Posterior means and standard deviations were calculated with POSTGIBBSF90 software (Misztal et al. Citation2020) to obtain estimates of variance components and expected breeding values (EBV). Convergence was tested using Geweke’s Z-score (Sorensen and Gianola Citation2002) and the Monte Carlo sampling error was computed using time-series procedures, as described by Geyer (Citation1992). The Monte Carlo standard errors were close to zero, ranging between 0.0006 (A50%) and 0.008 (PFP) which indicates convergence. Lack of convergence was not detected by the Geweke test, ranging between −1.231 (PFP) and 0.6020 (NCR), since all values were between −2 and 2. The models in matrix notation were:
where y is the vector of observations, µ is the overall mean, tr is a covariate representing time in the race in seconds, nrr1 is a covariate representing the number of registered races, nrr2 is a covariate representing the number of ranked races, tfrr is a covariate represen-ting the time needed for the first ranked race, age is a covariate representing the age at the first race in days, b is the vector of the systematic effects, u is the vector of the additive genetic effects, Xi and Zi are incidence vectors for systematic, additive genetic effects, respectively, and e is the vector of residuals. Genetic effects u was assumed to be Gaussian. The different effects included in the models are described in Table . A multivariate model was also used to estimate the genetic correlations between the traits analysed, with a Bayesian approach, using a single chain of 250,000 iterations with a burn-in of 50,000 and then each sample were saved to obtain the posterior mean and posterior standard deviation of estimates in GIBBSF90+ and POSTGIBBSF90 programs (Misztal et al. Citation2020). For each trait, we used the same model as with the univariate models (described before).
Table 1. Description of the genetic models used for the genetic evaluation of the five precocity criteria analysed in Spanish Trotter Horses.
Finally, PFP was also evaluated using a Random Regression Model (RRM) methodology, in which the (co)variance components throughout the trajectory of the animal’s age measured in years were estimated. We used a univariate animal model with second Legendre Polynomials following the genetic model described in Table . The basic idea underlying all RRM consists of modelling the additive genetic values (or other random effects in the model) as a function of an observed dependent variable (i.e. age) through a set of random coefficients. The second-order Legendre polynomial model can be described as:
where y is the vector with n observations of PFP and b is the vector of fixed effects.
are k coefficients of fixed regression of the PFP trajectory in over-age horses with second order orthogonal Legendre polynomials. Four age ranges were considered (2 to 5 years old). The terms
and
refer to sets of random regression coefficients of second-order associated with the animal’s additive genetic function and the permanent environmental function, respectively, and e is the residual. X, Z and W are incidence matrices rela-ting observations with the new parameters in β, α and μ, respectively. In this RRM model, the expected (co)variance components were assumed to be:
in which G is an additive genetic (co) variance matrix among all the animals, P and R are respective (co)variance matrices among permanent environments and residuals, A is the relationship matrix between all the animals in the pedigree, Ip and In are identity matrices of the respective order number of animals with their own record (p) and number of records (n), and
is the Kronecker product.
Gibbs sampling, computed using GIBBSF90+ software (Misztal et al. Citation2020), was used to obtain marginal posterior distributions for PFP parameters, using a single chain of 250,000 iterates with a burn-in of 50,000 and then each sample were saved for later analysis. The samples saved were used to obtain the posterior mean and posterior standard deviation of estimates, using the POSTGIBBSF90 program (Misztal et al. Citation2020). (Co)variance components, heritability parameters (h2), the fraction of phenotypic variance (c2), permanent environmental (rpe), additive genetic correlations (rg), and estimated breeding values (EBV) throughout the different ages were estimated using the procedure described by Jamrozik and Schaeffer (Citation1997).
For each animal, we calculated the product between the solution for each Legendre polynomial and the Legendre polynomial value for the co-rresponding age, as well as the corresponding estimated breeding value, which was the aggregate value for each age.
Finally, we calculated the phenotypic correlations between the EBV obtained from the multivariate BLUP animal model of the five traits and the EBV obtained for each of the age groups with RRM.
Results
The descriptive statistics for the precocity traits analysed in the STH population are presented in Table . As can be seen, on average, animals achieve their first ranked race at 33.05 months, with 40.99 months being the average age when the animals reach 50% of their ranked races in the reference period (60 months). Additionally, the animals reach their first 10 ranked races at an average of 42.31 months, and participate in an average of 3.34 races before their first ranked race. In addition, it takes 37.80% of the races they compete in yearly at this early stage of their sportive career for them to rank between 1st to 3rd position.
Table 2. Descriptive statistics for the five precocity traits analysed in the Spanish Trotter horse population.
Dispersion of data distribution was measured using the coefficient of variation (CV), which shows the lo-west value for A50% (17.69%) and the highest for NRC (105.99%). Traits related with the animal’s age (AFR, A50% and A10) exhibited very close CV values, from 17.69% to 20.76%.
The genetic parameters for precocity traits analysed with a multivariate BLUP animal model in the STH population are shown in Table . Heritability values were of medium-low level, varying from 0.08 (0.021) for trait NRC to 0.44 (0.033) for trait A10. The highest genetic correlation was obtained between A50% and A10 (0.96; s.d.= 0.011), whereas the lowest values (≤0.06) were obtained between AFR and NRC and A10 and NRC, with 50% of them negative. There is no evidence of a relationship between AFR-NCR and A10-NCR (p ≠ 0 is 0.60 and 0.72, respectively).
Table 3. Genetic parameters (heritability in the diagonal and genetic correlations (rg) above the diagonal) for the five precocity traits analysed with a bayesian multivariate animal model in the Spanish Trotter horse population.
The percentage of first placings (1st to 3rd) in the races by year of participation (PFP) was also analysed as a function of the animal’s age using an RRM. The genetic parameters (heritability and variance components) are shown in Table .
Table 4. Estimates of repeatability (t), heritability values (in the diagonal), additive genetic (above the diagonal) and permanent environmental (below the diagonal) correlations between the different age groups analysed for the trait percentage of first placings (1st to 3rd) in races, by year of participation (PFP) as a function of the animal’s age, using a Random Regression Model.
The average heritability value was 0.22, varying from 0.17 (for 4-year-old animals) and 0.26 (for 2-year-old animals), while the repeatability parameter showed a high value (between 0.41 and 0.64), which implies that the animal’s potential for this trait can be achieved with a very low number of controls. The highest genetic correlations were, as expected, obtained between the nearest age groups (0.89 between 2–3 years; 0.87 between 3–4 years and 0.74 between 4–5 years), while the lowest values were obtained between the furthest age groups (0.24 between 2–5 years). In addition, the permanent envi-ronmental correlations were not constant over age groups, oscillating from 0.19 (2 to 4-year-olds) to 0.83 (3 to 4-year-olds). The highest estimates of additive and permanent environmental variances for PFP were obtained for the 2-year-old group (168.02 and 245.98, respectively), while the lowest additive variance was obtained for the 4-year-old group (69.38) and the lo-west permanent environmental variance was found for 3-year-olds (94.27), which was similar to that obtained for the 4-year-old group (94.86) (results not shown).
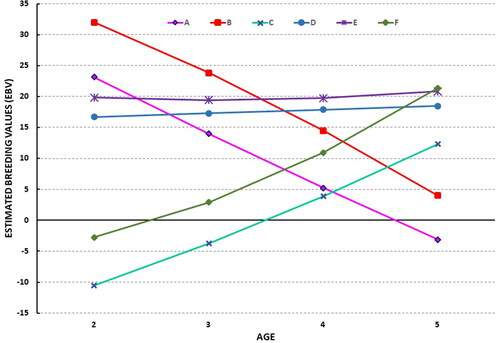
Figure shows a graphic representation of the evolution of EBV throughout the different age groups analysed for PFP, including 6 representative STH animals. Three different types of animals can be observed: animals A, B, C and F are plastic animals whose EBVs vary through the different age-groups, either increasing (3 and 6) or decreasing (1 and 2), whereas animals D and E are stable, with an EBV that does not change over the trajectory of the age groups.
Figure 1. Graphic representation of evolution of the estimated breeding values (EBV) throughout the age groups for the trait percentage of first placings (1st to 3rd) in races, by year of participation (PFP) for 6 representative Spanish Trotter Horses.
Finally, Table shows the correlations between the EBV obtained from the multivariate BLUP animal model of the precocity criteria analysed, and the EBV obtained for each age group for the PFP trait using RRM methodology. The values obtained were of low-medium range, ranking between 0.04 (A50% – age group 5) and 0.71 (PFP – age group 3), in absolute values. NRC had the highest values (from −0.58 to −0.71, with an average of −0.66), all of which were negative, while A50% presented the lowest values (from 0.04 to −0.21, with an average of −0.12), with positive values obtained for only 25% of the estimations (A50%-group 5 and PFP in all age groups).
Table 5. Correlations between the estimated breeding values obtained from the multivariate BLUP animal model of the five traits and the estimated breeding values obtained for each of the age groups with the trait of the percentage of first placings (1st to 3rd) in races, by year of participation, using a Random Regression Model.
Discussion
Due to the unequal distribution of race prizes in Spain, breeders are more interested in races with young horses than those with adults and aim to find precocious animals in their stables. Here, precocity selection criteria, which can be measured early in life, can help them to make an early selection of animals for sport uses, thus saving money and time. Also, animals with a long sporting life are of particular interest to their owners, because they have more time to recover their investment by winning prizes.
According to Mota and Oliveira (Citation2000), a low star-ting age and the ability to perform well at an early age are desirable characteristics in racehorses, because they improve the profitability of horse breeding and maintenance, which is a key factor in the racehorse sector. Therefore, in the present study, we used ran-king information obtained in the official trotter races held in Spain to estimate five different traits consi-dered as indirect measures of precocity in the STH, which can facilitate genetic management of the best selection strategy of parents for the future competitors in the STH population. Such a tendency to precocity is very often used as a tool for gaining rapid profitability and is of enormous economic importance in trotter races held in Spain due to the large amounts of money given out as prizes at races involving young horses.
Ranking in competitions has been traditionally used in the genetic evaluation of race horses all around the world (Swedish trotter, Arnason et al. Citation1982; French trotter, Langlois Citation1982; Finnhorse and Standardbred trotter, Ojala Citation1987 and Pösö and Ojala Citation1997; German trotter, Röhe et al. Citation2001 and Bugislaus et al. Citation2004; Spanish trotter, Gómez et al. Citation2010a). It is an index which allows us to compare the performance of one horse with another in the same competition, and therefore permits a direct comparison between diffe-rent animals in a race. This is the main reason why ranking results were used to describe the precocity criteria used in this analysis. According to Thiruvenkadan et al. (Citation2009), ranking traits, such as the percentage of first placings, reflect a horse’s temperament, its spirit and willingness to win. Bokor et al. (Citation2005) stated that ranking traits are comparable between countries, and according to Ojala (Citation1989), the percentage of first to third placings reflects a horse’s level relative to that of its mates in the same race (Ojala Citation1989).
The dispersion of the data distribution shows the existence of sufficient variance in the dataset analysed to use these traits in genetic evaluation in the official breeding program of STH. Besides, based on mean va-lues derived from the traits analysed (Table ), we can affirm that the STH population requires an average of 3.34 participations to achieve a ranked outcome in official competitions. This accomplishment marks the attainment of the first economic prize in their sporting trajectory, ensuring a prompt return on the financial resources invested by breeders and owners. The number of participations ranged from 1 to 42, indicating considerable variability and thereby establishing an adequate base for potential genetic selection of the animals by this trait.
In Spain, animals as young as 2 years old are permitted to participate in official races. Generally characterised by their precocity, the STH breed initiates its economic performance and profitability at an average age of 2.75 years (33.05 months), with the most important races in Spain (those with the biggest prize money) being organised for 3-year-old horses, as exemplified by prestigious events such as the National Grand Prix at the Son Pardo Hippodrome. Our findings further reveal that STH animals achieved rankings in 37.8% of the races in which they participated. This underscores the positive outcomes reflected in an average trait value (A50%) of 41 months of age, signifying the point at which 50% of races were successfully ranked during the reference period.
The age when trotter horses first start racing was analysed by Saastamoinen and Nylander (Citation1996), who stated that the ability to begin their career early and perform well at an early age is a desirable feature in these horses. Saastamoinen (Citation1991a, Citation1991b) observed that trotters broken in at 1 or 1.5 years of age and reaching their first ranking by 3 years of age were significantly faster (by 2.1s), and had a larger number of starts and higher earnings by 5 years of age than those broken in at the age of 2 or 3. Also, Burns et al. (Citation2006) affirmed that the age when they start their ca-reer has a significant impact on career longevity, while a lack of ability contributed to the loss of animals, because a significant proportion of horses may be retired due to injury or disease associated with trai-ning and racing. We selected the age at first ranked race (AFR) as a selection criterion in this analysis, because of the importance of obtaining good results early, rather than just a precocious starting age.
The average number of races registered for a horse within the first 60 months of its life was 35.6, with 15 the average number of ranked races by a horse within this period. This gives the traits A50% and A10 very close average values (41.0 and 42.3 months, respec-tively) and CV (17.69% and 18.96%, respectively). However, although there is high genetic correlation between them (0.96; Table ), both traits can be considered as selection criteria in the genetic analysis for precocity, because possible changes in phenotypic averages over time could change the genetic estimations.
Higher heritability values signify a favourable response to selection, whereas traits exhibiting lower values would require greater selection efforts to attain a positive response within a population. Here, the highest heritability was obtained for A10 (0.44), while the lowest was obtained for NRC (0.08; Table ). This lower value shows the important influence of environmental effects on the number of races in which the animal competes before its first ranked race, and it is a trait which is mainly influenced by the decisions made by owners and trainers. A heritability value of 0.30 was obtained for AFR. This trait showed a wide range of variation in the bibliography for similar traits, varying by breed and author, from 0.02 in Finnhorses (Saastamoinen and Ojala Citation1991) to 0.86 in Swedish tro-tters (Braam et al. Citation2011). Another analysis reported intermediate values in Finnhorses (0.06, Saastamoinen and Nylander Citation1996) and Standardbred trotters (0.14, Saastamoinen and Ojala Citation1991; Saastamoinen and Nylander Citation1996).
As stated by Saastamoinen and Nylander (Citation1996) in Standardbred and Finn-horse trotters, based on the heritability analysis of their age at first qualifying start (0.07 and 0.05, respectively), passed qualifying start (0.15 and 0.04, respectively) and first race (0.14 and 0.05, respectively), the age when they began their sport career was mainly conditioned by environmental factors, such as decisions of owners and trainers or injuries. However, the results obtained also show the existence of genetic differences in precocity, soundness and ability to respond to training in the different trotter populations.
The PFP shows a heritability of 0.32 in the STH, which is higher than the values obtained in most of the studies we reviewed (0.14 in STH, Gómez et al. Citation2010a; 0.18 in Finnish horses, Ojala and van Vleck Citation1981; 0.19 in North-Swedish and Standardbred tro-tters, Rönninger Citation1975 and Ojala Citation1987, respectively; 0.22 in Finnish horses Pösö and Ojala Citation1997; 0.25 in Nordic and Icelandic trotters, Arnason Citation2008; and 0.26 in Swedish trotters, Arnason et al. Citation1982) and the same value as the percentage of first to third placings in the Sweden Standardbred (Arnason et al. Citation1989).
Based on heritability results, precocity traits present variable expected responses to selection, with A50% (0.42) and A10 (0.43) emerging as particularly high va-lues. However, these traits need more time to be measured in the animals, a factor which holds up the selection process. The PFP can be measured at an earlier stage than other proposed traits, and has shown a creditable heritability value of 0.32. However, it is crucial to acknowledge that the response to selection, as far as a specific trait is concerned, extends beyond its direct impact. It may also lead to a correlated response in the other traits analysed, influenced by shared genetic correlations and the precision of ge-netic evaluations for each trait. In our analysis, high genetic correlations were obtained between the traits we analysed (Table ), ranging between −0.78 (A10-PFP) and 0.96 (A50%-A10). The highest values were obtained between the criteria related with age (AFR, A50% and A10), ranging between 0.90 and 0.96, and we can therefore affirm that animals which reach their first ranked race at an early age also reach 50% of ranked races and the first 10 ranked races in their sporting life when young. Furthermore, the lowest co-rrelation values were obtained for NRC with the other criteria proposed for precocity (AFR, 0.03; A10, 0.06 and A50%, −0.12), except PFP, which had a medium range of correlation (-0.59). These correlations can be caused by the greater influence of environmental factors on NRC, as evidenced by its low heritability (0.08). The PFP showed the highest genetic correlations, most of which were negative, ranging between −0.59 (NRC) and −0.78 (A10). It is also important to take into account the sign of the correlations when the traits are included in the selection program of this population. In this way, selection based on PFP also improves the results obtained for NRC, with decreased values. Besides, according to the results obtained, animals with the highest percentage of first placings in the races by year of participation (PFP) need less time to achieve the proposed performance results (lower AFR, A50% and A10) and reach their first ranked race earlier in their sport career (lower NRC). As a result, it is not necessary to include both precocity traits in the selection program, and selection by PFP can be effective.
An animal’s sport performance can change during its life, not only because of environmental factors such as acquired experience or the animal’s maturity, but also because their genetic potential can evolve. These changes have been documented by several authors in different horse breeds (German Trotters, Bugislaus et al. Citation2006; Brazilian Thoroughbred, Buxadera and Mota Citation2008; Spanish Trotter Horses, Gómez et al. Citation2010b, Citation2011; Hungarian Sporthorses, Posta et al. Citation2010; Spanish Sport Horses, Bartolomé et al. Citation2013; Arabian Horses, Önder et al. Citation2022). Therefore, the application of RRM allows us to differentiate animals with a good genetic performance in the first years of life, but whose genetic potential decreases with their physiological maturity, from those animals whose potential increases with age, or other robust animals without changes in their genetic performance throughout their lives. For example, Langlois (Citation1982) observed an increase in racing speed with increased age and heri-tability values in French trotters. These changes in the performance of individual animals with age could be influenced by genetic factors (Atchley Citation1998). In fact, there may be different genes affecting the trait depending on the animal’s age which activate or deactivate their action, thus changing the physiology and, as a result, the performance of trotters (Gómez et al. Citation2010b, Citation2011). In this context, to assess the evolution of an animal’s performance over its lifespan, an RRM was used as the most suitable tool for modelling traits that undergo continuous, gradual changes in time and are measured repeatedly for each individual. The RRM has proved effective in estimating genetic potential and describes the genetic variability over various external factors, such as race distance (Gómez et al. Citation2010b) or the animal’s age (Gómez et al. Citation2011) in the case of the STH.
Table shows the genetic parameters obtained for the PFP as a function of the animal’s age. The heri-tability values show a gradual decrease up to the age of 4, from 0.26 to 0.17. However, a subtle upturn is noted from the age of 5, reaching 0.22. These values are slightly lower than those obtained with the Bayesian animal model (0.30) applied before, but also are within the range of those reported in the biblio-graphy reviewed. The average heritability value for PFP ranged between 0.14 in STH (Gómez et al. Citation2010a) and 0.25 in Swedish Trotter Horses (Arnason et al. Citation1982), with intermediate values in Finnish Horses (0.18, Ojala and van Vleck Citation1981) and in Standardbred and Finnhorse trotters (0.19 and 0.22, respectively, accor-ding to Pöso and Ojala Citation1997). Besides, the evolution of heritability values for PFP over different ages has been analysed by other authors. Arnason et al. (Citation1989) and Ojala (Citation1987) obtained the highest values at early stages and a decrease in heritability values with age in Sweden Standardbred (0.32-0.24), Finnish horses (0.23-0.21) and Standardbred trotters (0.22-0.16).
The results obtained for the genetic and permanent environmental correlations between the different age groups were in the medium-high range, being higher between the nearest age groups and lower between the furthest ones, as expected. The genetic correlations observed in PFP at various ages therefore need to be considered from a different perspective to selection. Notably, the permanent environmental correlations show variability across age groups. These differences suggest that environmental and non-additive genetic effects (dominance and epistatic effects) do not remain constant as the participating horse’s age increases. As noted by Hohenboken (Citation1985), certain environmental effects impacting repeated measures of the trait in the same animal appear to be of a semi-permanent, rather than permanent, nature.
The existence of genetic differences in an animal over age, or other environmental effects, indicates the existence of an underlying genotype by environmental interaction which in evolutionary genetics is called plasticity (Jong and Bijma, Citation2002). In this sense, plastic animals are those whose sport performance/genetic potential can change with the environmental conditions (for example, over age) and robust animals are those which maintain the same sport performance/genetic potential regardless of the environmental conditions in which they participate.
Figure shows a graphic representation of the evolution of EBV throughout the different age groups analysed for PFP in 6 representative STH. Three diffe-rent types of animals can be observed: animals A, B, C and F are plastic animals whose EBVs vary through the different age groups, increasing (F and C) or decreasing (A and B) with age, whereas D and E are robust animals, whose EBV do not change significantly over the whole trajectory of ages analysed. This is of great interest for the selection of animals using precocity criteria, because the evidence for variations in EBV over the trajectory of age groups shows that ranking traits cannot be considered as the same character in all age groups, as stated by Buxadera and Mota (Citation2008). Therefore, in comparison with the classical repeatability model, the RRM provides a larger amount of informative data for the selection process, which allows for a higher level of discrimination between animals that could be selected as breeding stock for the next generation, according to the interests of each breeder. However, as regards the use of the PFP trait as a precocity criterion, this methodology requires a longer time period of productive control, which means postponing the selection decision until the animal is at least 6 years old. Nevertheless, this is not a problem currently in the STH population because the majority of the stallions are 7 years old or older when their first offspring is registered in the official Studbook. Therefore, a total of 5 years of sport information (2–6 years old) is always available for their breeding evaluation.
Finally, the correlations between the EBV obtained with both methodologies (Table ), showed that for age traits (AFR, A50% and A10), correlations decrease as the age increases. This could be caused by the high percentage of animals which reach a high PFP at early ages, which also helps them reach their objectives in sport (A50% and A10) early in life. For NCR, the results show that animals with higher PFP values at 2, 3 and 4 years of age need fewer participations to reach their first ranked race. Similarly, correlations for PFP comparing both methodologies show that a high global EBV for PFP is closely related with a high EBV at 2, 3 and 4 years old, although the correlation is lower with the 5-year-old group.
Conclusions
The genetic parameters obtained show the potential for enhancing precocity through a well-designed selection program rooted in genetic evaluation, with the exception of NRC due to its constrained heritabi-lity value and its low, negative genetic correlations with other traits. However, by increasing the number of traits to be included in the selection process, there is a risk of obtaining a lower response to selection, and it is therefore advisable to incorporate PFP into the genetic breeding program for STH, because it allows the early selection of STH animals by their early performance (since they start their sport career at 2 years old) and shows adequate correlations with the other precocity traits. This recommendation aims to provide breeders with more objective insights for selecting breeding stock and devising mating stra-tegies based on precocity.
While the application of an RRM to assess genetic variations in animals across a wide range of ages considering the plasticity or robustness of their sport performance may be of considerable interest, it also introduces a delay in the selection process. Nevertheless, complementing genetic selection by ensuring the inclusion of robust individuals remains crucial for breeders, thereby guaranteeing an adequate lifespan. So, the use of RRM is highly recommended because the majority of breeding stocks do not start their reproductive career early, as they are used for sport.
The genetic correlations we have obtained indicate the potential for inducing genetic changes in a precocity trait through direct selection on another trait. However, in order to establish suitable breeding goals, it is vital to systematically consider and analyse the relationship of these traits not only with the perfor-mance traits analysed in this population, but also with longevity traits, which are of great interest to owners.
Ethical Approval
Data used in the manuscript are obtained from the official competitions of trotters horses held in Spain. No experimental animals are used for data obtaining.
Acknowledgements
Authors wish to thank the Asociación de Criadores y Propietarios de Caballos de Trote and the Federación Nacional de Trote for providing the data used in this study.
Disclosure statement
No potential conflict of interest was reported by the author(s).
Data availability statement
Data subject to third party restrictions
References
- Árnason T. 1999. Genetic evaluation of Swedish standard-bred trotters for racing performance traits and racing status. J Animal Breeding Genetics. 116(5):387–398. doi: 10.1046/j.1439-0388.1999.00202.x.
- Árnason T, Darenius A, Philipsson J. 1982. Genetic selection indices for Swedish Trotter Horses. Livest Prod Sci. 8(6):557–565. doi: 10.1016/0301-6226(82)90033-1.
- Arnason TA, Bendroth M, Philipsson J, Hendriksson K, Darenius A. 1989. Genetic evaluation of Swedish trotters. In: Langlois B. editor. State of Breeding evaluation in trotters. EAAP publications n 42. Wageningen: Wageningen Pers; p. 106–130.
- Arnason TA. 2008. Experience from genetic evaluations of Nordic Trotters and Icelandic horses across countries. Interstallion seminar. May 29-30. Upssala. Sweden. [accessed 2008 Sept 2] http://www.biw.kuleuven.be/genlog/livgen/workshop/S_ThrovaldurA.pdf.
- ASTROT. 2022. Spanish Trotter Horse Studbook consulting [accessed 2022 Dec 31]. https://www.astrot.com/buscarLibro.php.
- Atchley WR. 1998. Developmental quantitative genetics: age-specific response to selection. In: Proceedings of the 6th World Congress on Genetics Applied to Livestock Production; Jan 11–16; Armidale, Australia. p. 505–512.
- Bartolomé E, Menéndez-Buxadera A, Valera M, Cervantes I, Molina A. 2013. Genetic (co)variance components across age for show jumping performance as an estimation of phenotypic plasticity ability in Spanish horses. J Anim Breed Genet. 130(3):190–198. doi: 10.1111/jbg.12001.
- Blouin C, Langlois B. 2007. Annual, career or single race records for breeding value estimation in race horses. Livest Sci. 107(2–3):132–141. doi: 10.1016/j.livsci.2006.09.017.
- Bokor A, Blouin C, Langlois B, Stefler J. 2005. Genetic parameters of racing merit of Thoroughbred horses in steeplechase races. Ital J Anim Sci. 4(sup3):43–45. doi: 10.4081/ijas.2005.3s.43.
- Braam A, Näsholm A, Roepstorff L, Philipsson J. 2011. Genetic variation in durability of Swedish Warmblood horses using competition results. Livest Sci. 142(1-3):181–187. doi: 10.1016/j.livsci.2011.07.011.
- Bugislaus AE, Roehe R, Uphaus H, Kalm E. 2004. Development of genetic models for estimation of racing performance in German Thoroughbreds. Arch Anim Breed. 47(6):505–516. doi: 10.5194/aab-47-505-2004.
- Bugislaus AE, Roehe R, Kalm E. 2005. Comparison of two different statistical models considering individual races or racetracks for evaluation of German trotters. Livest Prod Sci. 92(1):69–76. doi: 10.1016/j.livprodsci.2004.08.008.
- Bugislaus AE, Roehe R, Willms F, Kalm E. 2006. The use of a random regression model to account for change in racing speed of German trotters with increasing age. J Anim Breed Genet. 123(4):239–246. doi: 10.1111/j.1439-0388.2006.00596.x.
- Burns EM, Enns RM, Garrick DJ. 2006. The effect of simulated censored data on estimates of heritability of longevity in the Thoroughbred racing industry. Genet Molec Res. 5(1):7–15. www.funpecrp.com.br.
- Buxadera AM, Mota MDS. 2008. Variance component estimations for race performance of thoroughbred horses in Brazil by random regression model. Livest Sci. 117(2–3):298–307. doi: 10.1016/j.livsci.2007.12.027.
- Jäderkvist Fegraeus K, Lawrence C, Petäjistö K, Johansson MK, Wiklund M, Olsson C, Andersson L, Andersson LS, Røed KH, Ihler C-F, et al. 2017. Lack of significant associations with early career performance suggest no link between the DMRT3 “gait keeper” mutation and precocity in Coldblooded trotters. PLOS One. 12(5):e0177351. doi: 10.1371/journal.pone.0177351.
- FECT. 2022. Trotting race results in Spain [accessed 2022 Dec 31]. https://www.federaciobaleardetrot.com/.
- Geyer CM. 1992. Practical Markov chain Monte Carlo. Stat Sci. 7:467–511.
- Gómez MD, Valera M, Molina A. 2010a. Genetic analysis of racing performance of trotter horses in Spain. Livest Sci. 127(2-–):197–204. doi: 10.1016/j.livsci.2009.09.012.
- Gómez MD, Menendez-Buxadera A, Valera M, Molina A. 2010b. Estimation of genetic parameters for racing speed at different distances in young and adult Spanish Trotter horses using the random regression model. J Anim Breed Genet. 127(5):385–394. doi: 10.1111/j.1439-0388.2010.00865.x.
- Gómez MD, Molina A, Menendez-Buxadera A, Valera M. 2011. Estimation of genetic parameters for the annual earnings at different race distances in young and adult Trotter Horses using a Random Regression Model. Livest Sci. 137(1–3):87–94. doi: 10.1016/j.livsci.2010.10.004.
- Hohenboken WD. 1985. Chapter 7. Maternal effects. In: Chapman AB, editor. General and quantitative genetics. World Anim. Sci. A4. Amsterdam; Elsevier; p. 135–150.
- Jamrozik J, Schaeffer LR. 1997. Estimates of genetic parameters for a test day model with random regressions for yield traits of first lactation Holsteins. J Dairy Sci. 80(4):762–770. doi: 10.3168/jds.S0022-0302(97)75996-4.
- Jong de G, Bijma P. 2002. Selection and phenotypic plasticity in evolutionary biology and animal breeding. Livest Prod Sci. 78(3):195–214. doi: 10.1016/S0301-6226(02)00096-9.
- Katona O, Distl O. 1989. Sire evaluation in German trotter (standardbred) population. In: langlois B. editor. State of Breeding Evaluation in Trotters. Wageningen:Wageningen Pers; p. 55–61.
- Langlois B. 1982. L’heritabilité des performances chez le trotteur. Une revue bibliographique. Genet Sel Evol. 14(3):399–414. doi: 10.1186/1297-9686-14-3-399.
- Langlois B, Blouin C. 2004. Practical efficiency of breeding value estimations based on annual earnings of horses for jumping, trotting, and galloping races in France. Livest Prod Sci. 87(2–3):99–107. doi: 10.1016/j.livprodsci.2003.10.003.
- Langlois B, Vrijenhoek T. 2004. Qualification status and estimation of breeding value in French trotters. Livest Prod Sci. 89(2–3):187–194. doi: 10.1016/j.livprodsci.2004.02.001.
- Minkema D. 1975. Studies on the genetics of trotting performance in Dutch trotters. Ann Genet Sel Anim. 7(1):99–121. doi: 10.1186/1297-9686-7-1-99.
- Misztal I, Tsuruta S, Lourenco D, Masud Y, Aguilar I, Legarra A, Vitezica Z. 2016. Manual for BLUPF90 family of programs. Athens: University of Georgia. [accessed 2020 Sept 2] https://www.coursehero.com/file/177198533/blupf90-all8pdf/.
- Misztal I, Lourenco D, Legarra A. 2020. Current status of genomic evaluation. J Anim Sci. 98(4):skaa101. doi: 10.1093/jas/skaa101.
- Mota MDS, Oliveira HN. 2000. Precocity and performance in Brazilian thoroughbreds. Arch Zootec. 49(188):497–500.
- Ojala M. 1987. Heritabilities of annually summarized race records in Trotters. J Anim Sci. 64(1):117–125. doi: 10.2527/jas1987.641117x.
- Ojala M. 1989. Breeding evaluation of trotters in Finland. In: Langlois B. editor. State of Breeding Evaluation in trotters. Proceedings of the EAAP Symposium of the Commission of Horse Production. Helsinki. Pudoc, Wageningen: EAAP Publication; p. 18–26.
- Ojala M, van Vleck LD. 1981. Measures of racetrack performance with regard to breeding evaluation of trotters. J Anim Sci. 53(3):611–619. doi: 10.2527/jas1981.533611x.
- Önder H, Şen U, Piwczyński D, Kolenda M, Drewka M, Abacı SH, Takma Ç. 2022. Comparison of random regression models with different order Legendre polynomials for genetic parameter estimation on race completion speed of Arabian Horses. Animals. 12(19):2630. doi: 10.3390/ani12192630.
- Pieramati C, Fusaioli L, Scacco L, Buttazzoni L, Silvestrelli M. 2007. On the use of elo rating on harness racing results in the genetic evaluation of trotter. Ital J Anim Sci. 6(sup1):189–191. doi: 10.4081/ijas.2007.1s.189.
- Pieramati C, Giontella A, Sarti FM, Silvestrelli M. 2011. Assessment of limits for racing speed in the Italian trotter population. Ital J Anim Sci. 10:233–236.
- Pösö J, Ojala M. 1997. Estimates of genetic parameters of trotting performance traits for repeated annual records. AFSci. 6(1):11–18. doi: 10.23986/afsci.72775.
- Posta J, Malovhr S, Mihók S, Komlósi I. 2010. Random regression model estimation of genetic parameters for show-jumping results of Hugarian Sporthorses. J Anim Breed Genet. 127(4):280–288. doi: 10.1111/j.1439-0388.2009.00848.x.
- Ricard A, Bruns E, Cunningham EP. 2000. Chapter 15. Genetics and Performance traits. In: bowling AT, Ruvinsky A, editors. The Genetics of the Horses. London (UK): cabi Publishing; p. 411–438.
- Röhe R, Savas T, Brka M, Willms F, Kalm E. 2001. Multiple-trait genetic analyses of racing Performances of German trotters with disentanglement of genetic and driver effects. Arch Anim Breed. 44(6):579–588. doi: 10.5194/aab-44-579-2001.
- Rönninger K. 1975. Genetics and environmental factors for traits in the North-Swedish trotter. Z Tierz Zuchtbiol. 92:164.
- Saastamoinen MT. 1991a. Factors affecting age at onset of breaking, training, qualifying and first start in Finnish Trotters. Acta Agric Scand. 41(2):137–145. doi: 10.1080/00015129109438595.
- Saastamoinen MT. 1991b. Some factors of the time of breaking and training affecting racing performance in young trotters. AFSci. 63(5):483–492. doi: 10.23986/afsci.72413.
- Saastamoinen MT, Ojala MJ. 1991. Estimates of genetic and phenotypic parameters for racing performance in young trotters. Acta Agric Scand. 41(4):427–436. doi: 10.1080/00015129109439925.
- Saastamoinen MT, Ojala MJ. 1994. Influence of different combinations of racing years on early career performance in trotters. Acta Agric Scand. Section A. Anim Sci. 44(4):208–213. doi: 10.1080/09064709409410900.
- Saastamoinen MT, Nylander A. 1996. Genetic and phenotypic parameters for age at starting to race and racing performance during early career in trotters. Livest Prod Sci. 45(1):63–68. doi: 10.1016/0301-6226(95)00080-1.
- Solé M, Valera M, Gómez MD, Sölkner J, Molina A, Mészáros G. 2017. Heritability and factors associated with number of harness race starts in the Spanish Trotter horse population. Equine Vet J. 49(3):288–293. doi: 10.1111/evj.12632.
- Sorensen D, Gianola D. 2002. Likelihood, Bayesian, and MCMC Methods in Quantitative Genetics. New York (NY):Springer Science and Business Media, :Springer-Verlag.
- Thiruvenkadan AK, Kandasamy N, Panneerselvam S. 2009. Inheritance of racing performance of Thoroughbred horses. Livest Sci. 121(2–3):308–326. doi: 10.1016/j.livsci.2008.07.009.