
 ?Mathematical formulae have been encoded as MathML and are displayed in this HTML version using MathJax in order to improve their display. Uncheck the box to turn MathJax off. This feature requires Javascript. Click on a formula to zoom.
Abstract
There is a paucity of information about milk composition and quality at the quarter level from complete milking of the udder, mainly because of the difficulties of sampling procedures which imply the adoption of a vacuum system connected to four independent buckets. The objective of this study was to evaluate the effect of quarter position, intramammary infection status, and somatic cells on milk yield and composition at the mammary quarter level of Simmental cows. Milk samples were collected during three consecutive days, after milking individual mammary quarters of 10 lactating cows separately, for a total of 120 quarter milk samples. Samples were analysed for composition, somatic cell count (SCC), differential SCC, and bacterial culture. Somatic cell count was log-transformed to somatic cell score (SCS) to achieve normality of distribution. Sources of variation of milk yield and quality traits were investigated using a linear mixed model which included the fixed effects of quarter position (1 to 4), pathogen presence (positive or negative), and SCS class (low, medium-low, medium-high, and high). The interaction between cow and quarter position was included as random effect. Quarter position significantly affected milk yield, with rear udder quarters yielding more milk compared to their front counterparts, but with negligible effects on milk composition. Classes of SCS influenced milk composition, in a way that quarters with high SCS had lower lactose content and higher differential SCC. This study is a contribution towards the possibility to better understand physiological processes at cow udder quarter level.
HIGHLIGHTS
The effect of quarter position significantly affected milk yield at the quarter level.
Rear quarters produced more milk compared to their front counterparts.
Somatic cells significantly affected the investigated traits, except for milk yield and protein content.
Keywords:
Introduction
Bovine milk composition traits, including fat, protein, casein, lactose, and urea content have been widely investigated at herd and individual level. Broadly speaking, some sources of variation of these features include: i) herd management, especially feeding strategies (Elgersma et al. Citation2006; Jenkins and McGuire Citation2006), ii) climatic conditions and seasonality (Bouraoui et al. Citation2002; Bertocchi et al. Citation2014), iii) intramammary infection status (Bobbo et al. Citation2017), iv) somatic cell count (SCC) (Ikonen et al. Citation2004; Hand et al. Citation2012), v) animal health, in particular the occurrence of clinical and subclinical mastitis (Ogola et al. Citation2007) and hyperketonemia (Benedet et al. Citation2019), and vi) lactation stage and parity of the cow (Roveglia et al. Citation2019). Moreover, breed and individual genetic merit have been closely associated to the phenotypic variation of milk quality and solids yield in dairy cattle (Viale et al. Citation2017; Costa et al. Citation2019).
Little information on milk composition is available at the mammary quarter level, mainly due to difficulties in sampling procedures. Most of the studies conducted at quarter level dealt with pathogen detection based on sterile sampling or milk quality traits based on the analysis of milk fractions collected at different time points during a single milking event (Bansal et al. Citation2005; Sarikaya et al. Citation2005; Piccinini et al. Citation2007; Bisutti et al. Citation2023). Even less information is available on individual quarter milk obtained from complete milking. Investigating milk composition at udder quarter level allows for a deeper understanding of the physiological processes involved in milk synthesis (i.e. differences in milk yield (MY) and composition across udder quarters) and animal health (i.e. differences in somatic cell and intramammary infection across udder quarters). Indeed, the same aspects cannot be studied in such resolution when considering individual and bulk milk (Bobbo et al. Citation2022). Forsbäck et al. (Citation2010) studied day-to-day variation of MY and composition at the quarter level in clinically healthy cows and concluded that, within udder quarter, the day-to-day variation of these traits follows the same trend, and repeated milk sampling and analysis at the quarter level can be used to detect alterations in milk composition and cow health.
The aim of the present study was to assess the effect of position of the quarter, the intramammary infection status, and the level of SCC on MY and composition in samples from complete udder quarter milking.
Materials and methods
Farm management and animals
The study was carried out during routine milking procedures at the experimental farm of the University of Padova (Legnaro, Italy). Procedures were not invasive and thus animal care and use committee approval was not required for the present study. The experimental farm accounted for 26 lactating Simmental (SI) cows which were housed indoors in free-stall barn and fed total mixed ration based on mixed hay (0.50 kg/cow/day), alfalfa hay (4.10 kg/cow/day), corn meal (1.30 kg/cow/day), protein mix (3.40 kg/cow/day), concentrate feed (3.20 kg/cow/day), vitamin and mineral mix integrator (0.50 kg/cow/day), yeast integrator (0.05 kg/cow/day) and corn silage (28.00 kg/cow/day). The average chemical composition on dry matter basis was as follows: 22.33% starch, 16.31% crude protein, 3.78% ether extract, 8.52% total ash, 34.65% neutral detergent fibre, 21.48% acid detergent fibre, 13.18% hemicellulose, and 3.46% acid detergent lignin.
Milking took place two times per day (6:00 am and 6:00 pm). Prior to the beginning of the study, individual milk samples from the entire herd were collected for SCC analysis in the laboratory of the Breeders Association of Veneto Region (ARAV, Vicenza, Italy) using FossomaticTM 7 DC (Foss Analytical A/S, Hillerød, Denmark). Ten cows were selected among the 26 available at the experimental farm, avoiding cows under antibiotic treatment for any disease. Moreover, selection criteria aimed to reach homogenous distribution of days in milk (DIM; average: 192.50 d; minimum: 76 d; maximum: 359 d) and parity (average: 3.6; minimum: 2; maximum: 6). Finally, cows were selected to guarantee a wide range of SCC (average: 80,000 cells/mL; minimum: 7000 cells/mL; maximum: 193,000 cells/mL measured on individual milk). Additional information about animal enrolment can be retrieved from Bobbo et al. (Citation2022).
Milk samples collection
Milk samples were collected during three consecutive morning milkings from individual quarters of 10 cows, totalling 120 milk samples. A first milk aliquot (10 mL) was obtained in sterile conditions from each quarter after accurate cleaning of the teat end with disinfectant disposable towels and discarding the first milk jets. Sterile quarter samples were collected according to National Mastitis Council guidelines (NMC, Citation1999) and used for subsequent bacterial culture analyses. After sterile sampling, udder quarters were milked using a vacuum system connected to four different plastic buckets as described in Bobbo et al. (Citation2022), and milk of each bucket was weighted to obtain MY at quarter level. The second milk aliquot (50 mL) was collected directly from each bucket, added with 200 µL of preservative (Bronopol, 2-bromo-2-nitropropan-1,3-diol; D&F Inc., Dublin, CA, USA) to avoid bacterial proliferation and used for subsequent milk composition analyses.
Bacterial culture and gross composition analyses
Bacterial culture analyses were performed in the laboratory of the Istituto Zooprofilattico Sperimentale delle Venezie (IZSVE, Legnaro, Italy) within 24 h from collection. Briefly, 10 µL of milk were plated onto blood agar containing 5% defibrinated sheep blood. Plates were aerobically incubated at 37 ± 1 °C and examined after 16 and 24 h. Bacteria were cultured and identified according to NMC (Citation1999), which includes morphology, Gram staining, catalase and coagulase reactions, oxidase reaction, biochemical properties, and haemolysis pattern. Gram-positive microorganisms were differentiated as staphylococci and streptococci by the catalase reaction. The coagulase tube test in rabbit plasma was used to differentiate Staphylococcus aureus from Non-aureus staphylococci (NAS). Gram-negative bacteria were identified by oxidase test as well as by growth features on MacConkey agar and eosin methylene blue agar. A sample was considered contaminated when three or more dissimilar colony types were observed with no single colony type predominating (NMC, Citation1999).
Milk gross composition was determined in the ARAV laboratory within 12 h from collection. Samples were warmed in a water bath at 36 °C, gently inverted five times to promote solids homogenisation, and analysed for fat (%), protein (%), casein (%), lactose (%), urea (mg/dL), and pH using MilkoScanTM 7 RM (Foss Analytical A/S, Hillerød, Denmark). Somatic cell count and differential SCC (DSCC, %), calculated as the ratio of polymorphonuclear neutrophils plus lymphocytes to total milk SCC, were determined through FossomaticTM 7 DC (Foss Analytical A/S, Hillerød, Denmark). Values of SCC were log-transformed to somatic cell score (SCS, units) to achieve the normality of the distribution as follows: SCS = 3 + log2(SCC/100,000).
Data editing and statistical analyses
Milk samples exceeding three standard deviations from the respective mean were set to missing and thus excluded from subsequent statistical analyses. Four classes of SCS were defined based on the quartiles of the distribution: the low class included SCS ≤ −0.001 (n = 30); the medium-low class included −0.001 < SCS ≤ 0.94 (n = 28); the medium-high class included 0.94 < SCS ≤ 2.94 (n = 31); and the high class included SCS > 2.94 (n = 31). For results of SCC < 50,000 cells/mL, DSCC was set to 45% following the approach of Wall et al. (Citation2018) and Schwarz et al. (Citation2020).
Pearson correlation coefficients were assessed using the CORR procedure of SAS 9.4 software (SAS Institute Inc., Cary, NC, USA), and sources of variation of MY and composition traits were investigated using the GLIMMIX procedure of the same software, according to the following linear mixed model:
where yijkl is the dependent variable (MY or composition trait); µ is the overall intercept of the model; quarteri is the fixed effect of the ith quarter position (4 classes: right front, left front, right rear, left rear); pathogenj is the fixed effect of the jth pathogen presence (2 classes: positive, negative); SCSk is the fixed effect of the kth SCS class (4 classes: low, medium-low, medium-high, high); (quarter × cow)il is the random interaction effect between the ith quarter position and the lth cow ∼ N(0, σ2QC), where σ2QC is the variance of the interaction; and eijkl is the random residual term ∼ N(0, σ2e), where σ2e is the residual variance. Multiple comparisons of least square means for the main effects of quarter position, pathogen presence, and SCS class were performed using Tukey-Kramer adjustment, with significance threshold set to p < .05. Contrast analyses between groups of fixed effect levels (i.e. front quarters and rear quarters) were performed using the LSESTIMATE and ESTIMATE statements of the GLIMMIX procedure of SAS 9.4 software, setting the statistical significance to p < .05.
Results and discussion
Descriptive statistics
Table summarises the descriptive statistics of MY and quality traits in quarter milk samples. Milk yield averaged 3.14 kg/quarter/milking, which was slightly lower than the average MY reported by Forsbäck et al. (Citation2010) for Swedish Red cows at udder quarter level (3.62 kg/quarter/milking). The daily MY per cow was estimated by multiplying the average MY per quarter by 4 (number of quarters) and then by 2 (number of milking/day), yielding a value of 25.12 kg/day. This MY is comparable to the individual MY reported by Visentin et al. (Citation2018) and Franzoi et al. (Citation2019) for SI cows in single-breed herds of northeast of Italy. Fat, protein, casein, and lactose contents averaged 2.98, 3.32, 2.60, and 4.80%, respectively (Table ). The lower fat than protein content was likely due to a drawback of the sampling procedures. Indeed, the four plastic buckets adopted for quarter milk collection may have favoured fat adhesion on buckets wall, which is not the case of the conventional milking procedures. The other milk traits measured in the present study were comparable to findings of Niero et al. (Citation2021) who investigated the effect of grazing on health status of SI cows by using milk quality traits, and Penasa et al. (Citation2014) who investigated milk coagulation properties of Holstein Friesian, Brown Swiss, and SI in multi-breed herds. The indicators of udder quarter health status, namely SCS and DSCC, averaged 1.54 and 56.93%, respectively. Such values are lower than those reported by Bobbo et al. (Citation2020) and Niero et al. (Citation2021) for SI, and by Magro et al. (Citation2023a) for dual-purpose Alpine Grey cows, likely due to the previously discussed drawback in sampling procedures, which indeed decreased milk fat content and consequently SCS (Caplan et al. Citation2013; D’Incecco et al. Citation2018).
Table 1. Descriptive statistics of quarter milk yield and quality traits.
Among composition traits, fat and lactose had the greatest and the lowest coefficient of variation (23.33 and 3.15%, respectively), and SCS and DSCC had coefficient of variation of 127.82 and 27.88%, respectively (Table ). In general, the variability of the traits was greater than that reported in previous studies (Penasa et al. Citation2014; Visentin et al. Citation2018; Niero et al. Citation2021), likely due to the structure of the experimental design which included the collection of milk samples from complete milking of each quarter rather than individual milk samples.
Average SCS in positive and negative samples at udder quarter level are reported in Table . Out of the 120 collected samples, 22 were positive and 98 negative. Out of the 22 positive samples, 13 were positive to NAS, 3 to Candida, 3 to Bacillus spp., 1 to Corynebacterium spp., 1 to Escherichia coli, and 1 was contaminated. Non-aureus staphylococci were the most isolated mastitis causing pathogens, in agreement with previous studies (Narayana et al. Citation2021; Magro et al. Citation2023b). Also, positive quarters were characterised by greater SCS; in fact, SCS of positive and negative quarters averaged 3.10 and 1.17, respectively.
Table 2. Average somatic cell score in positive (pos) and negative (neg) udder quarter milk samples.
Phenotypic correlations
Pearson correlation coefficients between MY and quality traits are summarised in Table . Milk urea was positively correlated with protein (r = 0.50; p < .001) and casein (r = 0.48; p < .001). Stoop et al. (Citation2007) reported a weak positive correlation between urea and protein content (r = 0.11) in a study evaluating genetic parameters of milk urea nitrogen and its relationship with milk production traits. On the contrary, other studies reported that as milk protein percentage increased, milk urea nitrogen concentration decreased (Johnson & Young Citation2003). Such divergent results are likely related to differences in feeding regimes, which are strictly connected with the synthesis of milk protein and urea metabolism (Roy et al. Citation2011).
Table 3. Pearson correlation coefficients between milk traits at quarter level.
In the present study, a moderate negative association between SCS and lactose (r = −0.33; p < .001) was observed. A similar negative association was reported by Lindmark-Månsson et al. (Citation2006) and Roveglia et al. (Citation2019), who estimated correlations of −0.77 and −0.39, respectively. In general, an increase of SCS is associated to a decrease of lactose content, which can be explained both by increased milk barrier permeability and impaired synthetic ability due to damage to the mammary tissue (Pyörälä Citation2003). A positive correlation was observed between SCS and urea content (r = 0.34, p < .001), in agreement with findings of Stoop et al. (Citation2007), who described altered protein metabolism during episodes of mastitis. Also, a weak negative association between DSCC and lactose content (r = −0.23; p < .05) was observed, which agrees with estimates of Bobbo et al. (Citation2019) who reported a weak correlation (r = −0.05) between these two traits in Italian Holsteins. As expected, SCS and DSCC were strongly correlated (r = 0.87; p < .001), similarly to Magro et al. (Citation2023c) who estimated a positive correlation between SCS and DSCC (r = 0.63; p ≤ .05) in individual milk of SI cows and concluded that combining information from these two traits is useful for a better monitoring of cow udder health status.
The milk pH was significantly correlated with the studied traits, except for MY and DSCC. Specifically, a moderate positive correlation was observed between pH and SCS (0.32; p < .001), in agreement with Kandeel et al. (Citation2019) who estimated a correlation of 0.50 between pH and SCC in early lactation dairy cows. Such an increase of pH in quarter milk samples with high SCC is associated to the increased permeability of blood capillaries which determines specific changes in mineral equilibrium. For example, citrates, bicarbonates, Na+, and Cl− are transferred from extracellular fluid into the lumen of mammary gland (Balcones et al. Citation1996; Caballero Villalobos et al. Citation2015; Martí-De Olives et al. Citation2020). Consequently, to maintain osmolarity, milk potassium level decreases (Kitchen Citation1981; Summer et al. Citation2009).
Significance of fixed effects
Results from the analysis of variance of MY and quality traits are summarised in Table . The effect of quarter position was the only one significant in explaining the variation of MY (F-value = 6.87; p < .001). This was also confirmed when comparing right and left front quarters vs. right and left rear quarters, which indeed affected only MY (p < .001) and had negligible effects on milk composition. Pathogen presence was the least important fixed effect to explain the variability of the studied traits, being significant only for pH (F-value = 5.09; p < .05). Somatic cell score class was significant for all studied traits (p < .05), with the exception of MY and protein content.
Table 4. F-values and significance of fixed effects included in the model for quarter milk yield and quality traits.
The random interaction effect between quarter position and cow explained a great proportion of variability of the investigated traits, with values that ranged from 72.47% for urea content to 97.47% for DSCC. The only exception was fat content, for which the interaction explained 34.05% of total variance.
Least squares means
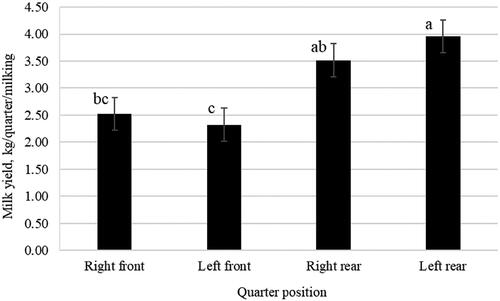
Figure depicts the least squares means of quarter MY according to quarter position. Rear quarters yielded more milk (3.96 and 3.52 kg for left and right quarter, respectively) than their front counterpart (2.32 and 2.53 kg for left and right quarter, respectively). Similar results were obtained through the contrast analysis, comparing the two front quarters (i.e. right and left) with the two rear quarters (i.e. right and left), which exhibited MY of 2.42 and 3.74 kg, respectively. Such a pattern is similar to that reported by Penry et al. (Citation2018) who analysed quarter MY of Holstein Friesian cows from automatic milking system. Also, Weiss et al. (Citation2004) reported greater MY in rear udder quarters of Brown Swiss × German Braunvieh crossbreed cows. This difference in MY is directly related to udder quarter conformation, with greater cisternal area for rear compared to front quarters (Ayadi et al. Citation2003). Results of the present study suggest that traditional milking systems may cause over-milking of front quarters due to their lower yield compared to rear quarters. In this view, the adoption of differential milking systems at udder quarter level (as already implemented in automatic milking systems) would be advisable (Krawczel et al. Citation2017).
Figure 1. Least squares means (with standard error) of quarter milk yield. a,b,cMeans with different superscript letters differ significantly (p < .05).
Intramammary infection status had no effect on the studied traits, except for a slight impact on pH. A more alkaline pH was observed in positive (6.61) than negative milk samples (6.59). It is likely that such difference is related to SCS level rather than to intramammary infection status. Indeed, as reported in Table , positive samples had greater SCS and greater pH, whereas negative samples had lower SCS and lower pH.
Table reports the least squares means of quarter MY and quality traits according to classes of SCS. Classes of SCS did not affect MY, and protein and casein content. Overall, lactose content decreased as SCS increased, moving from 4.89% (medium-high class) to 4.77% (high class). Costa et al. (Citation2019) reported similar results by testing the effect of different classes of lactose content on SCC. In particular, higher SCS was associated to lower lactose content. Opposite trends were observed for DSCC and pH, which increased towards the high SCS class. These trends confirm the previously discussed negative association between SCS and lactose, and the positive association between SCS and DSCC, and between SCS and pH. Results of the present study confirmed that variations in lactose, DSCC, and pH are useful indicators to monitor udder health status of dairy cows, even at udder quarter level.
Table 5. Least squares means (standard error) of quarter milk yield and quality traits.
Urea content significantly increased with SCS, moving from 20.22 mg/dL (low SCS) to 23.70 mg/dL (high SCS). This trend indicates a slight worsening of nitrogen metabolism towards greater SCS in agreement with results of Stoop et al. (Citation2007). Contrary to the findings of the present study, Mariani et al. (Citation2022) and Magro et al. (Citation2023a) observed lower concentration of urea in milk with high SCS, whereas Pegolo et al. (Citation2021) did not find significant changes in urea content across different levels of SCS and DSCC. Such an apparent inconsistency is likely related to different feeding regimes used in different trials (especially in terms of protein content, composition, and availability), thus making the comparison challenging. It is also worth noting that Pegolo et al. (Citation2021), Mariani et al. (Citation2022), and Magro et al. (Citation2023a) analysed individual composite milk and not udder quarter milk, which may suggest different interpretations.
Conclusions
The present study investigated the effect of quarter position, intramammary infection status, and SCS on MY and quality traits at udder quarter level. The effect of quarter position was significant for MY, with the right and left rear udder quarters yielding more milk than their front counterparts. On the other hand, quarter position had negligible effects on milk quality traits. Pathogens did not affect MY and had minor effects on milk quality traits, being significant only for milk pH. In general, milk quality was negatively affected when considering high SCS. In particular, lactose content decreased as SCS increased, whereas DSCC increased towards high SCS. These findings represent a contribution towards the possibility to better understand physiological processes involved in milk production and quality at udder quarter level. Based on the results, the adoption of independent buckets for complete quarter draining could be considered during routine milking procedures to effectively separate milk with high and low SCS, which significantly affected milk composition.
Ethical Approval
Procedures adopted in this study do not fall into the scope of an animal ethics evaluation, as they do not reach the thresholds established in the ‘Directive 2010/63/EU (Art. 1) of the European Parliament and of the council of 22 September 2010 on the protection of animals used for scientific purposes’.
Disclosure statement
No potential conflict of interest was reported by the author(s).
Data availability statement
None of the data were deposited in an official repository. The data that support the findings presented in this study are available from the first author or corresponding author upon reasonable request.
Additional information
Funding
References
- Ayadi M, Caja G, Such X, Knight CH. 2003. Use of ultrasonography to estimate cistern size and milk storage at different milking intervals in the udder of dairy cows. J Dairy Res. 70(1):1–7. doi: 10.1017/S0022029902005873.
- Balcones E, Olano A, Calvo MM. 1996. Factors affecting the rennet clotting properties of ewe’s milk. J Agric Food Chem. 44(8):1993–1996. doi: 10.1021/jf960138u.
- Bansal BK, Hamann J, Grabowski NT, Singh KB. 2005. Variation in the composition of selected milk fraction samples from healthy and mastitic quarters, and its significance for mastitis diagnosis. J Dairy Res. 72(2):144–152. doi: 10.1017/S0022029905000798.
- Benedet A, Manuelian CL, Zidi A, Penasa M, De Marchi M. 2019. Invited review: β-hydroxybutyrate concentration in blood and milk and its associations with cow performance. Animal. 13(8):1676–1689. doi: 10.1017/S175173111900034X.
- Bertocchi L, Vitali A, Lacetera N, Nardone A, Varisco G, Bernabucci U. 2014. Seasonal variations in the composition of Holstein cow’s milk and temperature–humidity index relationship. Animal. 8(4):667–674. doi: 10.1017/S1751731114000032.
- Bisutti V, Vanzin A, Pegolo S, Toscano A, Gianesella M, Sturaro E, Schiavon S, Gallo L, Tagliapietra F, Giannuzzi D, et al. 2023. Effect of intramammary infection and inflammation on milk protein profile assessed at the quarter level in Holstein cows. J Dairy Sci. 107(3):1413–1426. doi: 10.3168/jds.2023-23818.
- Bobbo T, Meoni G, Niero G, Tenori L, Luchinat C, Cassandro M, Penasa M. 2022. Nuclear magnetic resonance spectroscopy to investigate the association between milk metabolites and udder quarter health status in dairy cows. J Dairy Sci. 105(1):535–548. doi: 10.3168/jds.2021-20906.
- Bobbo T, Penasa M, Cassandro M. 2019. Short communication: genetic aspects of milk differential somatic cell count in Holstein cows: a preliminary analysis. J Dairy Sci. 102(5):4275–4279. doi: 10.3168/jds.2018-16092.
- Bobbo T, Penasa M, Cassandro M. 2020. Combining total and differential somatic cell count to better assess the association of udder health status with milk yield, composition and coagulation properties in cattle. Ital J Anim Sci. 19(1):697–703. doi: 10.1080/1828051X.2020.1784804.
- Bobbo T, Ruegg PL, Stocco G, Fiore E, Gianesella M, Morgante M, Pasotto D, Bittante G, Cecchinato A. 2017. Associations between pathogen-specific cases of subclinical mastitis and milk yield, quality, protein composition, and cheese-making traits in dairy cows. J Dairy Sci. 100(6):4868–4883. doi: 10.3168/jds.2016-12353.
- Bouraoui R, Lahmar M, Majdoub A, Djemali M, Belyea R. 2002. The relationship of temperature-humidity index with milk production of dairy cows in a Mediterranean climate. Anim Res. 51(6):479–491. doi: 10.1051/animres:2002036.
- Caballero Villalobos J, Garzón Sigler AI, Oliete B, Sánchez RA, Jiménez L, Sánchez NN, Martínez Marín AL, Departamento de Producción Animal, Universidad de Córdoba, Ctra. Madrid-Cádiz, km. 396, 14071 Córdoba, Spain. 2015. Relationship of somatic cell count and composition and coagulation properties of ewe’s milk. Mljekarstvo. 65:138–143. doi: 10.15567/mljekarstvo.2015.0208.
- Caplan Z, Melilli C, Barbano DM. 2013. Gravity separation of fat, somatic cells, and bacteria in raw and pasteurized milks. J Dairy Sci. 96(4):2011–2019. doi: 10.3168/jds.2012-6006.
- Costa A, Lopez-Villalobos N, Visentin G, De Marchi M, Cassandro M, Penasa M. 2019. Heritability and repeatability of milk lactose and its relationships with traditional milk traits, somatic cell score and freezing point in Holstein cows. Animal. 13(5):909–916. doi: 10.1017/S1751731118002094.
- D’Incecco P, Pellegrino L, Hogenboom JA, Cocconcelli PS, Bassi D. 2018. The late blowing defect of hard cheeses: behaviour of cells and spores of Clostridium tyrobutyricum throughout the cheese manufacturing and ripening. LWT. 87:134–141. doi: 10.1016/j.lwt.2017.08.083.
- Elgersma A, Tamminga S, Ellen G. 2006. Modifying milk composition through forage. Anim Feed Sci Technol. 131(3–4):207–225. doi: 10.1016/j.anifeedsci.2006.06.012.
- Forsbäck L, Lindmark-Månsson H, Andrén A, Akerstedt M, Andrée L, Svennersten-Sjaunja K. 2010. Day-to-day variation in milk yield and milk composition at the udder-quarter level. J Dairy Sci. 93(8):3569–3577. doi: 10.3168/jds.2009-3015.
- Franzoi M, Niero G, Visentin G, Penasa M, Cassandro M, De Marchi M. 2019. Variation of detailed protein composition of cow milk predicted from a large database of mid-infrared spectra. Animals (Basel). 9(4):176. doi: 10.3390/ani9040176.
- Hand KJ, Godkin A, Kelton DF. 2012. Milk production and somatic cell counts: a cow-level analysis. J Dairy Sci. 95(3):1358–1362. doi: 10.3168/jds.2011-4927.
- Ikonen T, Morri S, Tyrisevä AM, Ruottinen O, Ojala M. 2004. Genetic and phenotypic correlations between milk coagulation properties, milk production traits, somatic cell count, casein content, and pH of milk. J Dairy Sci. 87(2):458–467. doi: 10.3168/jds.S0022-0302(04)73185-9.
- Jenkins TC, McGuire MA. 2006. Major advances in nutrition: impact on milk composition. J Dairy Sci. 89(4):1302–1310. doi: 10.3168/jds.S0022-0302(06)72198-1.
- Johnson RG, Young AJ. 2003. The association between milk urea nitrogen and DHI production variables in western commercial dairy herds. J Dairy Sci. 86(9):3008–3015. doi: 10.3168/jds.S0022-0302(03)73899-5.
- Kandeel SA, Megahed AA, Ebeid MH, Constable PD. 2019. Ability of milk pH to predict subclinical mastitis and intramammary infection in quarters from lactating dairy cattle. J Dairy Sci. 102(2):1417–1427. doi: 10.3168/jds.2018-14993.
- Kitchen BJ. 1981. Bovine mastitis: milk compositional changes and related diagnostic tests. J Dairy Res. 48(1):167–188. doi: 10.1017/S0022029900021580.
- Krawczel P, Ferneborg S, Wiking L, Dalsgaard TK, Gregersen S, Black R, Larsen T, Agenäs S, Svennersten-Sjaunja K, Ternman E. 2017. Milking time and risk of over-milking can be decreased with early teat cup removal based on udder quarter milk flow without loss in milk yield. J Dairy Sci. 100(8):6640–6647. doi: 10.3168/jds.2016-12312.
- Lindmark-Månsson H, Bränning C, Aldén G, Paulsson M. 2006. Relationship between somatic cell count, individual leukocyte populations and milk components in bovine udder quarter milk. Int Dairy J. 16(7):717–727. doi: 10.1016/j.idairyj.2005.07.003.
- Magro S, Costa A, De Marchi M. 2023a. Total and differential somatic cell count in Italian local cattle breeds: phenotypic variability and effect on milk yield and composition. Animals (Basel). 13(7):1249. doi: 10.3390/ani13071249.
- Magro S, Costa A, Santinello M, Penasa M, De Marchi M. 2023c. Udder health-related traits in cow milk: phenotypic variability and effect on milk yield and composition. Animal. 17(6):100823. doi: 10.1016/j.animal.2023.100823.
- Magro S, Visentin E, Chiarin E, Cendron F, Penasa M, Costa A, Cassandro M, De Marchi M. 2023b. Pathogen detection via quantitative PCR in milk of healthy cows collected using different sampling protocols. Pathogens. 12(7):935. doi: 10.3390/pathogens12070935.
- Mariani E, Cipolat‐Gotet C, Stefanon B, Zecconi A, Stocco G, Sandri M, Ablondi M, Mountricha M, Summer A. 2022. Effect of total and differential somatic cell count on yield, composition and predicted coagulation properties from individual dairy cows. Int J of Dairy Tech. 75(2):298–307. doi: 10.1111/1471-0307.12857.
- Martí-De Olives A, Peris C, Molina MP. 2020. Effect on subclinical mastitis on the yield and cheese-making properties of ewe’s milk. Small Rumin Res. 184:106044. doi: 10.1016/j.smallrumres.2019.106044.
- Narayana SG, Schenkel F, Miglior F, Chud T, Abdalla EA, Naqvi SA, Malchiodi F, Barkema HW. 2021. Genetic analysis of pathogen-specific intramammary infections in dairy cows. J Dairy Sci. 104(2):1982–1992. doi: 10.3168/jds.2020-19062.
- National Mastitis Council (NMC). 1999. Laboratory handbook on bovine mastitis. USA: NMC.
- Niero G, Bobbo T, Callegaro S, Visentin G, Pornaro C, Penasa M, Cozzi G, De Marchi M, Cassandro M. 2021. Dairy cow’s health during alpine summer grazing as assessed by milk traits, including differential somatic cell count: a case study from Italy. Animals (Basel). 11(4):981. doi: 10.3390/ani11040981.
- Ogola H, Shitandi A, Nanua J. 2007. Effect of mastitis on raw milk compositional quality. J Vet Sci. 8(3):237–242. doi: 10.4142/jvs.2007.8.3.237.
- Pegolo S, Giannuzzi D, Bisutti V, Tessari R, Gelain ME, Gallo L, Schiavon S, Tagliapietra F, Trevisi E, Ajmone Marsan P, et al. 2021. Associations between differential somatic cell count and milk yield, quality, and technological characteristics in Holstein cows. J Dairy Sci. 104(4):4822–4836. doi: 10.3168/jds.2020-19084.
- Penasa M, Tiezzi F, Sturaro A, Cassandro M, De Marchi M. 2014. A comparison of the predicted coagulation characteristics and composition of milk from multi-breed herds of Holstein-Friesian, Brown Swiss and Simmental cows. Int Dairy J. 35(1):6–10. doi: 10.1016/j.idairyj.2013.10.004.
- Penry JF, Crump PM, Hernandez LL, Reinemann DJ. 2018. Association of quarter milking measurements and cow-level factors in an automatic milking system. J Dairy Sci. 101(8):7551–7562. doi: 10.3168/jds.2017-14153.
- Piccinini R, Binda E, Belotti M, Daprà V, Zecconi A. 2007. Evaluation of milk components during whole lactation in healthy quarters. J Dairy Res. 74(2):226–232. doi: 10.1017/S0022029906002317.
- Pyörälä S. 2003. Indicators of inflammation in the diagnosis of mastitis. Vet Res. 34(5):565–578. doi: 10.1051/vetres:2003026.
- Roveglia C, Niero G, Penasa M, Finocchiaro R, Marusi M, Lopez-Villalobos N, Cassandro M. 2019. Phenotypic analysis of milk composition, milk urea nitrogen and somatic cell score of Italian Jersey cattle breed. Ital J Anim Sci. 18(1):405–409. doi: 10.1080/1828051X.2018.1531684.
- Roy B, Brahma B, Ghosh S, Pankaj PK, Mandal G. 2011. Evaluation of milk urea concentration as useful indicator for dairy herd management: a review. Asian J Anim Vet Adv. 6(1):1–19. doi: 10.3923/ajava.2011.1.19.
- Sarikaya H, Werner-Misof C, Atzkern M, Bruckmaier RM. 2005. Distribution of leucocyte populations, and milk composition, in milk fractions of healthy quarters in dairy cows. J Dairy Res. 72(4):486–492. doi: 10.1017/S0022029905001317.
- Schwarz D, Kleinhans S, Reimann G, Stückler P, Reith F, Ilves K, Pedastsaar K, Yan L, Zhang Z, Valdivieso M, et al. 2020. Investigation of dairy cow performance in different udder health groups defined based on a combination of somatic cell count and differential somatic cell count. Prev Vet Med. 183:105123. doi: 10.1016/j.prevetmed.2020.105123.
- Stoop WM, Bovenhuis H, van Arendonk JAM. 2007. Genetic parameters for milk urea nitrogen in relation to milk production traits. J Dairy Sci. 90(4):1981–1986. doi: 10.3168/jds.2006-434.
- Summer A, Franceschi P, Malacarne M, Formaggioni P, Tosi F, Tedeschi G, Mariani P. 2009. Influence of somatic cell count on mineral content and salt equilibria of milk. Ital J Anim Sci. 8(sup2):435–437. doi: 10.4081/ijas.2009.s2.435.
- Viale E, Tiezzi F, Maretto F, De Marchi M, Penasa M, Cassandro M. 2017. Association of candidate gene polymorphisms with milk technological traits, yield, composition, and somatic cell score in Italian Holstein-Friesian sires. J Dairy Sci. 100(9):7271–7281. doi: 10.3168/jds.2017-12666.
- Visentin G, Penasa M, Niero G, Cassandro M, De Marchi M. 2018. Phenotypic characterisation of major mineral composition predicted by mid-infrared spectroscopy in cow milk. Ital J Anim Sci. 17(3):549–556. doi: 10.1080/1828051X.2017.1398055.
- Wall SK, Wellnitz O, Bruckmaier R, Schwarz D. 2018. Differential somatic cell count in milk before, during, and after lipopolysaccharide- and lipoteichoic-acid-induced mastitis in dairy cows. J Dairy Sci. 101(6):5362–5373. doi: 10.3168/jds.2017-14152.
- Weiss D, Weinfurtner M, Bruckmaier RM. 2004. Teat anatomy and its relationship with quarter and udder milk flow characteristics in dairy cows. J Dairy Sci. 87(10):3280–3289. doi: 10.3168/jds.S0022-0302(04)73464-5.