
ABSTRACT
The escalating worldwide occurrence of diabetes mellitus, recognized as a chronic metabolic ailment contributing to an amplified global disease burden, has stimulated researchers to explore its etiology. Consequently, the study employed a two-sample Mendelian randomization (MR) methodology to examine the causal connection between bacterial pneumonia and diabetes, drawing upon the existing observational study that identified a potential association between bacterial pneumonia and diabetes. Furthermore, MR investigations suggest a reciprocal causal relationship between bacterial pneumonia and gestational diabetes mellitus(GDM), and a plausible causal link between bacterial pneumonia and T1DM.
Background
Previous observational studies have established the high prevalence of bacterial pneumonia in diabetic patients, which in turn leads to increased mortality. However, the presence of a causal connection between bacterial pneumonia and diabetes remains unobserved.
Methods
We chose genome-wide significant (Ρ < 1 × 10⁻⁵ and Ρ < 1 × 10⁻⁶) and independent (r2 < 0.001) single-nucleotide polymorphisms (SNPs) as instrumental variables (IVs) to proceed a bidirectional two-sample MR study. The extracted SNPs explored the relationship between bacterial pneumonia and diabetes by Inverse variance weighted (IVW), MR-Egger, and weighted median methods. In addition, we conducted the Heterogeneity test, the Pleiotropy test, MR-presso and the Leave-one-out (LOO) sensitivity test to validate the reliability of results.
Results
In an MR study with bacterial pneumonia as an exposure factor, four different types of diabetes as outcome. It was observed that bacterial pneumonia increases the incidence of GDM (OR = 1.150 (1.027–1.274, P = 0.011) and T1DM (OR = 1.277 (1.024–1.531), P = 0.016). In the reverse MR analysis, it was observed that GDM (OR = 1.112 (1.023–1.201, P = 0.009) is associated with an elevated risk of bacterial pneumonia. However, no significant association was observed bacterial pneumonia with T1DM and other types of diabetes (P > 0.05).
Conclusion
This study utilizing MR methodology yields robust evidence supporting a bidirectional causal association between bacterial pneumonia and GDM. Furthermore, our findings suggest a plausible causal link between bacterial pneumonia and T1DM.
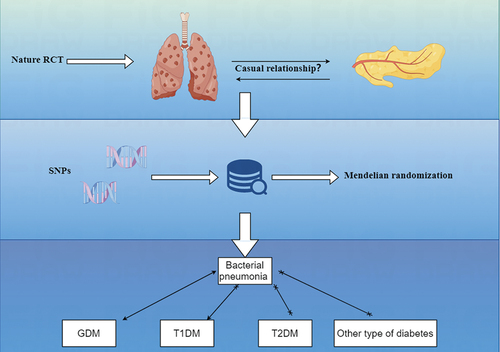
Graphical abstract
Introduction
Diabetes mellitus, characterized primarily by hyperglycemia and resulting in significant metabolic disturbances, poses challenges in early detection. However, timely screening and intervention can effectively mitigate complications and manage the condition. According to the International Diabetes Federation, projections indicate a staggering 537 million individuals will be affected by diabetes in 2021, with a potential increase of 19.7% by 2030. Consequently, it is anticipated that over 10% of the global population will be afflicted by diabetes in the coming years.Citation1 This chronic ailment, characterized by a significant disease burden, can be categorized into type 1 diabetes mellitus (T1DM), type 2 diabetes mellitus (T2DM), GDM, and other types of diabetes.Citation2
T1DM arises from the autoimmune-mediated impairment of insulin-producing beta cells, leading to diminished or absent insulin secretion. Additionally, scholarly investigations have posited that the inability of beta cells to undergo regeneration constitutes the fundamental etiology of T1DM.Citation3 T1DM, being a prototypical polygenic genetic disorder, is presently postulated to involve the involvement of determinants located at the DRB1, DQA1, and DQB1 loci on chromosome 6p21.Citation4 Furthermore, it was observed that the abundance of phylum bacteroidetes was elevated in individuals diagnosed with T1DM,Citation5 and the administration of probiotics led to a reduction in insulin needs among children with T1DM.Citation6 These findings suggest a potential association between bacterial presence and the pathogenesis of T1DM.
Despite the presence of shared symptoms between T2DM and T1DM, the pathogenesis of T2DM distinguishes itself by exhibiting cellular insensitivity to insulin and inadequate insulin production by beta cells, resulting in an inability to meet the body’s demand through feedback regulation.Citation1 The etiology of type 2 diabetes mellitus (T2DM) is characterized by a heightened complexity, owing to the robust genetic correlation between the MTNR1B rs10830963 G allele and T2DM.Citation7 In addition, several research studies have revealed that the salivary microorganisms Firmicutes, Lactobacillus, Veillonela, and Tannerella/T. forsythia are enriched in patients with T2DM.Citation8 obesity,Citation9 and cardiovascular disease.Citation10 Consequently, it can be inferred that the development of T2DM is influenced not only by genetic factors but also by external bacterial.
Glucose intolerance during pregnancy is commonly identified as gestational diabetes mellitus (GDM).Citation11 While GDM typically resolves postpartum, it elevates the risk of developing type 2 diabetes mellitus (T2DM) after delivery.Citation12 Furthermore, the emergence of GDM is linked to factors, such as age, body weight, polycystic ovary syndrome, and a familial predisposition to diabetes.Citation13
Other types of diabetes refer to specific types of diabetes that are caused by various factors, such as monogenic diabetes syndromes, diseases affecting the exocrine pancreas, and diabetes induced by drugs or chemicals.Citation2
The development of diabetes is commonly associated with both genetic factors and the external environment. It has been observed that individuals with diabetes who also have a K. pneumoniae infection experience a higher occurrence of sepsis and invasive infections. Furthermore, K. pneumoniae has been found to thrive in high glucose environments, resulting in elevated expression of the rmpA and ompA genes in hvKP. Consequently, this upregulation contributes to enhanced resistance against the immune system via the cAMP signaling pathway.Citation14 These observational studies provide preliminary evidence on potential exposure factors associated with bacterial pneumonia in individuals with diabetes. In previous observational studies, the presence of reverse causality has posed a challenge, rendering it arduous to ascertain a causal association between bacterial pneumonia and diabetes. However, the MR research approach employs genetic variation as an instrumental variable, wherein the allocation of genes to individuals occurs randomly before birth, thereby circumventing the influence of confounding factors and reverse causality. Stated differently, the application of MR in observational studies entails utilizing natural randomized controlled trials to infer causality between exposure and outcome. Therefore, MR research serves as a crucial approach for establishing causal inference when clinical randomized controlled trials (RCTs) are lacking. Consequently, we have opted to undertake a bidirectional two-sample MR study to explore the causal relationship between diabetes mellitus and bacterial pneumonia.
Materials and methods
The design methodology for this study is shown in . Through MR analysis of two-sample, we explored the relationship between bacterial pneumonia and subtype of diabetes().Citation15 MR test needs to meet four assumptions at the same time. First, SNPs must be strongly correlated with exposure. Second, SNPs cannot be directly related to outcome. Third, SNPs cannot be associated with any possible confusing factors. Last, no genetic assortative mating. This study required no additional ethical approval or informed consent because the data used came from publicly published data. The detailed bidirectional Mendelian randomization research process is shown in Figure S9.
Figure 1. Research flow chart. MR test needs to meet four assumptions at the same. time. First, SNPs must be strongly correlated with exposure. Second, SNPs cannot be directly related to outcome. Third, SNPs cannot be associated with any possible confusing factors. Last, no genetic assortative mating.
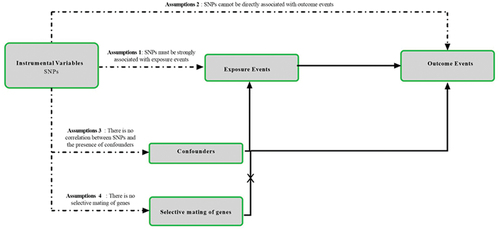
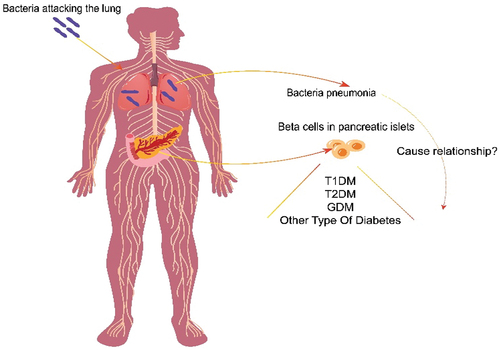
Figure 2. What the relationship between bacteria pneumonia and diabetes?.
Data sources
The summary data for the MR are sourced from genome-wide association studies (GWASs; https://gwas.mrcieu.ac.uk/). We select SNPs as IVs for bacterial pneumonia (GWAS ID: finn-b-J10_PNEUMOBACTEROTH; https://gwas.mrcieu.ac.uk/datasets/finn-b-J10_PNEUMOBACTEROTH/; n = 196,382), We chose outcome data for GDM (GWAS ID: finn-b-O15_PREG_DM; Trait: Diabetes mellitus in pregnancy– IEU OpenGWAS project (mrcieu.ac.uk); n = 116,363), for T1DM (GWAS ID: finn-b-T1D; https://gwas.mrcieu.ac.uk/datasets/finn-b-T1D/; n = 185,258), for T2DM (GWAS ID: finn-b-T2D; https://gwas.mrcieu.ac.uk/datasets/finn-b-T2D; n = 211,766), for other type of diabetes (GWAS ID: finn-b-DM_OTHER_WIDE; https://gwas.mrcieu.ac.uk/datasets/finn-b-DM_OTHER_WIDE/; n = 210,039). To avoid population bias, we selected SNPs and their corresponding summary data from studies that recruited only individuals of European ancestry for pneumonia and diabetes.
SNPs selection
series of quality control steps to select eligible IVs.Citation16 Specifically, we chose SNPs associated with GWASs were selected as IVs for bacterial pneumonia (P < 1 × 10⁻⁵) and diabetes mellitus (P < 1 × 10⁻⁶).Citation17–19 To fulfill the minimum criteria for MR studies, which necessitate a minimum of 10 eligible independent variables (IVs), we employed more lenient thresholds.Citation20 We clumped SNPs to achieve independent loci with a threshold of linkage disequilibrium (LD) r2 = 0.001 and distance of 10000kb.Citation20,Citation21 Also, these SNPs were searched form GWAS threshold (P < 1 × 10⁻⁵) by the PhenoScanner V2 database (http://www.phenoscanner.medschl.cam.ac.uk/) to exclude the effects of Confounding factors of diabetes (smoking,Citation22 alcohol consumption,Citation23 high carbohydrate diet,Citation24 overweight,Citation25 hypertension,Citation26 hyperlipidemiaCitation27 and Bacterial pneumonia (malnutrition, air pollution exposure, smoking, low immunity)Citation28 then we computed R2-value, the proportion of phenotypic variation explained by each SNP[using the formula: R2=: 2*betaCitation2*EAF*(1-EAF)/(2*betaCitation2*EAF*(1-EAF) + seCitation2 *2*N*EAF(1-EAF)), EAF is the effect allele frequency for each SNP, N is the sample size and se is standard error].Citation29 Calculate the F-statistic [using formula: F= (N-2)*R2/(1-R2), N is the sample size]to assess the extent of weak instrument bias, F > 10 suggests that full of instrumental SNPs are sufficiently strong to lessen any potential bias, while an F-statistic ≤10 implies weak instruments.Citation30
MR Analysis
We used Inverse variance weighted (IVW) method as the primary analytical method.Citation31 The instrumental variable weighting (IVW) method, frequently utilized in two-sample Mendelian randomization (MR) analysis, provides a means to estimate the causal effects of all instrumental variables (IVs) in the absence of heterogeneity or pleiotropy. Additionally, we employed two distinct approaches [MR – Egger, weighted median (WM)] to examine the association between bacterial pneumonia and diabetes. In scenarios where only heterogeneity is present without pleiotropy, the weighted median method is given priority in generating results. Conversely, when pleiotropy is present, the MR Egger method is prioritized for result calculation.Citation32
Sensitivity analyses
In addition, we conduct tests for heterogeneity and pleiotropy analysis. Cochran’s Q statistic for IVW and MR Egger was calculated to evaluate heterogeneity between different SNPs.Citation33 MR – Egger intercept of MR pleiotropy residual sum to detect pleiotropy of results where P > 0.05 indicates no horizontal pleiotropy.Citation34 In addition, we used MR-presso to confirm the presence of heterogeneity in the results and detect outliers. Following the removal of outliers, it is necessary to conduct a new MR analysis. At last, A leave-one-out analysis was performed to estimate whether a single SNP affected the causal relationship between pneumonia and diabetes. All analysis were showed with the “Two-Sample MR” package in R (version 4.2.1) software.
Results
Character of SNP for analysis
This study identified 20 SNPs that exhibited significant associations with bacterial pneumonia, while no significant associations were found with GDM, T1DM, T2DM, or other types of diabetes. Additionally, 11, 13, 104, and 94 SNPs were identified as IVs for GDM, T1DM, T2DM, and other types of diabetes, respectively, in reverse Mendelian randomization (MR) studies. The F-statistics of the SNPs included in this study all exceeded 10, indicating the absence of weak instrumental bias and thereby confirming the reliability of the research findings (Detailed information about SNPs is provided in Table S9).MR study on the causal relationship of bacterial pneumonia on diabetes
MR results of bacterial pneumonia on diabetes is listed in and Table S1. Scatter plots () illustrate the effect of each SNP for exposure to outcome and show the causes of the MR analysis. We found that bacterial pneumonia has a strong causal relationship with GDM (OR = 1.150(1.027–1.274, P = 0.011) and T1DM (OR = 1.277 (1.024–1.531), P = 0.016). In addition, GDM (OR = 1.196 (1.019–1.373), P = 0.018) Weighted median show the same results as IVW results. But MR-Egger for GDM (OR = 1.001 (0.794–1.208), P = 0.993) did not show the same results as IVW results. T1DM (OR = 0.041 (0.979–1.569), P = 0.041) Weighted median show the same results as IVW results. But MR-Egger for T1DM (OR = 1.294 (0.790–1.799), P = 0.993) did not show the same results as IVW results. The MR-Egger intercept (Table S2) suggests the absence of pleiotropy in the investigation of GDM (P = 0.144) and T1DM (P = 0.939), while the heterogeneity analysis further supports the absence of heterogeneity in the study of these conditions (GDM:P = 0.507, T1DM:P = 0.070) (). The exclusion of a single SNP did not yield significant variations in the LOO analysis (), thereby bolstering the reliability of the findings. Consequently, the IVW results should be considered as the research findings for GDM and T1DM.
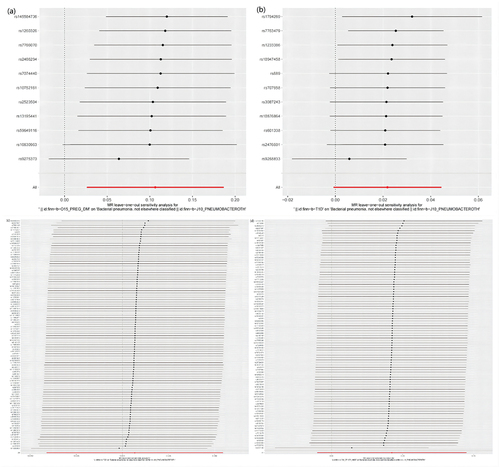
Figure 3. The results of IVW, MR-Egger regression, and weighted median analysis of bacterial pneumonia on diabetes.
Figure 4. Scatter plots of MR analysis. (a) exposure bacterial pneumonia and outcome GDM; (b) exposure bacterial pneumonia and outcome T1DM; (c) exposure bacterial pneumonia and outcome T2DM; (d) exposure bacterial pneumonia and outcome other type of diabetes.
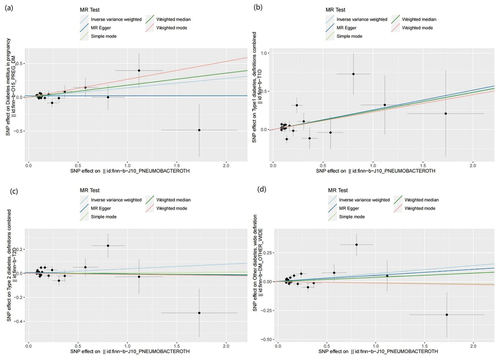
Figure 5. Leave one out analysis results. (a) exposure bacterial pneumonia and outcome GDM; (b) exposure bacterial pneumonia and outcome T1DM; (c) exposure bacterial pneumonia and outcome T2DM; (d) exposure bacterial pneumonia and outcome other type of diabetes.
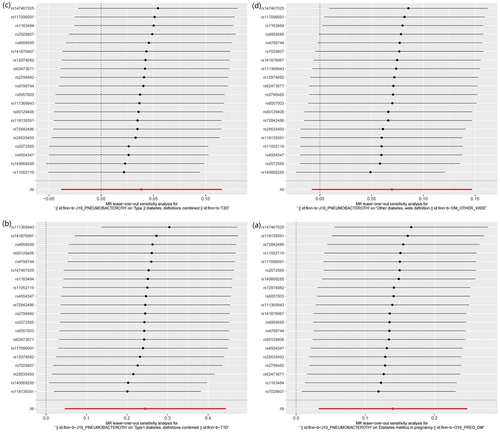
MR results did not observe bacterial pneumonia had causal relationship with T2DM (OR = 1.039 (0.959–1.119), P = 0.326) and other type of diabetes (OR = 1.004 (0.969–1.040), P = 0.078). This study discovered that while there is no pleiotropy observed between T2DM and other type of diabetes (T2DM: P = 0.141, other type of diabetes: P = 0.792), there may exist heterogeneity (T2DM: P = 0.022, other type of diabetes: P = 0.007) (). Consequently, MR-presso was employed to identify outliers. In the T2DM, MR-presso failed to identify any outliers, suggesting insufficient evidence to support the presence of heterogeneity in the research findings of T2DM. Outliers (rs145668285) were identified in other type of diabetes, prompting a subsequent MR analysis after their removal (, Table S3, Table S4, Figure S2, Figure S3, Figure S4). However, the results remained unchanged, indicating the absence of a causal relationship between bacterial pneumonia and other type of diabetes. The LOO analysis () did not identify any specific SNP that exerted a significant influence on the overall outcomes. The findings of the sensitivity analysis are displayed through the utilization of funnel plots (Figure S1 and Figure S4).
Table 1. Summary of GWAS data characteristics in the two-sample MR.
Table 2. The results of the heterogeneity analysis.
MR study on the causal relationship of diabetes on bacterial pneumonia
The findings of the MR analysis are depicted in and Table S5, and the research demonstrated a correlation between GDM and the development of bacterial pneumonia. Scatter plots () illustrate the effect of each SNP for exposure to outcome and show the causes of the MR analysis. The findings of the study suggest that GDM (OR = 1.112 (1.023–1.201, P = 0.009) exhibits significant IVW results upon exposure. Furthermore, the results are corroborated by Weighted Median (OR = 1.144 (1.043–1.245, P = 0.003) and MR-Egger (OR = 1.255 (1.057–1.453, P = 0.020) methods, thereby supporting the occurrence of bacterial pneumonia attributed to GDM. Additionally, the MR-Egger intercept indicates the absence of pleiotropy in GDM, and heterogeneity analysis reveals no heterogeneity in GDM research (Table S6). The Leave-One-Out (LOO) analysis further reinforces these findings ().
Figure 6. The results of IVW, MR-Egger regression, and weighted median analysis of diabetes on bacterial pneumonia.
Figure 7. Scatter plots of MR analysis. (a) exposure GDM and outcome bacterial pneumonia; (b) exposure T1DM and outcome bacterial pneumonia; (c) exposure T2DM and outcome bacterial pneumonia; (d) exposure other type of diabetes and outcome bacterial pneumonia.
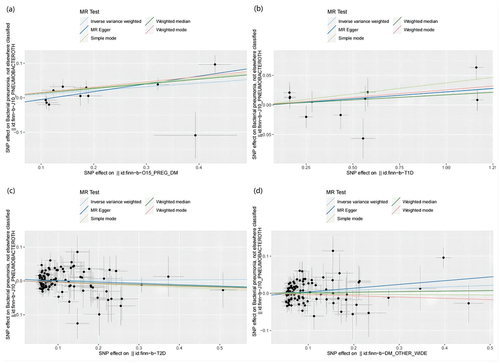
Figure 8. Leave one out analysis results. (a) exposure GDM and outcome bacterial pneumonia; (b) exposure T1DM and outcome bacterial pneumonia; (c) exposure T2DM and outcome bacterial pneumonia; (d) exposure other type of diabetes and outcome bacterial pneumonia.
The MR analysis conducted in this study did not identify a causal association between T1DM, T2DM, and other type of diabetes as exposures and bacterial pneumonia. It is important to highlight that heterogeneity was observed in the results when other type of diabetes was utilized as an exposure (). To address this issue, outlier SNPs were removed using MR-presso, and the MR analysis was repeated. However, this additional analysis did not yield any alterations in the study findings (Table S7, Table S8, Figure S6, Figure S7, Figure S8). Furthermore, the LOO analysis failed to detect any SNPs that significantly influenced the outcomes, thereby indicating the reliability of the study’s findings during the time of its execution (, Figure S7). The findings of the sensitivity analysis are displayed through the utilization of funnel plots (Figure S5, Figure S8).
Table 3. The results of the heterogeneity analysis.
Discussion
In this study, we found that bacterial pneumonia increases the incidence of GDM (OR = 1.150 (1.027–1.274, P = 0.011) and T1DM (OR = 1.277 (1.024–1.531), P = 0.016) by MR analysis, which can be considered as new evidence. In the reverse MR analysis, it was observed that GDM (OR = 1.112 (1.023–1.201, P = 0.009) is associated with an elevated risk of bacterial pneumonia. This finding suggests that the MR study provides evidence for a bidirectional causal connection between GDM and bacterial pneumonia.
The scope of MR studies pertaining to diabetes remains relatively restricted. The existing body of evidence linking diabetes and bacteria primarily focuses on intestinal flora.Citation35 Previous observational studies have revealed a higher incidence of bacterial pneumonia among hospitalized individuals with diabetes.Citation36 Additionally, patients with inadequate blood glucose control exhibit an elevated susceptibility to diabetes-related pneumonia necessitating hospitalization.Citation37 Furthermore, research has demonstrated that a prior diagnosis of diabetes serves as an autonomous predisposing element for the development of bacteremia in patients with pneumococcal pneumonia. When compared to pneumonia without bacteremia, the presence of diabetes exhibits a substantial augmentation in patient mortality.Citation38 An increasing body of research has demonstrated the significance of diabetes as a crucial risk factor influencing the clinical severity of various infections. Recent investigations have revealed a propensity for patients infected with Klebsiella pneumoniae to develop fundamental diabetic conditions.Citation36,Citation38 The plausible rationale posits that an environment rich in sugar induces immune impairment in the host and augments the capacity of hvKp to produce capsular polysaccharides.Citation39
GDM has emerged as a widespread epidemic in low and middle income countries, posing a significant threat to public health. In the European context, this condition has the potential to impact approximately 1.6 million live births, highlighting the urgent need for comprehensive preventive measures and effective management strategies.Citation1 The absence of early treatment alternatives frequently results in the disregard of this ailment. Nevertheless, the principal aim of managing GDM is to diminish blood glucose levels, thereby mitigating the likelihood of complications and mortality for both the maternal figure and the developing fetus throughout gestation.Citation40 It is our contention that identifying the determinants influencing its progression and implementing appropriate management strategies constitute efficacious approaches for mitigating the potential incidence of GDM. An examination of colostrum samples obtained from women diagnosed with GDM revealed a marked elevation in the prevalence of Staphylococcus and Prevotella among GDM patients, as compared to both normal and obese cohorts.Citation41 It is well established that Staphylococcus aureus has the capability to induce Staphylococcus aureus pneumonia (SAP) by infiltrating the epithelium via a compromised airway. This infiltration is accompanied by an upsurge in neutrophils, and the secretion of toxins by Staphylococcus aureus further exacerbates inflammation in the lung’s epithelial cells. As a result, there is a simultaneous increase in neutrophil count, accompanied by a decrease in tumor necrosis factor, KC, interleukin 6, and interleukin 1β,Citation42–44 these factors exhibit a strong correlation with the onset and progression of diabetic nephropathy. In addition, a study have found that patients with cystic fibrosis-related diabetes (CFRD) have a more rapid decline in lung function and that infection with Staphylococcus aureus is significantly associated with poor clinical outcomes in patients with CFRD.Citation45 GDM may develop into T2DM at the end of gestation, and a current study suggests that toxic shock syndrome toxin-1 (TSST-1) produced by Staphylococcus aureus can cause insulin resistance and that chronic TSST-1 stimulation leads to impaired glucose tolerance in rabbits, which matches the pathogenesis of T2DM.Citation46 The MR analysis conducted in our study did not yield evidence supporting a causal association between bacterial pneumonia and T2DM. Instead, our findings indicated that bacterial pneumonia exhibited an association solely with GDM and T1DM. Consequently, additional clinical RCTs are imperative to further investigate this matter.
Overall, the above evidence points to the possibility that bacterial pneumonia causes GDM and T1DM. Simultaneously, diabetes mellitus creates a hyperglycemic milieu that fosters the development of bacterial pneumonia. Our study presents compelling evidence supporting a bidirectional causal association between GDM and bacterial pneumonia, and we believe the existence of a potential causal link between bacterial pneumonia and T1DM. Subsequent investigations should prioritize the examination of the correlation between diverse forms of bacterial pneumonia and diabetes, given that our study did not encompass a comprehensive analysis of bacterial pneumonia.
Limitations
Our study is subject to several limitations. Firstly, it should be noted that the data utilized in this study is aggregated at the individual level, thereby precluding the possibility of conducting individual-level analyses. Secondly, the inability to select specific genes for further investigation of the obtained results represents another constraint. Thirdly, despite the robust evidence presented in this study regarding the association between diabetes development and bacterial pneumonia, the absence of interventions to mitigate the impact of confounding factors within the study population is a noteworthy limitation. Lastly, the absence of data pertaining to distinct subtypes of bacterial pneumonia and diabetes hinders the comprehensiveness of this investigation.
Advantages
The purpose of our study is to examine the causal relationship between bacterial pneumonia and diabetes using GWAS data. Compared to observational studies, MR is more reliable. Genetic variables studied have been studied for a long time and are not influenced by external factors, thus solving the endogeneity issue. Mendelian randomization posits that the alleles exhibit random and uniform distribution within the population, such as the genetic loci linked to pneumonia, thereby mitigating certain constraints inherent in conventional observational studies.
Conclusion
In conclusion, our study utilizing MR methodology yields robust evidence supporting a bidirectional causal association between bacterial pneumonia and gestational diabetes. Furthermore, our findings suggest a plausible causal link between bacterial pneumonia and T1DM.
Abbreviations
| SNPs | = | single-nucleotide polymorphisms |
| IVs | = | instrumental variables |
| MR | = | mendelian randomization |
| T1DM | = | type 1 diabetes mellitus |
| T2DM | = | type 2 diabetes mellitus |
| GDM | = | gestational diabetes mellitus |
| SAP | = | Staphylococcus aureus pneumonia |
| CFRD | = | cystic fibrosis-related diabetes |
| RCTs | = | randomized controlled trials |
Authors’ contributions
Conceptualization, WY.P.; writing – original draft preparation, ZQ.Z. and SY.P.; writing – review and editing, SY.P.; visualization, SY.P.; supervision, WY.P. All the authors have read and approved the final manuscript.
Availability of data and materials
The datasets generated and analyzed during the current study are available in the IEU open GWAS project [https://gwas.mrcieu.ac.uk/].
Graphical Abstract.png
Download PNG Image (128 KB)
Table S9 .xlsx
Download MS Excel (37.7 KB)supplymentary material.docx
Download MS Word (1.5 MB)Acknowledgments
We want to acknowledge the participants and investigators of FinnGen study and IEU GWAS.
Disclosure statement
No potential conflict of interest was reported by the author(s).
Supplementary material
Supplemental data for this article can be accessed online at https://doi.org/10.1080/19382014.2023.2291885
Additional information
Funding
References
- Magliano DJ, Boyko EJ, Committee IDFDAtes. IDF diabetes atlas. Idf diabetes atlas. Brussels: International Diabetes Federation. © International Diabetes Federation, 2021; 2021
- Classification and diagnosis of diabetes: standards of Medical Care in diabetes-2018. Diab Care. 2018 Jan;41(Suppl 1):S13–13. doi:10.2337/dc18-S002.
- In’t Veld P. Insulitis in human type 1 diabetes: The quest for an elusive lesion. Islets. 2011 Jul-Aug;3(4):131–138. doi:10.4161/isl.3.4.15728.
- Erlich H, Valdes AM, Noble J, Carlson JA, Varney M, Concannon P, Mychaleckyj JC, Todd JA, Bonella P, Fear AL, et al. HLA DR-DQ haplotypes and genotypes and type 1 diabetes risk: analysis of the type 1 diabetes genetics consortium families. Diabetes. 2008 Apr;57(4):1084–1092. doi:10.2337/db07-1331.
- Giongo A, Gano KA, Crabb DB, Mukherjee N, Novelo LL, Casella G, Drew JC, Ilonen J, Knip M, Hyöty H, et al. Toward defining the autoimmune microbiome for type 1 diabetes. ISME J. 2011 Jan;5(1):82–91. doi:10.1038/ismej.2010.92.
- Kumar S, Kumar R, Rohilla L, Jacob N, Yadav J, Sachdeva N. A high potency multi-strain probiotic improves glycemic control in children with new-onset type 1 diabetes mellitus: a randomized, double-blind, and placebo-controlled pilot study. Pediatr Diabetes. 2021 Nov;22(7):1014–1022. doi:10.1111/pedi.13244.
- Lane JM, Chang AM, Bjonnes AC, Aeschbach D, Anderson C, Cade BE, Cain SW, Czeisler CA, Gharib SA, Gooley JJ, et al. Impact of common diabetes risk variant in MTNR1B on sleep, Circadian, and melatonin physiology. Diabetes. 2016 Jun;65(6):1741–1751. doi: 10.2337/db15-0999.
- Cena JA, Reis LG, de Lima AKA, Vieira Lima CP, Stefani CM, Dame-Teixeira N. Enrichment of acid-associated microbiota in the saliva of type 2 diabetes mellitus adults: a systematic review. Pathogens. (Basel, Switzerland). 2023 Mar 2. 123. doi:10.3390/pathogens12030404.
- Blüher M, Aras M, Aronne LJ, Batterham, R.L., Giorgino F, Ji L, Pietiläinen KH, Schnell O, Tonchevska E, Wilding JP New insights into the treatment of obesity. Diabetes, obesity & metabolism. 2023 Apr 13. doi:10.1111/dom.15077
- Karmali R, Sipko J, Majid M, Bruemmer D Hyperlipidemia and cardiovascular disease in People with type 1 diabetes: review of Current Guidelines and evidence. Current cardiology reports. 2023 Apr 13. doi:10.1007/s11886-023-01866-x
- Report of the expert Committee on the diagnosis and classification of diabetes mellitus. Diab Care. Jul 1997;207:1183–1197. doi:10.2337/diacare.20.7.1183.
- Noctor E, Crowe C, Carmody LA, Saunders JA, Kirwan B, O’Dea A, Gillespie P, Glynn LG, McGuire BE, O’Neill C, et al. Abnormal glucose tolerance post-gestational diabetes mellitus as defined by the International association of diabetes and pregnancy study groups criteria. Eur J Endocrinol. 2016 Oct;175(4):287–297. doi:10.1530/eje-15-1260.
- WHO Guidelines Approved by the Guidelines Review Committee. Diagnostic criteria and classification of hyperglycaemia First detected in pregnancy. Geneva: World Health Organization Copyright © World Health Organization 2013; 2013.
- Tang L, Wang H, Cao K, Li, Y, Li T, Huang Y, Xu Y. Epidemiological Features and Impact of High Glucose Level on Virulence Gene Expression and Serum Resistance of Klebsiella pneumoniae Causing Liver Abscess in Diabetic Patients. Infect Drug Resist. 2023;16:1221–1230. doi:10.2147/idr.S391349.
- Pagoni P, Dimou NL, Murphy N, Stergiakouli E. Using Mendelian randomisation to assess causality in observational studies. Evid Based Ment Health. 2019 May;22(2):67–71. doi:10.1136/ebmental-2019-300085.
- Lawlor DA, Harbord RM, Sterne JA, Timpson N, Davey Smith G. Mendelian randomization: using genes as instruments for making causal inferences in epidemiology. Stat Med. 2008 Apr 15;27(8):1133–1163. doi:10.1002/sim.3034.
- Burgess S, Butterworth A, Thompson SG. Mendelian randomization analysis with multiple genetic variants using summarized data. Genet Epidemiol. 2013 Nov;37(7):658–665. doi:10.1002/gepi.21758.
- Yang Y, Ma X, Pang W, Jiang C. Causal associations of PM2.5 and GDM: a two-sample Mendelian randomization study. Toxics. 2023 Feb 13;11(2). doi:10.3390/toxics11020171.
- Ference BA, Majeed F, Penumetcha R, Flack JM, Brook RD. Effect of naturally random allocation to lower low-density lipoprotein cholesterol on the risk of coronary heart disease mediated by polymorphisms in NPC1L1, HMGCR, or both: a 2 × 2 factorial Mendelian randomization study. J Am Coll Cardiol. 2015 Apr 21;65(15):1552–1561. doi:10.1016/j.jacc.2015.02.020.
- Savage JE, Jansen PR, Stringer S, Watanabe K, Bryois J, de Leeuw CA, Nagel M, Awasthi S, Barr PB, Coleman JRI, et al. Genome-wide association meta-analysis in 269,867 individuals identifies new genetic and functional links to intelligence. Nat Genet. 2018 Jul;50(7):912–919. doi:10.1038/s41588-018-0152-6.
- Chen J, Chen H, Zhu Q, Liu Q, Zhou Y, Li L, Wang Y. Age at menarche and ischemic heart disease: an update mendelian randomization study. Front Genet. 2022;13:942861. doi:10.3389/fgene.2022.942861.
- Jee SH, Foong AW, Hur NW, Samet JM. Smoking and risk for diabetes incidence and mortality in Korean men and women. Diab Care. 2010 Dec;33(12):2567–2572. doi:10.2337/dc10-0261.
- Baliunas DO, Taylor BJ, Irving H, Roerecke, M, Patra J, Mohapatra S, Rehm J. Alcohol as a risk factor for type 2 diabetes: a systematic review and meta-analysis. Diab Care. 2009 Nov;32(11):2123–2132. doi:10.2337/dc09-0227.
- Khatib O. Noncommunicable diseases: risk factors and regional strategies for prevention and care. East Mediterr health J. = La Revue de Sante de la Mediterranee Orientale = Al-Majallah Al-Sihhiyah Li-Sharq Al-mutawassit. 2004 Nov;10(6):778–788. doi:10.26719/2004.10.6.778.
- Piché ME, Tchernof A, Després JP. Obesity Phenotypes, Diabetes, and Cardiovascular Diseases. Circ Res. 2020 May 22;126(11):1477–1500. doi:10.1161/circresaha.120.316101.
- González Maqueda I. Hipertensión arterial y diabetes [Arterial hypertension and diabetes] Revista espanola de cardiologia. 1997;50(Suppl 4):33–48 https://www.revespcardiol.org/en/linksolver/ft/ivp/0300-8932/50%20Suppl%204/33.
- Betteridge DJ. Diabetic dyslipidaemia. Eur J Clin Invest. 1999 Jun;29(Suppl 2):12–16. doi:10.1046/j.1365-2362.1999.00002.x.
- Marangu D, Zar HJ. Childhood pneumonia in low-and-middle-income countries: an update. Paediatr Respir Rev. 2019 Nov;32:3–9. doi:10.1016/j.prrv.2019.06.001.
- Shim H, Chasman DI, Smith JD, Mora S, Ridker PM, Nickerson DA, Krauss RM, Stephens M. A multivariate genome-wide association analysis of 10 LDL subfractions, and their response to statin treatment, in 1868 Caucasians. PLoS ONE. 2015;10(4):e0120758. doi:10.1371/journal.pone.0120758.
- Zhang Y, Xiong Y, Shen S, Yang J, Wang W, Wu T, Chen L, Yu Q, Zuo H, Wang X, et al. Causal association between Tea Consumption and kidney function: a Mendelian randomization study. Front Nutr. 2022;9:801591. doi:10.3389/fnut.2022.801591.
- Bowden J, Del Greco MF, Minelli C, Davey Smith G, Sheehan N, Thompson J. A framework for the investigation of pleiotropy in two-sample summary data Mendelian randomization. Stat Med. 2017 May 20;36(11):1783–1802. doi:10.1002/sim.7221.
- Burgess S, Thompson SG. Interpreting findings from Mendelian randomization using the MR-Egger method. Eur J Epidemiol. 2017;32(5):377–389. doi:10.1007/s10654-017-0255-x.
- Greco MF, Minelli C, Sheehan NA, Thompson JR. Detecting pleiotropy in Mendelian randomisation studies with summary data and a continuous outcome. Stat Med. 2015 Sep 20;34(21):2926–2940. doi:10.1002/sim.6522.
- Shu MJ, Li JR, Zhu YC, Shen H. Migraine and ischemic stroke: a Mendelian randomization study. Neurol Ther. 2022 Mar;11(1):237–246. doi:10.1007/s40120-021-00310-y.
- Yuan S, Merino J, Larsson SC. Causal factors underlying diabetes risk informed by Mendelian randomisation analysis: evidence, opportunities and challenges. Diabetologia. 2023 May;66(5):800–812. doi:10.1007/s00125-023-05879-7.
- Torres A, Blasi F, Dartois N, Akova M. Which individuals are at increased risk of pneumococcal disease and why? Impact of COPD, asthma, smoking, diabetes, and/or chronic heart disease on community-acquired pneumonia and invasive pneumococcal disease. Thorax. 2015 Oct;70(10):984–989. doi:10.1136/thoraxjnl-2015-206780.
- Kornum JB, Thomsen RW, Riis A, Lervang HH, Schønheyder HC, Sørensen HT. Diabetes, glycemic control, and risk of hospitalization with pneumonia: a population-based case-control study. Diab Care. 2008 Aug;31(8):1541–1545. doi:10.2337/dc08-0138.
- Kang CI, Song JH, Kim SH, Chung DR, Peck KR, Thamlikitkul V, Wang H, So TMK, Hsueh P-R, Yasin RM, et al. Risk factors and pathogenic significance of bacteremic pneumonia in adult patients with community-acquired pneumococcal pneumonia. J Infect. 2013 Jan;66(1):34–40. doi:10.1016/j.jinf.2012.08.011.
- Guo M, Gao B, Su J, Zeng Y, Cui Z, Liu H, Guo X, Zhu Y, Wei B, Zhao Y, et al. Phenotypic and genetic characterization of hypervirulent Klebsiella pneumoniae in patients with liver abscess and ventilator-associated pneumonia. BMC Microbiol. 2023 Nov 13;23(1):338. doi:10.1186/s12866-023-03022-5.
- Dhingra A, Ahuja K. Lifestyle modifications for GDM. J Pak Med Assoc. 2016 Sep;66(9 Suppl 1):S34–38.
- Gámez-Valdez JS, García-Mazcorro JF, Montoya-Rincón AH, Rodríguez-Reyes DL, Jiménez-Blanco G, Rodríguez MTA, de Vaca RPC, Alcorta-García MR, Brunck M, Lara-Díaz VJ, et al. Differential analysis of the bacterial community in colostrum samples from women with gestational diabetes mellitus and obesity. Sci Rep. 2021 Dec 21;11(1):24373. doi:10.1038/s41598-021-03779-7.
- Liu GY. Molecular pathogenesis of Staphylococcus aureus infection. Pediatr Res. 2009 May;65(5 Pt 2):71r–77r. doi:10.1203/PDR.0b013e31819dc44d.
- Parker D, Ryan CL, Alonzo F 3rd, Torres VJ, Planet PJ, Prince AS. CD4+ T cells promote the pathogenesis of Staphylococcus aureus pneumonia. J Infect Dis. 2015 Mar 1;211(5):835–845. doi:10.1093/infdis/jiu525.
- Spaan AN, Surewaard BG, Nijland R, van Strijp JA. Neutrophils versus Staphylococcus aureus: a biological tug of war. Annu Rev Microbiol. 2013;67(1):629–650. doi:10.1146/annurev-micro-092412-155746.
- Limoli DH, Yang J, Khansaheb MK, Helfman B, Peng L, Stecenko AA, Goldberg JB Staphylococcus aureus and Pseudomonas aeruginosa co-infection is associated with cystic fibrosis-related diabetes and poor clinical outcomes. Eur J Clin Microbiol Infect Dis. 2016 Jun;35(6):947–953. doi:10.1007/s10096-016-2621-0.
- Vu BG, Stach CS, Kulhankova K, Salgado-Pabón W, Klingelhutz AJ, Schlievert PM. Chronic superantigen exposure induces systemic inflammation, elevated bloodstream endotoxin, and abnormal glucose tolerance in rabbits: possible role in diabetes. mBio. 2015 Feb 24;6(2):e02554. doi:10.1128/mBio.02554-14.