
Abstract
The distribution pattern and the age and growth of Blue Sharks Prionace glauca were described based on 44,092 and 785 specimens, respectively, that were collected by scientific observers onboard Taiwanese longline fleets in the South Atlantic Ocean between December 2004 and December 2013. Size segregation was found, and the mean length of Blue Sharks was significantly larger in the equatorial–tropical area (0–15°S) than in the subtropical–temperate area (south of 15°S) during all seasons. Males predominated in both areas and during all seasons; the exceptions were seasons 2 (April–June) and 3 (July–September) in the equatorial–tropical area and season 2 in the subtropical–temperate area. The sex ratio increased with shark size in the equatorial–tropical area but decreased with size in the subtropical–temperate area. Growth band pairs (including translucent and opaque bands) were counted on images photographed from X-ray films of vertebrae from the caudal peduncle region. The centrum edge analysis indicated that a growth band pair was formed on the vertebral centrum once per year. Corrected Akaike’s information criterion values indicated that the von Bertalanffy growth function (VBGF) provided the best fit to the observed TL-at-age data. The likelihood ratio test indicated that the VBGF equations were not significantly different between the sexes. For both sexes combined, VBGF parameters were estimated as follows: asymptotic length was 352.1 cm TL, the Brody growth coefficient was 0.13/year, and the theoretical age at zero length was –1.31 years. Age at first maturity was estimated as 6.5 years for males and 6.7 years for females; theoretical longevity was estimated to be at least 21.4 years.
Received April 8, 2016; accepted October 11, 2016
The Blue Shark Prionace glauca is a pelagic shark species with a circumglobal distribution, inhabiting tropical, subtropical, and temperate waters (Compagno Citation1984). Blue Sharks can be caught from the surface to a depth of at least 600 m (Cailliet and Beforad Citation1983; Compagno Citation1984; Nakano and Stevens Citation2008). The Blue Shark is the top shark bycatch species for Taiwanese longline fisheries in the Atlantic, Pacific, and Indian oceans (Joung et al. Citation2005b; Huang and Liu Citation2010; Tsai et al. Citation2015). Because large numbers of Blue Sharks are caught by various fisheries, the species’ stock status has become an issue of great concern for regional fisheries management organizations, such as the Western and Central Pacific Fisheries Commission, the International Commission for the Conservation of Atlantic Tunas (ICCAT), and the Indian Ocean Tuna Commission.
The reproductive biology of Blue Sharks in the Atlantic Ocean has been well described; studies include those by Pratt (Citation1979), Hazin et al. (Citation1994), Castro and Mejuto (Citation1995), and Mejuto and Gracía-Cortés (Citation2005). Growth parameters of Blue Sharks in the North Atlantic also have been well documented. For example, Aasen (Citation1966) and Stevens (Citation1975) described the age and growth of Blue Sharks in the North Atlantic, and Henderson et al. (Citation2001) reported a combined-sex von Bertalanffy growth function (VBGF) for Blue Sharks in the northeast Atlantic. Skomal and Natanson (Citation2003) documented sex-specific VBGF parameters for North Atlantic Blue Sharks by using vertebral band pair counts and tagging data. In addition, Joung et al. (Citation2005b) described the shark bycatch of the Taiwanese tuna longline fishery in the South Atlantic; Carvalho et al. (Citation2015) reported fishery selectivity for Blue Sharks in the South Atlantic based on satellite tagging; Coelho et al. (Citation2015) described the size, sex ratio, and distribution pattern of Blue Sharks in the Atlantic based on observer data from the major fishing fleets; and Tsai and Liu (Citation2016) determined a revised Blue Shark catch rate for the Taiwanese longline fishery in the Atlantic.
Age and growth parameters are essential information for assessing the Blue Shark stock. Although Lessa et al. (Citation2004) derived combined-sex VBGF parameters from back-calculated TLs of Blue Sharks in northeastern Brazilian waters, VBGF parameters for Blue Sharks in the South Atlantic are still poorly described, particularly for the eastern region of the South Atlantic. Here, we describe the distribution pattern and the age and growth of Blue Sharks in the eastern South Atlantic based on sampling records and vertebrae that were collected by scientific observers onboard Taiwanese longline fishing vessels. Our intent is to contribute information that enhances the understanding of Blue Shark life history in the South Atlantic.
METHODS
Specimen collection and preparation
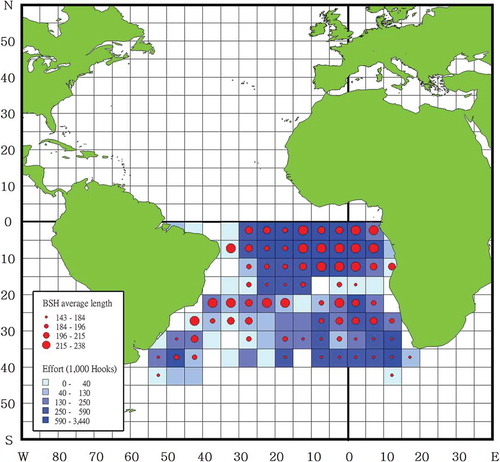
Blue Shark specimens caught by Taiwanese far-sea longline vessels in the South Atlantic (50°35′W–13°51′E, 0–40°6′S) between January 2004 and December 2013 () were opportunistically collected by onboard scientific observers. The fishing date, location, weight (kg), and FL (cm) of the specimens were recorded, and the sex of each specimen was identified. Considering the behavior of the Taiwanese longline fleets, the study region was stratified into two areas (the equatorial–tropical area [0–15°S] and the subtropical–temperate area [south of 15°S]). The fishing vessels targeted Bigeye Tuna Thunnus obesus in the equatorial–tropical area and Albacore Thunnus alalunga in the subtropical–temperate area. Four seasons were defined as January–March (season 1), April–June (season 2), July–September (season 3), and October–December (season 4).
FIGURE 1. Fishing effort and Blue Shark (BSH) size (FL, cm) recorded by Taiwanese observers on longline fishing vessels operating in the South Atlantic from 2004 to 2013. The color scale within grid cells represents fishing effort, with darker blue representing more hooks and lighter blue representing fewer hooks. The size of the red dots indicates the mean FL categorized using 25th percentiles of the data.
Vertebral samples from the caudal peduncle region of Blue Shark specimens were collected for age estimation between December 2006 and December 2011 () in the eastern South Atlantic (east of 25°W). The TL measurements were taken when the specimens were in the natural state. Vertebral samples were frozen and sent to our laboratory for further processing. The vertebrae were rinsed in 10% KOH for 5–60 min to remove connective tissue; they were then rinsed with running water for 24 h and air dried (Joung et al. Citation2004). After the vertebrae were soaked in ethyl alcohol and t-butyl alcohol, they were embedded in paraffin to prevent shrinkage and deformation. Each vertebral centrum was cut into two pieces along the lateral plane using an Isomet low-speed saw (Buehler, Lake Bluff, Illinois). The ventrodorsal radius (VR) of the processed vertebrae was measured to the nearest millimeter. The relationship between VR (mm) and TL (cm) was described by a linear regression model. The difference in sex-specific relationships was examined by conducting ANCOVA.
TABLE 1. Sample sizes and TL ranges of Blue Shark specimens that were captured from the South Atlantic (2006–2011) and used for age analyses.
Size and sex ratio data analysis
The mean sizes of specimens were compared between areas, between sexes, and among seasons by using t-tests and ANOVA, assuming a normal distribution because of the large sample size. The annual variation in mean catch at size was examined by ANOVA. Sex ratio was expressed as the proportion female (i.e., [number of females]/[number of fish of both sexes combined]); a chi-square test was used to compare sex ratios between areas, among seasons, and among size-classes (categorized by the 20th percentile of the data). A significance level of 0.05 was used in all statistical tests.
Age estimation and verification
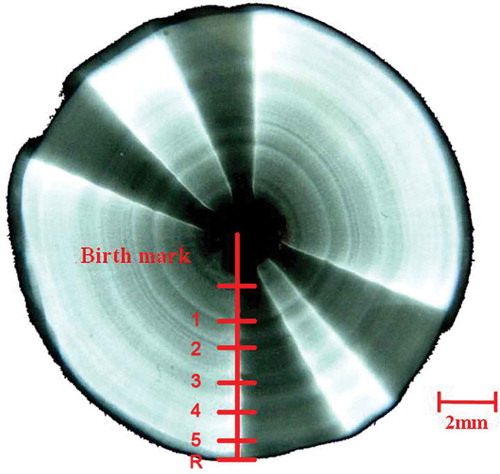
Processed vertebrae were photographed by a soft X-ray (Laiko XL-080 1359, Japan) at 36 kV and 25 mA for 2.5 min. The X-ray films were put on the negatoscope, and the vertebral images were photographed with a digital camera (Canon PowerShot D10). Growth band pairs were counted on the vertebral images by using Adobe Photoshop CS4 version 11.0 (). Each band pair comprised one opaque band and one translucent band (Cailliet et al. Citation2006). The image was read by two readers, and if the two readings matched, the matching reading was adopted. Following the protocol of a previous study (Joung et al. Citation2004), counts that differed by 2 or more band pairs were rejected. If the count differed by 1 band pair, then the vertebral centrum was recounted by the first reader, and that final count was accepted if it agreed with one of the previous counts. If the third count did not match one of the previous two counts, the sample was discarded (Joung et al. Citation2005a, Citation2008, Citation2011).
FIGURE 2. An example X-ray image of a Blue Shark vertebral centrum (from a female, 205 cm TL) magnified by Adobe Photoshop CS4 version 11.0 and displayed on screen. The number of growth band pairs is depicted; R = the radius.
The index of average percentage error (IAPE; Beamish and Fournier Citation1981) and the coefficient of variation (CV; Chang Citation1982) were used to estimate the reproducibility of age estimation between the two readings (Campana Citation2001; Lessa et al. Citation2004). The equations used for IAPE and CV are as follows:
and
where N is the number of sharks aged, R is the number of readings, Xij is the count from the jth shark at the ith reading, Xj is the mean count for the jth shark from i readings, and si is the SD of i counts from the jth shark.
The periodicity of band pair formation was estimated via centrum edge analysis using vertebrae with 2–8 band pairs; the estimated periodicity was further verified by using a model (Okamura and Semba Citation2009) that combines binary data with a statistical model for circular data. The most probable periodicity of band pair formation (annual, biannual, or no cycle) was selected based on Akaike’s information criterion corrected for small sample size (AICc; Akaike Citation1973).
Hazin et al. (Citation1994) concluded that the parturition period for Blue Sharks in the southwestern equatorial Atlantic Ocean was from September to December. Thus, the birth date of the Blue Sharks was assumed to be November 1. Opaque band deposition was assumed to be restricted to November for annual band pair formation (see Results). Given these two assumptions, the age (years) of each specimen was estimated as
or
where NB is the number of band pairs deposited after the birth mark, and M is the month of capture.
Growth functions
Four growth functions were used to fit the observed length-at-age and length-at-birth (L0) data: the VBGF (Beverton Citation1954), two-parameter VBGF (VBGF2; Fabens Citation1965), Robertson growth function (Robertson Citation1923), and Gompertz growth function (Gompertz Citation1825). The VBGF is described as
where Lt is the length at age t; L∞ is the asymptotic length; k is the Brody growth coefficient; t is age (years after birth); and t0 is the theoretical age at zero length.
The VBGF2 is as follows:
where L0 was set at 45 cm TL (S. J. Joung and coworkers, paper presented at the Shark Working Group Workshop, International Scientific Committee for Tuna and Tuna-Like Species in the North Pacific Ocean, 2011).
The Robertson (logistic) growth function is
where bR and kR are the parameter and growth coefficient, respectively, of the Robertson function.
The Gompertz growth function is described as
where c and kG are the parameter and growth coefficient, respectively, of the Gompertz function.
The Gauss–Newton algorithm in the NLIN procedure within SAS version 9.4 (SAS Institute, Cary, North Carolina) was used in fitting the four growth functions. Goodness of fit was compared among the growth functions on the basis of AICc (Akaike Citation1973), which is expressed as
n is the total sample size, MSE is the mean square error, and K is the number of parameters estimated in the growth function. A chi-square test of maximum likelihood ratios (Kimura Citation1980) was used to examine whether growth functions differed between the sexes.
Theoretical longevity
Theoretical longevity (tmax) was estimated by using the sizes at which 95% and 99% of L∞ were attained following the methods of Taylor (Citation1958) and Fabens (Citation1965), respectively. The equations are
(Taylor Citation1958)
and
(Fabens Citation1965).
RESULTS
Size Range of Specimens
Overall, 44,092 Blue Shark specimens (22,348 males; 21,361 females; and 383 individuals of unknown sex) were caught by Taiwanese longline vessels in the South Atlantic and were collected by onboard scientific observers. The size ranges for the 31,622 specimens collected from the equatorial–tropical area were 44–390 cm FL for males, 40–395 cm FL for females, and 70–310 cm FL for sharks of unknown sex (). Size ranges for the 12,470 Blue Shark specimens sampled from the subtropical–temperate area were 45–346 cm FL for males, 48–350 cm FL for females, and 47–263 cm FL for individuals of unknown sex (). In addition, 337 males (110–310 cm TL), 311 females (100–323 cm TL), and 137 unknown-sex specimens (171–325 cm TL) collected in the eastern South Atlantic were used for age analyses (; ).
FIGURE 3. Length frequency distribution (FL, cm) of Blue Shark specimens captured by Taiwanese longline fleets in two areas of the South Atlantic: (a) the equatorial–tropical area and (b) the subtropical–temperate area (black bars = males; open bars = females; hatched bars = individuals of unknown sex).
FIGURE 4. Length frequency distribution (TL, cm) of Blue Shark specimens that were used for age and growth analyses in this study (black bars = males; open bars = females; hatched bars = individuals of unknown sex).
Spatial and Seasonal Variation in Distribution, Size, and Sex Ratio
The mean size of Blue Sharks captured from the equatorial–tropical area (212 cm FL) was significantly larger than that of individuals sampled from the subtropical–temperate area (189 cm FL). In the equatorial–tropical area, the mean size of females was significantly larger than that of males during every season, especially season 3. In the subtropical–temperate area, females were significantly smaller than males during seasons 2 and 3, but no significant difference was found for the other seasons. Analysis of variance revealed seasonal variations in mean size for Blue Sharks from both areas. For both sexes, mean sizes increased from season 4 and peaked during season 3 in the equatorial–tropical area (). Mean sizes for both sexes in the subtropical–temperate area increased from season 1 to their peak in season 3 and decreased during season 4. There was a slight decreasing trend in mean catch at size from 2004 to 2013 within the equatorial–tropical area, but such a trend was not observed for the subtropical–temperate area (). The sex ratios were significantly less than 0.5 in both areas during every season (0.34–0.47) except for seasons 2 and 3 (0.58 and 0.52) in the equatorial–tropical area and season 2 (0.51) in the subtropical–temperate area. The sex ratio ranged from 0.25 to 0.67 in the equatorial–tropical area and from 0.15 to 0.62 in the subtropical–temperate area. The sex ratio also varied with specimen size, exhibiting an increase with size in the equatorial–tropical area but a decrease with size in the subtropical–temperate area.
FIGURE 5. Seasonal fishing effort and Blue Shark (BSH) size (FL, cm) recorded by Taiwanese observers on longline fishing vessels operating in the South Atlantic from 2004 to 2013 (seasons are defined in Methods). The color scale within grid cells represents fishing effort, with darker blue representing more hooks and lighter blue representing fewer hooks. The size of the red dots indicates the mean FL categorized using 25th percentiles of the data.
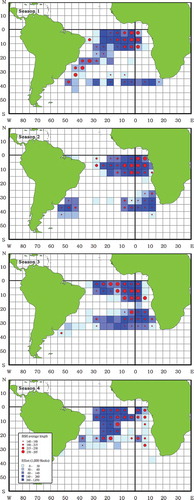
FIGURE 6. Annual mean (±SD) catch at size (FL, cm) for Blue Sharks captured by Taiwanese longline fleets operating in two areas of the South Atlantic from 2004 to 2013: (a) the equatorial–tropical area and (b) the subtropical–temperate area (the number above [females] or below [males] each data point is the sample size).
![FIGURE 6. Annual mean (±SD) catch at size (FL, cm) for Blue Sharks captured by Taiwanese longline fleets operating in two areas of the South Atlantic from 2004 to 2013: (a) the equatorial–tropical area and (b) the subtropical–temperate area (the number above [females] or below [males] each data point is the sample size).](/cms/asset/e82bf86a-3ca5-43d7-b98b-eff1ceb571a3/umcf_a_1249579_f0006_oc.jpg)
Vertebral Sample Measurement
The sex-specific relationship between VR and TL showed a linear trend, and ANCOVA indicated no significant difference between the sexes. The VR–TL relation (both sexes combined) was TL = 0.222 + 258.89 · VR (r = 0.82; n = 785).
Growth Band Pair Formation
In total, 43 vertebrae (5.4%) from Blue Sharks were discarded due to the inconsistency in band pair counts between the readers. Consequently, age and growth were estimated based on vertebral band pair counts for 742 specimens, including 318 males, 295 females, and 129 sharks of unknown sex. The reading bias plot based on 295 vertebral samples indicated high consistency in band pair readings between the readers (). The IAPE was estimated as 3.82%, and the CV was estimated as 4.96%. No band pair deposition was found in embryos before birth, and the first opaque band was assumed to be the birth mark. Up to 15 growth band pairs after the birth mark were counted for both females and males.
FIGURE 7. Age bias plot of vertebral band pair counts for Blue Sharks captured by Taiwanese longline fleets in the South Atlantic (black circles = mean [±2 SE] counts by reader 1 relative to reader 2; the number above each data point is the sample size).
![FIGURE 7. Age bias plot of vertebral band pair counts for Blue Sharks captured by Taiwanese longline fleets in the South Atlantic (black circles = mean [±2 SE] counts by reader 1 relative to reader 2; the number above each data point is the sample size).](/cms/asset/baede9d1-e3df-42e3-a750-4cc16160c7fa/umcf_a_1249579_f0007_b.gif)
The centrum edge analysis indicated that the percentage of opaque bands peaked in November, decreased gradually thereafter, and reached a minimum in May (). This result suggested that each growth band pair on a vertebral centrum was formed once per year and that the opaque band was formed in November (). The statistical analysis of Okamura and Semba (Citation2009) also indicated that a model of 1 band pair per year had the highest support and the smallest AICc value (456.2) compared with the no-cycle (AICc = 505.1) and biannual cycle (AICc = 500.7) models.
TABLE 2. Comparison of von Bertalanffy growth function parameters for Blue Sharks examined in the present study and previous studies (L∞ = asymptotic length; k = Brody growth coefficient; t0 = theoretical age at zero length; tmax = maximum observed age).
FIGURE 8. Results of centrum edge analysis of vertebral centra from Blue Sharks captured by Taiwanese longline fleets in the eastern South Atlantic (black bars = translucent bands; open bars = opaque bands; the number above each bar is the combined-sexes sample size).
Growth Parameters
The maximum likelihood ratio test indicated no difference between the sexes for any of the four growth functions (P > 0.05). Therefore, the age and TL data for 742 specimens (including males, females, and unknown-sex individuals) were combined to estimate the growth parameters. The AICc value was smaller for the VBGF than for the other three functions, which indicated that the VBGF provided the best fit to the observed length-at-age data. The estimated VBGF parameters for Blue Sharks (sexes combined) were as follows: L∞ was 352.1 cm TL, k was 0.13 year–1, and t0 was –1.31 years ().
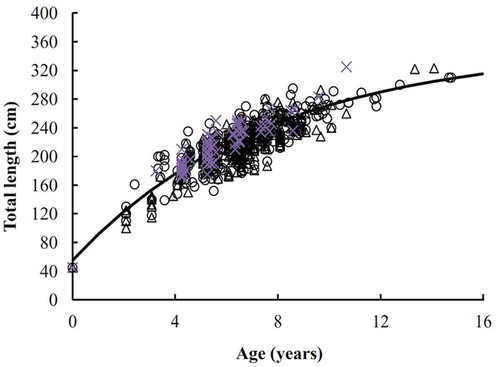
FIGURE 9. The von Bertalanffy growth function (VBGF) fitted to observed TL-at-age data for Blue Sharks captured by Taiwanese longline fleets in the eastern South Atlantic (open circles = males; open triangles = females; ×-symbols = individuals of unknown sex; solid line = VBGF for both sexes combined).
Age at First Maturity and Theoretical Longevity
Hazin and Lessa (Citation2005) reported that size at first maturity was 225 cm TL (corresponding to 6.5 years) for male Blue Sharks and 228 cm TL (corresponding to 6.7 years) for females. The observed maximum age of Blue Shark specimens was 15 years for both males and females. The estimated tmax of Blue Sharks was considerably greater than the observed maximum age: tmax was calculated as 21.4 years (via the method of Taylor Citation1958) and 26.6 years (via the method of Fabens Citation1965).
DISCUSSION
Two hypotheses have been proposed for the migration pattern of Blue Sharks in the South Atlantic (Valeiras and Abad Citation2009). Hazin et al. (Citation1994, Citation2000) proposed a seasonal migration model similar to that for Blue Sharks in the North Atlantic, with a clockwise reproductive migration. Those authors suggested that Blue Shark copulation occurs in the southeast to southern region of Brazil, fertilization occurs in the northeastern region, parturition occurs in the high latitudes, and the nursery area is likely located close to the African coast. In contrast, Amorim (Citation1992) and Domingo et al. (Citation2008) proposed that copulation, fertilization, gestation, and parturition in Blue Sharks all occur in the southwestern region of the South Atlantic (20–42°S, 20–55°W). Because only a few small individuals (<60 cm FL) were recorded in this study, the area where parturition takes place could not be identified. The lack of small Blue Sharks may be due to characteristics of the Taiwanese longline fleets, including gear selectivity and the practice of discarding undersized fish. Two types of Taiwanese longline fleet operate in the South Atlantic. The fleet that targets tropical tunas (e.g., Bigeye Tuna or Yellowfin Tuna Thunnus albacares) operates in equatorial–tropical waters and uses a deep set of 15 or more hooks per basket, whereas the fleet that targets Albacore operates in subtropical–temperate waters and uses a shallow set of fewer than 12 hooks per basket. Another possibility is that the fishing areas did not include the coastal and high-latitude waters, which might be the nursery grounds used by Blue Sharks. We observed a seasonal distribution pattern for Blue Sharks in the South Atlantic; the seasonal change in their location was likely related to a change in the fishing pattern rather than a distributional variation in Blue Sharks, as the Taiwanese Albacore longline fleet moved to lower latitudes when targeting Albacore during seasons 2 and 3 (). Therefore, we cannot reject either hypothesis describing Blue Shark migration patterns, and more tagging studies are needed to evaluate the two hypotheses.
Sex-specific segregation in the South Atlantic distribution of Blue Sharks has been documented (Hazin and Lessa Citation2005; Valeiras and Abad Citation2009). However, sex segregation between areas was not observed in our study because males were overwhelmingly more abundant than females in both areas and during all seasons except seasons 2 and 3 in the equatorial–tropical area. Hazin et al. (Citation1994) and Hazin and Lessa (Citation2005) documented that female Blue Sharks were segregated from males in equatorial–tropical waters from April to June, when fertilization and early development of their embryos occurred. Females in early pregnancy were found from northeastern Brazil to the Gulf of Guinea during June–August (Castro and Mejuto Citation1995). These findings may explain why large females were predominant in the catch from the equatorial–tropical area during seasons 2 and 3. Fitzpatrick (Citation2012) concluded that Blue Sharks have a high incidence of polyandry (80%) based on microsatellite DNA analyses of litters, suggesting that one adult female may mate with several adult males. Both females and males can mate several times during the mating season. However, no information is available on the mating times for both sexes. Hazin et al. (Citation1994) reported that in the tropical western South Atlantic, many adult males lacked sperm packs and were in a sexually resting phase. Thus, the sex ratio of adult Blue Sharks may be biased toward males during the mating season. Our observation of a low sex ratio (proportion female = 0.35) for large Blue Sharks (>218 cm FL) during season 1 in the subtropical–temperate area implied the occurrence of mating. However, more information will be necessary to verify this finding.
The Blue Shark specimens used in age estimates covered a wide range of sizes for this species (100–325 cm TL), but individuals between 45 cm TL (i.e., the size at birth; Joung and coworkers, working paper) and 100 cm TL were rarely captured by the longline fishery. Blue Sharks were caught by the Taiwanese longline fleet throughout the South Atlantic (); therefore, the fishing areas and size-specific gear selectivity may be potential factors. Blue Sharks that were sampled in the equatorial–tropical area were the bycatch of Taiwanese Bigeye Tuna longline vessels operating in deeper water (mean hook depth = 200–300 m), whereas individuals from subtropical–temperate waters (15–40°S) were the bycatch of longline vessels targeting Albacore in shallower water (mean hook depth < 150 m; Tsai and Liu Citation2015). Coelho et al. (Citation2015) indicated that large Blue Sharks were primarily found in tropical waters but that small individuals were mainly distributed in high-latitude waters of the North and South Atlantic. Similar distribution patterns were also observed in the present study. This distribution pattern and reduced fishing effort in the high latitudes might explain why small individuals were rarely collected from the study area. In terms of the annual variation in mean size, the large fluctuation that occurred during 2004 and 2005 in the subtropical–temperate area was due to the small number of observations obtained during the early years of the observer program.
The lack of very young specimens may have resulted in an overestimation of L∞, but our estimate (352.1 cm TL) using the VBGF was 1.08-fold of the maximum observed size (325 cm TL) from the age analysis. Although a few specimens with sizes greater than L∞ were recorded (n = 22; 0.05%) and a maximum length of 395 cm FL was reported in the catch-at-size data, we believe that our estimate based on data available from the age and growth analysis is biologically realistic. To improve the accuracy of parameter estimation, future work should particularly focus on the collection of younger (TL < 100 cm) and older (TL > 320 cm) specimens than were sampled here.
Lessa et al. (Citation2004) demonstrated that there was no significant difference between linear and multiplicative FL–VR relationships; the linear model (r = 0.875) was chosen because of its simplicity. We found a similar relationship and an r-value of 0.82, suggesting that our estimate of the TL–VR relationship for Blue Sharks was reasonable. Simple linear models for the TL–VR relationship were also reported for Dusky Sharks Carcharhinus obscurus (Joung et al. Citation2015) and Whale Sharks Rhincodon typus (Hsu et al. Citation2014).
The birth mark has been reported for many elasmobranch species (e.g., Dusky Shark: Joung et al. Citation2015; Silky Shark Carcharhinus falciformis: Joung et al. Citation2008; Whale Shark: Hsu et al. Citation2014; and Sharpspine Skate Okamejei acutispina: Joung et al. Citation2011). However, Wang and Chen (Citation1982) and Joung et al. (Citation2016) concluded that no birth mark existed for the Spotless Smoothhound Mustelus griseus and the Kwangtung Skate Dipturus kwangtungensis, respectively. Skomal and Natanson (Citation2003) concluded that the first opaque band on the vertebra was the birth mark for Blue Sharks in the North Atlantic; a similar finding was obtained for vertebral centra from Blue Sharks in this study. Huang (Citation2006) documented that (1) the vertebral radii of full-term embryos (30.5–44.6 cm TL) were smaller than the mean radius of the first growth band pair and (2) no band pair was present in those embryos. Their observations suggested that the birth mark was formed after birth. We substituted the mean radius at the birth mark into the TL–VR relationship and obtained a value similar to the size at birth, which indicates that our birth mark assumption was reasonable.
Cailliet et al. (Citation2006) and Goldman et al. (Citation2012) noted that both marginal increment analysis and edge analysis can be used to provide valuable corroborative evidence for the periodicity of band formation. In the present study, only edge analysis was used to verify the periodicity of band pair formation. Our analysis suggested that a single growth band pair was formed each year. The results derived from the statistical model of Okamura and Semba (Citation2009) further supported our results. Annual deposition of growth band pairs has been reported by researchers studying Blue Sharks in other locations, including the western South Atlantic (Lessa et al. Citation2004), the North Atlantic (Stevens Citation1975; Skomal and Natanson Citation2003), the South Pacific (Blanco-Parra et al. Citation2008; H. H. Hsu and coworkers, paper presented at the Shark Working Group Workshop, International Scientific Committee for Tuna and Tuna-Like Species in the North Pacific Ocean, 2012), and the North Pacific (Cailliet et al. Citation1983; Tanaka et al. Citation1990; Nakano Citation1994; H. H. Hsu and coworkers, paper presented at the Shark Working Group Workshop, International Scientific Committee for Tuna and Tuna-Like Species in the North Pacific Ocean, 2011). Lessa et al. (Citation2004) concluded that the growth band in Blue Sharks from Brazilian waters was formed between November and January. Similar results were found in this study, as translucent and opaque bands were formed in May and November, respectively, implying that Blue Sharks in the eastern and western portions of the South Atlantic are from the same stock. However, tagging studies and DNA analyses are needed to test this hypothesis. Skomal and Natanson (Citation2003) found that the growth band pair on the vertebral centrum of Blue Sharks in the northwest Atlantic was formed during the winter and spring, when the sharks exhibited depressed growth due to the expenditure of energy stores while undertaking migration. Whether opaque band formation in Blue Sharks in the eastern South Atlantic has a similar mechanism requires further study.
The IAPE and CV of the vertebral band counts were estimated as 3.82% and 4.96%, respectively, which were lower than the criteria of 5.5% and 7.6% suggested by Campana (Citation2001). In addition, the age bias plot showed that counts from the two readers were very consistent, indicating that band pair counting in our study was reliable.
The estimated L∞ of males was larger than that of females in all Blue Shark studies in the Pacific (), but a similar finding was not observed for Blue Sharks in the Atlantic (). The k-value for Blue Sharks was greater than 0.1/year in all reports, suggesting that this species grows faster than most other large sharks. The higher fecundity (litter size = 29–56; Compagno Citation1984; Joung and coworkers, working paper) and faster growth rate of Blue Sharks relative to most other pelagic sharks might explain why Blue Sharks outnumber other shark species in the seas.
Our growth parameter estimates for Blue Sharks (both sexes combined) in the eastern South Atlantic were comparable to those for Blue Sharks in northeastern Brazilian waters, but the L∞ was smaller than values for the combined sexes in the northeastern Atlantic (Henderson et al. Citation2001) and for females in the North Atlantic (Skomal and Natanson Citation2003; ). However, the mean length at age derived from this study was lower than most values from previous studies of Blue Sharks in the Atlantic (). Our study predicted that up to age 5, Blue Sharks in the eastern South Atlantic were similar in size to those in the northeastern Atlantic (Henderson et al. Citation2001) and North Atlantic (Stevens Citation1975) but were smaller than those in other studies. This suggests that Blue Sharks in the eastern South Atlantic have a slower growth rate than those in the western South Atlantic or the North Atlantic. Such a finding may be due to the difference in water temperature, as temperature plays an important role in determining the growth rates of sharks (Simpfendorfer et al. Citation2002). The specimens used for age estimates in our study were mainly from equatorial–tropical waters (0–15°S) and from temperate waters (30–40°S), whereas the specimens examined by Lessa et al. (Citation2004) were collected from tropical waters (0–10°S).
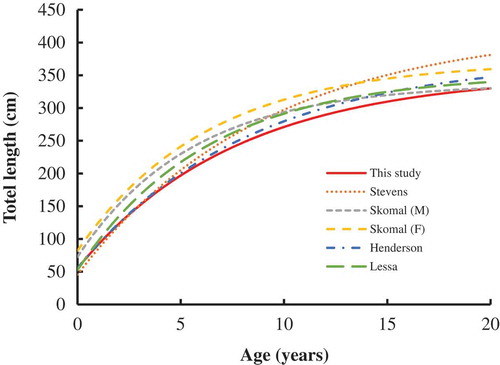
FIGURE 10. Comparison of growth curves (TL at age) for Blue Sharks (M = males; F = females) sampled in the Atlantic Ocean during the present study and in previous studies (Stevens Citation1975; Henderson et al. Citation2001; Skomal and Natanson Citation2003; Lessa et al. Citation2004).
The age and growth analysis was based on a large sample size and a broad range of specimen sizes (n = 785; 100–325 cm TL); therefore, we believe that our results accurately depict the age and growth of Blue Sharks in the eastern South Atlantic. In addition, we analyzed samples that were obtained in every month, suggesting that our results are robust. A recent ICCAT stock assessment for the Blue Shark (ICCAT Citation2015) concluded that due to high uncertainty, the possibility of overfishing or having been overfished cannot be ruled out and that rigorous monitoring is needed to ensure the sustainable exploitation of Blue Sharks in the South Atlantic. Our results provide useful information on the age and growth of Blue Sharks and can reduce the uncertainty in life history parameters to be used in future stock assessments.
ACKNOWLEDGMENTS
We appreciate two anonymous reviewers for their constructive comments, which greatly improved this manuscript. Financial support for the study was provided by the Fisheries Agency, Council of Agriculture, Taiwan, Republic of China (Grant Numbers FA101-2313-B-019-032 and FA102-2313-B-019-048).
REFERENCES
- Aasen, O. 1966. Blahaien Prionace glauca (Linnaeus). Fisken Havet 1:1–15.
- Akaike, H. 1973. Information theory and an extension of the maximum likelihood principle. Pages 267–281 in B. N. Petrov and F. Csaki, editors. Second international symposium on information theory. Akademiai Kiado, Budapest, Hungary.
- Amorim, A. F. 1992. Estudo da biologia da pesca e reprodução do cação azul Prionace glauca, capturado no sudeste e sul do Brasil. [Study of the fishery biology and reproduction of the Blue Shark Prionace glauca caught in southeastern and southern Brazil.] Doctoral dissertation. Universidade Estadual Paulista, Rio Claro, São Paulo, Brazil.
- Beamish, R. J., and D. A. Fournier. 1981. A method for comparing the precision of a set of age determinations. Canadian Journal of Fisheries and Aquatic Sciences 38:928–983.
- Beverton, R. J. H. 1954. Notes on the use of theoretical models in the study of the dynamics of exploited fish populations. U.S. Fishery Laboratory, Miscellaneous Contribution 2, Beaufort, North Carolina.
- Blanco-Parra, M. P., F. Galván-Magaña, and F. Márquez-Farías. 2008. Age and growth of the Blue Shark, Prionace glauca Linnaeus, 1758, in the northwest coast off Mexico. Reviews in Marine Biology and Oceanography 43:513–520.
- Cailliet, G. M., and D. W. Bedford. 1983. The biology of three pelagic sharks from California waters, and their emerging fisheries: a review. CalCOFI (California Cooperative Oceanic Fisheries Investigations) Reports 24:57–69.
- Cailliet, G. M., L. K. Martin, J. T. Harvey, D. Kusher, and B. A. Welden. 1983. Preliminary studies on the age and growth of Blue, Prionace glauca, Common Thresher, Alopias vulpinus, and Shortfin Mako, Isurus oxyrinchus, sharks from California waters. NOAA Technical Report NMFS-8.
- Cailliet, G. M., W. D. Smith, H. F. Mollet, and K. J. Goldman. 2006. Age and growth studies of chondrichthyan fishes: the need for consistency in terminology, verification, validation, and growth function fitting. Environmental Biology of Fishes 77:211–228.
- Campana, S. E. 2001. Accuracy, precision, and quality control in age determination, including a review of the use and abuse of age validation methods. Journal of Fish Biology 59:197–242.
- Carvalho, F., R. Ahrens, D. Murie, K. Bigelow, A. Aires-Da-Silva, M. N. Maunder, and F. Hazin. 2015. Using pop-up satellite archival tags to inform selectivity in fisheries stock assessment models: a case study for the Blue Shark in the South Atlantic Ocean. ICES Journal of Marine Science 72:1715–1730.
- Castro, J. A., and J. Mejuto. 1995. Reproduction parameters of Blue Shark, Prionace glauca, and other sharks in the Gulf of Guinea. Marine and Freshwater Research 46:967–973.
- Chang, W. Y. B. 1982. A statistical method for evaluating the reproducibility of age determination. Canadian Journal of Fisheries and Aquatic Sciences 39:1208–1210.
- Coelho, R., J. Mejuto, A. Domingo, K. M. Liu, E. Cortés, K. Yokawa, F. Hazin, F. Arocha, C. da Silva, B. García-Cortés, A. M. Ramos-Cartelle, P. Lino, R. Forselledo, S. Ohshimo, F. Carvalho, and M. N. Santos. 2015. Distribution pattern of the Blue Shark Prionace glauca in the Atlantic Ocean from observer data of the major fishing fleets. International Commission for the Conservation of Atlantic Tunas, SCRS/2015/039, Madrid.
- Compagno, L. J. V. 1984. FAO species catalogue volume 4: sharks of the world, an annotated and illustrated catalogue of shark species known to date. FAO Fisheries Synopsis 125:251–655.
- Domingo, A., A. Amorim, P. Miller, C. Arfelli, R. Forselledo, M. Ríos, and F. Y. Doño. 2008. Aspectos del ciclo reproductivo y estructura de la población del tiburón azul (Prionace glauca) en el océano Atlántico Sur. [Aspects of the reproductive cycle and population structure of the Blue Shark (Prionace glauca) in the South Atlantic Ocean.] International Commission for the Conservation of Atlantic Tunas, SCRS/2008/144, Madrid.
- Fabens, A. J. 1965. Properties and fitting of the von Bertalanffy growth curve. Growth 29:265–289.
- Fitzpatrick, S. F. 2012. Global population genetic structure of the pelagic Blue Shark (Prionace glauca). Doctoral dissertation. Queen’s University, Belfast, UK.
- Goldman, K. J., G. M. Cailliet, A. H. Andrews, and L. J. Natanson. 2012. Assessing the age and growth of chondrichthyan fishes. Pages 423–451 in J. C. Carrier, J. A. Musick, and M. R. Heithaus, editors. Biology of sharks and their relatives, 2nd edition. CRC Press, New York.
- Gompertz, B. 1825. On the nature of the function expressive of the law of human mortality and on a new mode of determining life contingencies. Philosophical Transactions of the Royal Society of London Series A 115:513–585.
- Hazin, F., and R. Lessa. 2005. Synopsis of biological information available on Blue Shark, Prionace glauca, from the southwestern Atlantic Ocean. ICCAT (International Commission for the Conservation of Atlantic Tunas) Collective Volume of Scientific Papers 58:1179–1187.
- Hazin, F. H. V., K. Kihara, K. Otsuka, C. E. Boeckman, and C. E. Leal. 1994. Reproduction of the Blue Shark Prionace glauca in the southwestern equatorial Atlantic Ocean. Fisheries Science 60:487–491.
- Hazin, F. H. V., P. B. Pinheiro, and M. K. Broadhurst. 2000. Further notes on reproduction of the Blue Shark, Prionace glauca, and a postulated migratory pattern in the South Atlantic Ocean. Ciência e Cultura 52:114–120.
- Henderson, A. C., K. Flannery, and J. Dunne. 2001. Observations on the biology and ecology of the Blue Shark in the northeast Atlantic. Journal of Fish Biology 58:1347–1358.
- Hsu, H. H., S. J. Joung, R. Hueter, and K. M. Liu. 2014. Age and growth of the Whale Shark Rhincodon typus in the northwestern Pacific. Marine and Freshwater Research 65:1145–1154.
- Huang, C. C. 2006. Age and growth of the Blue Shark, Prionace glauca, in the northwestern Pacific Ocean. Master’s thesis. National Taiwan Ocean University, Keelung, Taiwan. (In Chinese.)
- Huang, H. W., and K. M. Liu. 2010. Bycatch and discards by Taiwanese large-scale tuna longline fleets in the Indian Ocean. Fisheries Research 106:261–270.
- ICCAT (International Commission for the Conservation of Atlantic Tunas). 2015. Report of the 2015 ICCAT Blue Shark stock assessment session. ICCAT, Madrid.
- Joung, S. J., C. C. Chen, K. M. Liu, and T. C. Hsieh. 2016. Age and growth estimate of the Kwangtung Skate Dipturus kwangtungensis in the northern waters off Taiwan. Journal of the Marine Biological Association of the UK 96:1395–1402.
- Joung, S. J., C. T. Chen, H. H. Lee, and K. M. Liu. 2008. Age, growth, and reproduction of the Silky Sharks Carcharhinus falciformis in northeastern Taiwan waters. Fisheries Research 90:78–85.
- Joung, S. J., J. H. Chen, C. P. Chin, and K. M. Liu. 2015. Age and growth of the Dusky Shark, Carcharhinus obscurus, in the northwest Pacific Ocean. Transactions of the American Fisheries Society 26:153–160.
- Joung, S. J., P. H. Lee, K. M. Liu, and Y. Y. Liao. 2011. Estimates of life history parameters of the Sharpspine Skate, Okamejei acutispina in northeastern Taiwan waters. Fisheries Research 108:258–267.
- Joung, S. J., Y. Y. Liao, and C. T. Chen. 2004. Age and growth of Sandbar Shark, Carcharhinus plumbeus, in northeastern Taiwan waters. Fisheries Research 70:83–96.
- Joung, S. J., Y. Y. Liao, K. M. Liu, C. T. Chen, and L. C. Leu. 2005a. Age, growth, and reproduction of the Spinner Shark, Carcharhinus brevipinna, in the northeastern waters of Taiwan. Zoological Studies 44:102–110.
- Joung, S. J., K. M. Liu, Y. Y. Liao, and H. H. Hsu. 2005b. Observed by-catch of Taiwanese tuna longline fishery in the South Atlantic Ocean. Journal of the Fisheries Society of Taiwan 32:69–77.
- Kimura, D. K. 1980. Likelihood methods for the von Bertalanffy growth curve. U.S. National Marine Fisheries Service Fishery Bulletin 77:765–776.
- Lessa, R., F. M. Santana, and F. H. Hazin. 2004. Age and growth of the Blue Shark, Prionace glauca (Linnaeus, 1758), off northeastern Brazil. Fisheries Research 66:19–30.
- Mejuto, J., and B. García-Cortés. 2005. Reproductive and distribution parameters of the Blue Shark Prionace glauca, on the basis of on-board observations at sea in the Atlantic, Indian and Pacific oceans. ICCAT (International Commission for the Conservation of Atlantic Tunas) Collective Volume of Scientific Papers 58:951–973.
- Nakano, H. 1994. Age, reproduction and migration of Blue Shark in the North Pacific Ocean. Bulletin of the National Research Institute of Far Seas Fisheries 31:141–219.
- Nakano, H., and J. D. Stevens. 2008. The biology and ecology of the Blue Shark, Prionace glauca. Pages 140–151 in M. D. Camhi, E. K. Pikitch, and E. A. Babcock, editors. Sharks of the open ocean: biology, fisheries, and conservation. Blackwell Publishing, Oxford, UK.
- Okamura, H., and Y. Semba. 2009. A novel statistical method for validating the periodicity of vertebral band formation in elasmobranch fishes. Canadian Journal of Fisheries and Aquatic Sciences 66:771–780.
- Pratt, H. W. 1979. Reproduction in the Blue Shark, Prionace glauca. U.S. National Marine Fisheries Service Fishery Bulletin 77:445–470.
- Robertson, T. B. 1923. The chemical basis of growth and senescence. J. B. Lippincott, Philadelphia.
- Simpfendorfer, C. A., R. B. McAuley, J. Chidlow, and P. Unsworth. 2002. Validated age and growth of the Dusky Shark, Carcharhinus obscurus, from western Australian waters. Marine and Freshwater Research 53:567–573.
- Skomal, G. B., and L. J. Natanson. 2003. Age and growth of the Blue Shark, Prionace glauca, in the North Atlantic Ocean. U.S. National Marine Fisheries Service Fishery Bulletin 101:627–639.
- Stevens, J. D. 1975. Vertebral rings as a means of age determination in the Blue Shark (Prionace glauca, L.). Journal of the Marine Biological Association of the UK 55:657–665.
- Tanaka, S., G. M. Cailliet, and K. G. Yudin. 1990. Differences in growth of the Blue Shark, Prionace glauca: technique or population? NOAA Technical Report 90:177–187.
- Taylor, C. C. 1958. Cod growth and temperature. Journal du Conseil International pour l’Exploration de la Mer 23:366–370.
- Tsai, W. P., and K. M. Liu. 2015. Updated and revised catch rates of Blue Sharks caught by the Taiwanese longline fishery in the Atlantic Ocean. International Commission for the Conservation of Atlantic Tunas, SCRS/2015/132, Madrid.
- Tsai, W. P., and K. M. Liu. 2016. Updated and revised standardized catch rate of Blue Sharks caught by the Taiwanese longline fishery in the Atlantic Ocean. ICCAT (International Commission for the Conservation of Atlantic Tunas) Collective Volume of Scientific Papers 72:1134–1149.
- Tsai, W. P., C. L. Sun, K. M. Liu, S. B. Wang, and N. C. H. Lo. 2015. CPUE standardization and catch estimate of the Blue Shark by Taiwanese large-scale tuna longline fishery in the North Pacific Ocean. Journal of Marine Science and Technology 23:567–574.
- Valeiras, J., and E. Abad. 2009. Blue Shark. Pages 261–272 in ICCAT manual. International Commission for the Conservation of Atlantic Tunas, Madrid, Spain.
- Wang, T. M., and C. T. Chen. 1982. Age and growth of the Smooth Dogfish, Mustelus griseus, in northwestern Taiwan waters. Journal of the Fisheries Society of Taiwan 9:1–12. ( In Chinese.)