ABSTRACT
The purpose of the proposed research report is to develop a standard protocol and harmonize the procedures for in silico dosimetric profiling of human nasal inhaled nanparticles. Polystyrene nanoparticles with diameters ranging from 10 nm to 100 nm were used as demo cases, deposition fraction vs. airway generation number, deposition fraction vs. particle diameter, and regional deposition fractions were plotted respectively as the dosimetric profile of human nasal inhaled nanoparticles.
As a high throughput scheme, the method could be suitably applied to the domain of inhalation toxicology characterization and risk assessment of human nasal inhaled nanoparticles thereof.
INTRODUCTION
Accompanied by the rapid advancement of nanotechnology, nanosafety is becoming the hot spot of global community. Inhaled toxicity, which was a core endpoint of nanosafety, was a highly concerned subject of occupational hygiene, therefore, it is of utmost importance to profile inhaled toxicology of nanoparticles.
In addition, with respect to animal health and animal welfare, traditional animal experiment–based toxicology will be phased out in the coming 10 years or so, as evidenced by the articles issued in EU REACH or 76/768/EEC cosmetic directives. Nowadays, with respect to toxicity, nanomaterials were deemed as new chemicals, and alternative toxicology data were preferable whenever and wherever available, as it will demonstrate undoubtedly the distinct toxicological properties of nanoparticles compared to its bulk counterparts.
In silico method, which was originated from silicon chip, is a computational predictive toxicological profiling scheme, and is a potential alternative method for high-throughput toxicological evaluation. The computer algorithms, which are based upon single-path or multiple-path methods for tracking airflow and calculating nanoparticle aerosol deposition in the lung, calculate the deposition of nanoparticle aerosols in the respiratory tract of human adults. In order to calculate nanoparticle deposition in all airways of the lung and provides lobar-specific and airway-specific information, multiple-path method should be used.[ Citation 1 ] Within each airway, deposition is calculated using theoretically derived efficiencies for deposition by diffusion, sedimentation, and impaction within the airway or airway bifurcation.[ Citation 2 ]
A multiple-path particle dosimetry model was suggested herein to perform in silico dosimetric profiling for human nasal inhaled nanoparticles, Polystyrene nanoparticles with diameters ranging from 10 to 100 nm were used as demo cases, deposition fraction versus airway generation number, deposition fraction versus particle diameter, and regional deposition fractions were plotted, respectively, as the dosimetric profile of human nasal inhaled nanoparticles.
DESCRIPTION OF TERMS
For the purpose of this draft standard, this section provides a brief description of terms used by this method.
| • | In silico: Computational predictive toxicological profiling method. | ||||
| • | Nanoparticles: Particles with at least one dimension less than 100 nm. | ||||
| • | Deposition fraction: Fraction of nanoparticles deposited on the airway after nasal inhaled. | ||||
SOFTWARE INFORMATION
Multiple-path particle dosimetry model software (MPPD ver. 2.0) were developed by the CIIT Centers for Health Research (CIIT), USA, in collaboration with the National Institute of Public Health and the Environment (RIVM), the Netherlands, and the Ministry of Housing, Spatial Planning, and the Environment, The Netherlands.
A collaboration with the Chinese Academy of Inspection and Quarantine was established to codevelop the International Organization for Standardization (ISO) standard.
PROCEDURES, APPARATUS, AND MEASUREMENT PARAMETERS
| 1. | Software installation. | ||||
| 2. | Run the software. From the File menu, select new session. From the Input Data menu, select Airway Morphometry. Choose Human for the species. For the human, either the symmetric model or an asymmetric lobar model may be chosen.[ Citation 3 ] Choose the asymmetric lobar model, “Yeh-Schum 5-lobe.” Use default values for the functional residual capacity (FRC) (3300 mL) and the volume of the upper respiratory tract (URT) (50 mL), Select OK. | ||||
| 3. | From the Input Data menu, select Particle Properties and enter a value for the density of the particle. Polystyrene nanoparticle density of 1.05 g/cm3 was used. The nanoparticle aerosol is assumed to consist of particles of the same density. Specified the Count Median Diameter (CMD). In the Diameter text box, enter a value ranging from 10 to 100 nm for the diameter. The inhalability adjustment value was left default (turned off). Note: For a monodisperse aerosol, the CMD is equal to the mass median diameter (MMD). Type in 1.0 for the value of the geometric standard deviation (GSD) (sigma_g). Select OK. | ||||
| 4. | From the Input Data menu, select Exposure Conditions next and choose Constant Exposure. Enter 5.0 μg/cm3 for the particle aerosol concentration, 12 per minute for the breathing frequency, 625 mL for tidal volume, 0.5 for inhalation fraction, and 0 for pause fraction. Choose the breathing scenario nasal. And choose the Deposition Only, Select OK. | ||||
| 5. | From the Calculations menu, select Accept Settings and then Run. A Dialog box with the remark “Calculations completed” will appear when the calculation is finished. On a DELL optiplex 755 workstation with Intel core Duo CPU E8200 2.66GHZ Pentium processor, the execution time is less than 0.1 s. | ||||
| 6. | Viewing results: To create a text version of the results, select Create from the Report menu. This option allows the user to save results as an ASCII file. To view the file, close this box and select View within the Report menu. The saved ASCII file may be viewed with any text editor (e.g., Microsoft [MS] Notepad). | ||||
| 7. | Plot results: Copy the data of aforementioned ASCII file, choose the right category, and paste it to MS Excel, use MS Excel to plot results. Deposition fraction versus nanoparticle diameter, deposition fraction versus generation number, and lung regional deposition fraction charts can be made this way. | ||||
RESULTS
In silico dosimetric profiling of human nasal inhaled nanoparticles using polystyrene nanoparticles was performed based on the aforementioned protocol, deposition fractions with different nanoparticle sizes and airway generation numbers were computed based on the aforementioned protocol, and the results are shown in Figures – and –.
FIGURE 1 Deposition fraction versus nanoparticle diameter. (Figure provided in color online.)
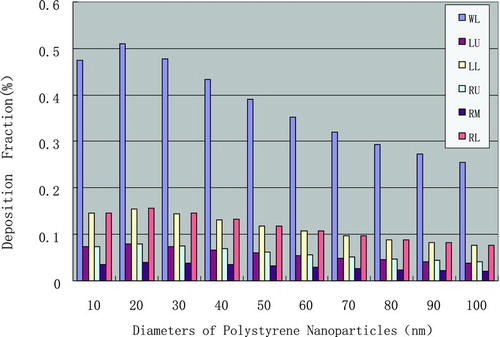
FIGURE 2 Deposition fraction (y-axis) versus airway number (x-axis). (Figure provided in color online.)
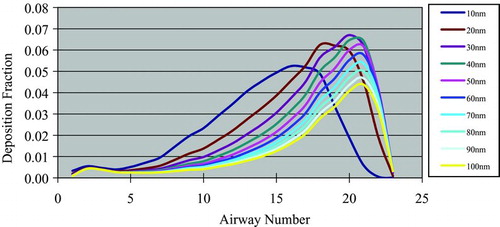
FIGURE 3 Regional deposition fraction diagram. (Figure provided in color online.)
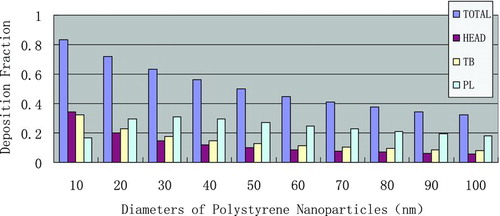
TABLE 1 Site deposition diagram
TABLE 2 Airway deposition diagram
TABLE 3 Regional deposition diagram
CONCLUSION
For 60-nm polystyrene nanoparticles, the deposition fraction in lower left lung and lower right lung are nearly identical and higher than upper left and upper right lung, respectively; the deposition at middle lung shows the smallest fraction. For 20-nm polystyrene nanoparticles, similar phenomena were documented, but they have larger deposition fraction than other nanoparticle counterparts; the largest regional deposition fraction was found for 10-nm polystyrene nanoparticles.
Depositions were larger when airway generation numbers were greater than 15, where most inhaled nanoparticles were deposited at bronchioles and alveolis.
Deposition fraction denotes the mechanism of nasal inhaled sedimentary of nanoparticles, the less the diameter, the more deposition the nanoparticles, especially at tracheobroncial area. Combined with the clearance mechanism of the head, the lung alveolar, and the tracheobroncial, the data could be suitably applied to the quantitative risk assessment for inhaled nanoparticles, and risk management for occupational hygiene thereof.
REFERENCES
- Raabe , O. G. , Yeh , H. C. , Newton , G. J. , Phalen , R. F. and Velasquez , D. J. 1975 . “ Deposition of inhaled monodisperse aerosols in small rodents ” . In Inhaled Particles IV , Edited by: Walton , W. H. 3 – 21 . Oxford, New York : Pergamom Press .
- Heyder , J. , Gebhart , L. , Rudolf , G. , Schiller , C. and Stahlhofen , W. 1986 . Deposition of particles in the human respiratory tract in the size range 0.005–15 μ m . J. Aerosol. Sci. , 17 : 811 – 825 .
- Menache , M. G. , Miller , F. J. and Raabe , O. G. 1995 . Particle inhalability curves for humans and small laboratory animals . Ann. Occup. Hyg. , 39 : 317 – 328 .