
ABSTRACT
Antidiabetic drug metformin alters the gut microbiome composition in the context of type 2 diabetes and other diseases; however, its effects have been mainly studied using fecal samples, which offer limited information about the intestinal site-specific effects of this drug. Our study aimed to characterize the spatial variation of the gut microbiome in response to metformin treatment by using a high-fat diet-induced type 2 diabetes mouse model of both sexes. Four intestinal parts, each at the luminal and mucosal layer level, were analyzed in this study by performing 16S rRNA sequencing covering six variable regions (V1-V6) of the gene and thus allowing to obtain in-depth information about the microbiome composition. We identified significant differences in gut microbiome diversity in each of the intestinal parts regarding the alpha and beta diversities. Metformin treatment altered the abundance of different genera in all studied intestinal sites, with the most pronounced effect in the small intestine, where Lactococcus increased remarkably. The abundance of Lactobacillus was substantially lower in male mice compared to female mice in all locations, in addition to an enrichment of opportunistic pathogens. Diet type and intestinal layer had significant effects on microbiome composition at each of the sites studied. We observed a different effect of metformin treatment on the analyzed subsets, indicating the multiple dimensions of metformin’s effect on the gut microbiome.
Introduction
Despite being widely studied, metformin is an antidiabetic drug with a still debated molecular action mechanism. Many studies have shown that its action is at least partially effectuated via the gut microbiome.Citation1–3 Gut microbiome composition and density vary along the gastrointestinal tract longitudinally and cross-sectionally.Citation4 Components contributing to this diversity include nutrient availability, chemical gradients, oxygen levels, mucosal structure, the diameter of the lumen, and cellular composition.Citation5
The gut microbiome is dominated by four phyla – Bacteroidetes (Gram-negative, anaerobic), Firmicutes (Gram-positive, anaerobic or obligate or facultatively aerobic), Actinobacteria (Gram-positive, anaerobic), and Proteobacteria (Gram-negative, aerobic or facultative anaerobic) in both mice and humans.Citation6,Citation7 The functional niche for each of these phyla is different as Bacteroidetes mainly produces acetate and propionate, but Firmicutes – butyrate.Citation8
Functional differences between distinct regions of the gut correspond to the distribution of the microbial genera with respect to both identity and abundance. Studies in mice, piglets, and humans have shown that the proximal part of the small intestine – duodenum-jejunum, which is characterized by faster transit and facilitation of simple sugar and amino acid metabolism, is dominated by facultative anaerobes Lactobacillus, Proteobacteria, and obligate anaerobes Bacteroides, distal small intestine – ileum by Fusobacterium and Escherichia and the cecum and colon where the passage is slower and metabolism advantages fermentation of complex polysaccharides arising from undigested fibers or host mucus is prevailed by saccharolytic Bacteroidales, Clostridiales, and Prevotella.Citation4,Citation9,Citation10
In healthy mice, Lactobacillaceae dominates the stomach and small intestine, while in the large intestine, the most abundant families are Bacteroidaceae, Prevotellaceae, Rikenellaceae, Lachnospiraceae, and Ruminococcaceae.Citation11 In the cecum of high-fat diet (HFD)-fed mice, the higher abundance of Lachnospiraceae, Blautia, and Oscillibacter, among others, has been shown; in addition, the colon and feces of HFD-fed mice are enriched in Bacteroides and Proteobacteria compared to control diet (CD)-fed ones.Citation12,Citation13
Microbial communities differ on the transverse axis as well. Bacteria associated with the gut mucosa remain located at the same place; thus, these depend on the available substrate, whereas bacteria in the gut lumen can freely associate with various substrates. The mucosa is inhabited by aerotolerant taxa such as Proteobacteria and Actinobacteria, Clostridium, Lactobacillus, Enterococcus, and Akkermansia, while other bacteria predominate toward the lumen – Bacteroides, Bifidobacterium, Streptococcus, Enterobacteriaceae, and Ruminoccoccus among others.Citation4,Citation14 The mucosa-associated microbiota varies in different intestinal parts. Although fecal samples representing luminal content can provide information on global microbiota composition to a certain extent, research on mucosa-associated microbial communities can provide critical information on the interaction between gut microbiota and host.Citation15
Absorption of metformin has been shown to vary between different intestinal sites, with the most prominent absorption occurring in the proximal small intestine.Citation16 Half of the administered dose reaches the distal small intestine, accumulating in the mucosal layer, and 30% of the dose is eliminated in the feces.Citation17 Due to various absorption rates in different parts of the gastrointestinal tract, it can be expected that the metformin’s effect on microbiome composition and the abundance of different microorganisms is not uniform. Furthermore, metformin accumulates in mucosal tissue,Citation18 thus the exposition time and presumably the effect on resident bacteria differ in various sites. These differences necessitate an in-depth analysis of the effect of metformin treatment on the gut microbiome composition at various gastrointestinal locations and layers.
The effect of metformin treatment has mainly been studied in cecal and fecal samples only, providing only limited information about the various aspects of the interaction between the gut microbiome and metformin. Short-term effects of metformin have been shown in different parts of the small intestine in the luminal layer in a recent study.Citation19 Our study adds information about the long-term effects of metformin therapy on different intestinal segments, not only in the luminal layer but also in the gut mucosa. Substantial advantages of our research include the analysis of both sexes and sequencing of six variable regions of the 16S rRNA gene, providing novel and trustworthy information on metformin’s effects. In addition, we employed a factorial animal experiment, including all the relevant control groups, allowing us to analyze the effect of various factors that potentially influence the interaction between metformin and the gut microbiome. Knowledge of the spatial variation of the gut microbiome in response to metformin treatment could potentially allow for more targeted microbiome modifications. In the future, this could alleviate the side effects experienced by metformin users, thereby increasing the applicability of the medication.
Results
Microbial composition analysis
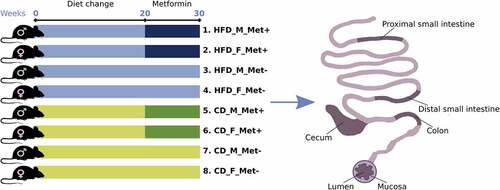
In total, 192 microbiome samples representing four different intestinal regions at the luminal and mucosal layers collected from 24 mice were sequenced. One of the samples was excluded from further analysis due to possible mislabeling. Mice representing three experimental units were included in each group representing each of the eight treatment arms described in this study ().
Figure 1. Experimental design of the study (N = 24) and intestinal sites studied. Abbreviations: HFD – high-fat diet; CD – control diet; M – male; F – female; Met+ – receiving metformin treatment for 10 weeks; Met- – not receiving metformin treatment.
To summarize the microbiome composition in each analyzed site, we compiled a list of the top 20 location-specific genera, as shown in . We observed variation in microbial composition both longitudinally and cross-sectionally. Both parts of the small intestine were dominated by Lactobacillus in HFD-fed mice, followed by Pseudomonas and Microbacterium in the mucosal layer and Pseudomonas and Lactococcus in the luminal layer (). Likewise, Lactobacillus and Pseudomonas prevailed in CD-fed mice, followed by Lactococcus in the mucosal layer (). In the luminal layer, Lactobacillus was followed by Pseudomonas and Microbacterium in the proximal part of the small intestine and by Lactococcus and Streptococcus – in the distal part (). The relative abundance of Lactococcus was increased in the distal small intestine of CD-fed male mice receiving metformin treatment. In contrast, in HFD-fed mice, this effect was more pronounced in female mice in both parts of the small intestine. Streptococcus was more abundant in the small intestine of female HFD-fed mice than in males, and its relative abundance was higher in the metformin-treated animals.
Figure 2. Microbiome composition at different sites of high-fat diet-fed mice at the genus level – top 20 genera are shown. Mucosal layer: (a) proximal small intestine; (b) distal small intestine; (c) cecum; (d) colon. Luminal content layer: (e) proximal small intestine; (f) distal small intestine; (g) cecum; (h) colon. Samples representing mice receiving metformin treatment are highlighted. Red and blue bars under each plot indicate females and males, respectively.
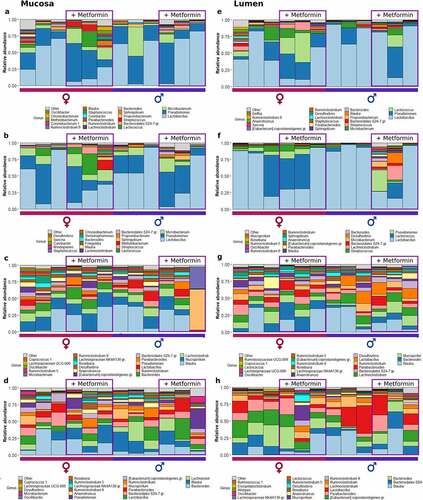
Figure 3. Microbiome composition at different sites of control diet-fed mice at the genus level – top 20 genera are shown. Mucosal layer: (a) proximal small intestine; (b) distal small intestine; (c) cecum; (d) colon. Luminal content layer: (e) proximal small intestine; (f) distal small intestine; (g) cecum; (h) colon. Samples representing mice receiving metformin treatment are highlighted. Red and blue bars under each plot indicate females and males, respectively.
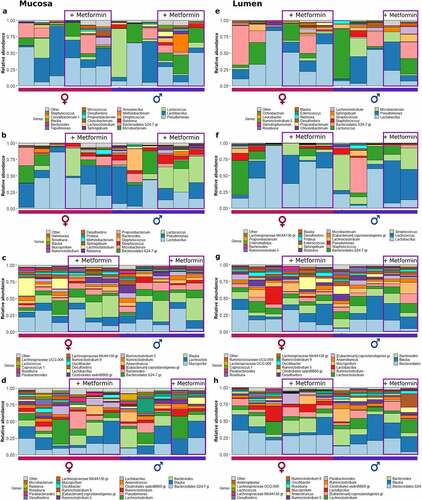
In HFD-fed mice, Blautia had the highest relative abundance in the cecum at both layers (). Mucispirillum, Lachnoclostridium, and Bacteroides were among the other top genera in the cecum. In CD-fed mice, Mucispirillum showed the highest relative abundance in the mucosa, while luminal content was enriched in Bacteroidales representatives (). Blautia and Lachnoclostridium had high relative abundance in both layers. Similar to the cecum, in the colon of HFD-fed mice top bacteria were Bacteroides in the mucosa, followed by Blautia and Lachnoclostridium, and Blautia in the luminal layer, followed by Bacteroides and other Bacteroidales members (). Similar results were observed in CD-fed mice ().
Alpha and beta diversity analysis
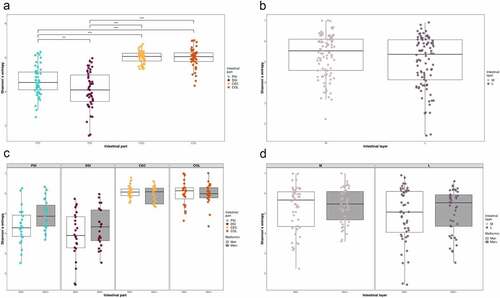
Shannon diversity index analysis revealed significant differences in alpha diversity between all the studied intestinal segments, with the most pronounced differences present between the distal part of the small intestine and two other locations, cecum, H = 55.90, p-value<0.001 and large intestine, H = 55.67, p-value<0.001 (). Similar results were observed for Pielou’s evenness and Faith’s phylogenetic diversity (data not shown). There were no significant differences in alpha diversity between intestinal layers for all the metrics analyzed. When the effect of metformin treatment on alpha diversity in each intestinal site was evaluated, we did not observe any significant differences after adjustment for multiple testing for all the metrics analyzed.
Figure 4. Microbiome alpha diversity analysis expressed as Shannon index: (a) between intestinal parts; (b) between intestinal layers. Microbiome alpha diversity analysis in response to metformin treatment expressed as Shannon index, n = 12 per group: (c) between intestinal parts; (d) between intestinal layers. PSI – proximal small intestine; DSI – distal small intestine; CEC – cecum; COL – colon; M – mucosa; L – lumen. **adjusted p < 0.05; *** adjusted p < 0.01.
Beta diversity was evaluated by ordination analysis. Biplots using PCA were generated, including each of the studied groups based on the diet type and metformin treatment status (). When taken together, samples representing both parts of the small intestine clustered separately from the samples of the cecum and colon (). Sphingobium, Sarcina, Propionibacterium, Pseudomonas, and Microbacterium representatives were the principal microbial identifiers of the proximal small intestine. Lactococcus, Lactobacillus, Streptococcus, Enterococcus, and Staphylococcus were the main drivers of the distal small intestine. In turn, cecum samples were identified by Mucispirillum, Anaerotruncus, Blautia, Ruminiclostridium, and Bacteroides. Colon was characterized by Desulfovibrio, Parabacteroides, Eubacterium_coprostanoligenes_group members, Alistipes, and Bacteroidales_S24-7_group (now known as Muribaculaceae) representatives.
Figure 5. Beta diversity of all samples taken together was estimated using principal components analysis on centered log-ratio transformed values. Intestinal part, diet, and metformin treatment status are indicated. PSI – proximal small intestine; DSI – distal small intestine; CEC – cecum; COL – colon. In the corresponding intestinal part, continuous and dashed ellipses represent Met+ and Met- subsets, respectively.
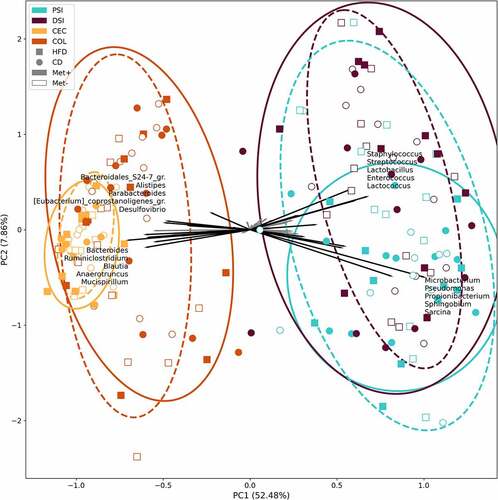
Figure 6. Beta diversity in each of the groups in response to 10 weeks long metformin treatment in each of the intestinal sites, n = 6 per group: (a) mucosa; (b) lumen; (c) proximal small intestine; (d) distal small intestine; (e) cecum; (f) colon.
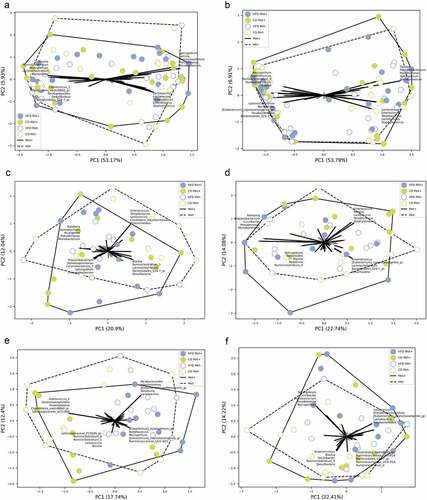
A separate analysis of each intestinal part () revealed Chryseobacterium, Propionibacterium, Corynebacterium_1, and Sphingobium as the principal identifiers of metformin treatment in the proximal small intestine. The distal part was characterized by Lactococcus, Streptococcus, Enterococcus, Proteus, and Staphylococcus in CD-fed mice and Blautia, Ruminiclostridium_9, Sphingobium, Bacteroides, and Roseburia in HFD-fed mice. The main identifiers of metformin treatment in the cecum of HFD-fed mice were Eubacterium representatives, Mucispirillum, Ruminococcaceae_UCG-003, and Streptococcus and Lachnospiraceae_FCS020_group, Ruminiclostridium representatives, Lactococcus, and Blautia in CD-fed mice. At the same time, Sphingobium, Curvibacter, Microbacterium, Pseudomonas, and Mucispirillum were the strongest identifiers in the colon.
Differentially abundant taxa
Metformin treatment-mediated effects on the abundance of bacteria in different intestinal sites
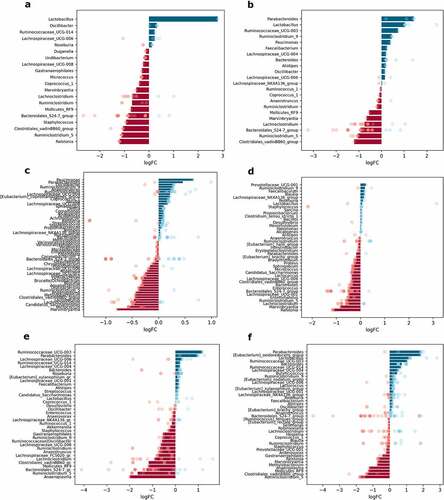
When samples were contrasted regarding metformin treatment status (Met+ vs. Met- groups, n = 12 per group), up to 41 different genera were significantly differentially abundant in any of the parts of the small intestine; 28 genera in the cecum and 31 in the colon; and up to 11 genera in each of the intestinal layers studied ().
Figure 7. Differentially abundant genera in response to metformin treatment in different intestinal parts and layers (expressed as LogFC), n = 12 per group: (a) mucosa; (b) lumen; (c) proximal small intestine; (d) distal small intestine; (e) cecum; (f) colon. Blue bars represent genera with increased abundance among metformin users, and red bars – with decreased abundance. Dots of the corresponding color indicate all the individual features assigned to the genus.
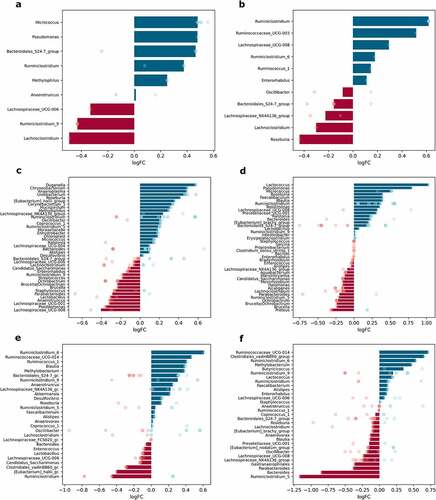
Metformin treatment showed a varied effect in different sites of the intestine. The effect on the abundance of Bacteroidales_S24-7_group members was inversed in each layer – metformin increased the abundance of this genus in mucosa samples but decreased it in luminal content samples (). Ruminiclostridium increased in the mucosa and lumen, while Lachnoclostridium decreased in both layers. Several genera were significantly affected only in one of the layers. The abundance of Roseburia declined in luminal content samples. In contrast, the abundances of Micrococcus, Pseudomonas, and Methylophilus were significantly affected only in the mucosa.
Analysis of each of the intestinal parts separately revealed that metformin had a stronger effect on the abundance of the bacteria in the small intestine. Bacteria with increased abundances in response to metformin treatment only in the proximal small intestine include Duganella, Chryseobacterium, Anaeroplasma, Undibacterium, Corynebacterium, Mucispirillum, and Methylophilus (). In turn, Eubacterium_halli_group members were increased in the proximal small intestine but decreased in the cecum. Genera augmented uniquely in the distal part of the small intestine, include Faecalibaculum and Tepidimonas, while Proteus was depleted (). The abundance of Roseburia and Micrococcus was increased in both parts of the small intestine, while Ochrobactrum was decreased in these parts. Pseudomonas was affected in opposite directions in each part of the small intestine, with the abundance of the genus decreasing in the proximal part and increasing in the distal part. The most pronounced effect of metformin on the increased abundance was detected for Lactococcus in the distal small intestine; it was also increased in the colon, though to a lesser extent.
Blautia was enriched in the distal part of the small intestine and cecum but diminished in the colon samples. Ruminiclostridium increased in all sites except cecum, where it was one of the most depleted genera (). Several genera were altered in the cecum and colon in opposite directions. Methylobacterium and Ruminococcaceae_UCG-014 were enriched in both parts, while Bacteroides was decreased. In turn, Clostridiales_vadinBB60_group members were decreased in the cecum and increased in the colon. Butyricicoccus was significantly increased uniquely in the colon, but Gastranaerophilales was decreased (). Ruminiclostridium_5 was the most reduced genus in response to metformin treatment in the colon, but it was increased in the proximal small intestine. The abundance of Parabacteroides was decreased in both parts of the small intestine and colon but was not affected in the cecum. A similar pattern was detected for Lachnospiraceae_UCG-008, with the only difference being that it was augmented in the distal part of the small intestine.
Sex-related differences in the abundance of microbiome members in the intestinal sites studied
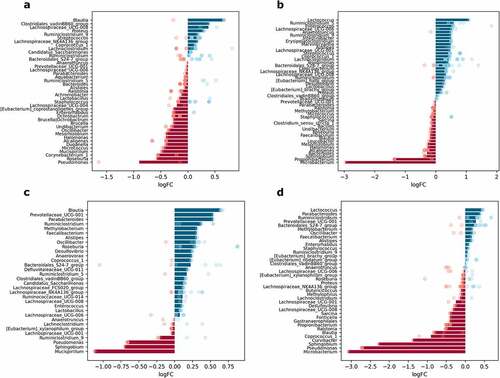
The effect of sex was evaluated by contrasting the samples from male mice of all experimental groups with corresponding samples from female mice at each intestinal site separately, n = 12 per group. In total, 11 genera in mucosal samples and 8 genera in luminal content samples were differentially abundant between males and females. When each of the intestinal parts was analyzed separately, 51 genera in the proximal small intestine; 40 genera in the distal small intestine; 28 genera in the cecum; and 30 genera in the colon were significantly differentially abundant between sexes ().
Figure 8. Differentially abundant genera between sexes in different intestinal parts and layers (expressed as LogFC), n = 12 per group: (a) mucosa; (b) lumen; (c) proximal small intestine; (d) distal small intestine; (e) cecum; (f) colon. Blue bars represent genera with increased abundance among males, and red bars – with decreased abundance. Dots of the corresponding color indicate all the individual features assigned to the genus.
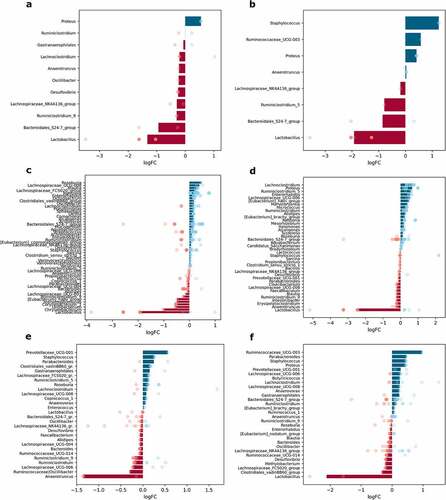
Lactobacillus showed the most pronounced differences between sexes, with being decreased in males both in mucosal and luminal content samples (). Members of the Bacteroidales_S24-7_group were also depleted in both layers in males compared to females. In contrast, Proteus was increased in males in both mucosa and lumen, while Staphylococcus and Ruminococcaceae_UCG-003 were increased, and Ruminiclostridium_5 was decreased only in the lumen.
The abundance of Lactobacillus was strongly reduced in all of the intestinal parts of males (distinct features in the cecum). Among the genera with significantly different abundance only in the proximal small intestine, Roseburia was enriched, while Chryseobacterium, Undibacterium, and Corynebacterium were depleted in males relative to females (). [Eubacterium]_hallii_group was affected by the sex in the small intestine – in males, it was decreased in the proximal part but increased in the distal part of the small intestine; however, Enterorhabdus was enriched in both parts. Lachnoclostridium and Ruminiclostridium_5 were increased in the distal part of the small intestine in males compared to females (). Meanwhile, the abundance of Proteus was increased in both the distal small intestine and colon. The abundance of Anaerotruncus was markedly decreased in the cecum of males (). Ruminococcaceae_UCG-003 was increased in males only in the colon. Parabacteroides, Staphylococcus, and Prevotellaceae_UCG-001 representatives were enriched in the cecum and colon in males compared to females ().
Diet-induced effects on the abundance of intestinal microbiome representatives
To assess dietary effects, samples from all HFD-fed mice were compared with corresponding samples from CD-fed mice at each intestinal site separately, n = 12 per group. Diet significantly affected the abundance of 20 genera in the mucosa, 22 genera in the lumen, 55 and 41 genera in the proximal and distal small intestine, respectively, 36 genera in the cecum, and 42 genera in the colon ().
Figure 9. Differentially abundant genera between high-fat diet-fed and control diet-fed mice in different intestinal parts and layers (expressed as LogFC), n = 12 per group: (a) mucosa; (b) lumen; (c) proximal small intestine; (d) distal small intestine; (e) cecum; (f) colon. Blue bars represent genera with increased abundance among HFD-fed mice, and red bars – with decreased abundance. Dots of the corresponding color indicate all the individual features assigned to the genus.
The abundance of Lactobacillus increased in HFD-fed mice in both studied layers LogFC = 2.79 ± 0.48, FDR<0.001 and LogFC = 2.44 ± 0.53, FDR = 0.002 for mucosa and lumen, respectively (). In contrast, Ruminiclostridium_5, Mollicutes_RF9, Lachnoclostridium, Marvinbryantia, and Clostridiales_vadinBB60_group members were significantly lowered in both layers in response to HFD feeding. Ralstonia and Staphylococcus were decreased in HFD-fed mice solely in mucosa samples. Parabacteroides and Ruminiclostridium_9 were significantly increased in the lumen of HFD-fed mice exclusively.
Uniquely to the proximal small intestine, the abundance of Paucimonas and Oscillibacter increased, while Undibacterium decreased in HFD-fed mice (). Genera, which significantly decreased in both parts of the small intestine in response to HFD feeding, include Micrococcus, Enterorhabdus, and Candidatus_Saccharimonas (). Staphylococcus was depleted in the cecum of HFD-fed mice (). In turn, Eubacterium_oxidoreducens_group members were increased only in the colon (). Mollicutes_RF9 was decreased in both the cecum and colon of HFD-fed mice, while Ruminococcaceae_UCG-003 was increased in these parts. In HFD-fed mice, representatives of two genera, Ruminiclostridium_5 and Clostridiales_vadin_BB60_group, were decreased in all intestinal parts compared to CD-fed mice. As described above, these genera were also depleted in both intestinal layers of HFD-fed mice.
Differentially abundant bacteria between the mucosa and the lumen in all intestinal parts
The luminal and mucosal samples from all experimental groups were contrasted in each of the intestinal parts to investigate layer-related differences in microbiome composition, n = 12 per group. A total of 41 genera in the proximal small intestine, 48 – in the distal small intestine, 32 – in the cecum, and 38 – in the colon were significantly differentially abundant between the lumen and mucosa ().
Figure 10. Differentially abundant genera between lumen and mucosa in different intestinal parts (expressed as LogFC), n = 12 per group: (a) proximal small intestine; (b) distal small intestine; (c) cecum; (d) colon. Blue bars represent genera with increased abundance in the lumen, and red bars – with decreased abundance. Dots of the corresponding color indicate all the individual features assigned to the genus.
Differential abundance analysis between mucosa and lumen layers in each of the intestinal parts separately revealed substantial spatial variation of genera. Uniquely to the proximal small intestine, its lumen was depleted of Corynebacterium_1 and Micrococcus (). Genera specifically increased in the lumen of the distal part of the small intestine include Erysipelatoclostridium, Intestinibacter, and Marvinbryantia. Anaerotruncus and Lachnospiraceae_UCG-006 also were enriched in the lumen of the distal small intestine ().
Several genera were increased in the cecum and colon, including Parabacteroides, Prevotellaceae_UCG-001, Methylobacterium, and Faecalibacterium (). The abundance of Mucispirillum was lower in the lumen of the proximal small intestine and cecum. Similarly, Oscillibacter was reduced in the lumen of the proximal small intestine but increased in the cecum. Ruminiclostridium_5 and Enterococcus were enriched in the lumen of the distal small intestine and cecum. Genera with altered abundance, specifically in the distal small intestine and colon, include Microbacterium and Propionibacterium, with reduced abundance in the lumen of both parts, and Lactococcus, with increased abundance in the same sites.
Curvibacter was depleted solely in the lumen of the colon. Roseburia and Ruminiclostridium_9 were altered in opposite directions in the same sites. Roseburia was decreased in both parts of the small intestine and increased in the cecum; in turn, Ruminiclostridium_9 was depleted in the small intestine and enriched in the cecum. Ruminiclostridium, together with Alistipes and Sphigobium, were oppositely affected, the former two being enriched in the lumen of the distal small intestine, cecum, and colon, while the latter was reduced in the same sites. Coprococcus_1 and Blautia were differentially abundant between layers in all intestinal parts. Blautia was increased in the lumen of the proximal small intestine and cecum but decreased in the distal part of the small intestine and colon. Coprococcus_1 was enriched in the lumen in all parts of the intestine except the colon, where the abundance of the genus was reduced.
Interaction of metformin treatment with diet type, sex, and intestinal layer
The genera with the most substantial differences in response to metformin treatment in each of the analyzed subsets are summarized in . In total, we found 77 genera with a LogFC of at least 1 in any of the analysis subsets (). Complete lists of statistically significantly altered genera in response to metformin treatment in each subset are shown in Supplementary Figures S1–S4. Metformin affected representatives of all the main phyla found in the intestine – Bacteroidetes, Firmicutes, Actinobacteria, Proteobacteria, and Verrucomicrobia.
Figure 11. Summary of differentially abundant genera between Met+ and Met- mice in different subsets formed by various combinations of the levels of studied factors (expressed as LogFC), n = 3 per group. Only the genera with an absolute LogFC≥1 in at least one of the subsets are included, indicating the directions of changes (with an absolute LogFC>0.2), if detected, in all subsets. M – mucosa; L – lumen; PSI – proximal small intestine; DSI – distal small intestine; CEC – cecum; COL – colon. Blue triangle – an increase of the abundance among metformin users; red triangle – a decrease among metformin users.
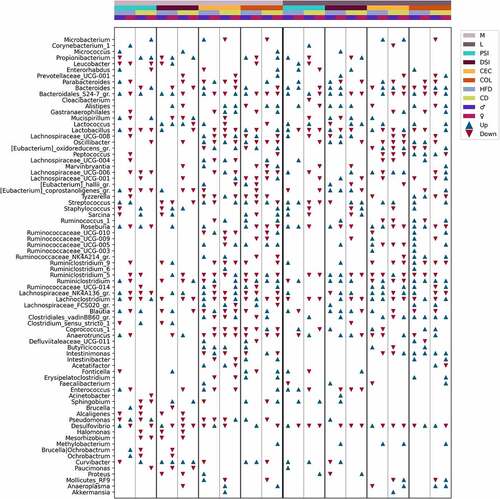
Members of Betaproteobacteria: Paucimonas and Alcaligenes were reduced only in the mucosal layer of both parts of the small intestine, while another representative Curvibacter was altered in opposite directions in different sites, including the cecum and colon in the mucosal layer but not in the luminal layer. Deltaproteobacteria member Desulfovibrio was affected by metformin almost in all studied sites. The most remarkable changes in abundance were observed in the proximal small intestine in both layers and the distal small intestine in the mucosal layer of HFD-fed mice. In addition, this genus showed marked sexual dimorphism in response to metformin treatment, with being increased in HFD-fed males in both parts of the small intestine and decreased in females in the mucosal layer and the proximal small intestine and cecum in the luminal layer. In CD-fed mice, Desulfovibrio was reduced in both sexes, though it was more pronounced in females. Sex-related differences in the proximal small intestine were also observed for Pseudomonas in mice fed both diet types, with being reduced in males and increased in females. The abundance of Pseudomonas was altered only in the mucosal layer, except for an increase in the lumen of the distal small intestine of HFD-fed males.
The most pronounced changes in the abundance of Actinobacteria members were found in both layers of the proximal small intestine; however, significant changes in at least one genus were observed in all intestinal parts. Bacteroides was increased in both sexes of HFD-fed mice in the lumen of both parts of the small intestine and decreased in the colon. In turn, in the colon of CD-fed mice, Bacteroides was increased. Bacteroidales_S24–7 group (Muribaculaceae) was altered in almost all studied sites. The strongest reduction in the abundance of the genus was found in the mucosa of the distal small intestine of CD-fed males.
The abundance of Akkermansia was significantly affected exclusively in CD-fed male cecum in both layers. Mucispirillum was strongly decreased in the mucosa of the proximal and distal small intestine of HFD-fed females, while it was slightly increased in males. In contrast, CD-fed females had marked increases in the genus at the exact locations. In the luminal layer, Mucispirillum was depleted in the proximal small intestine of CD-fed males and the distal small intestine of HFD-fed females, whereas the genus was increased in the distal small intestine of males fed both diet types and in HFD-fed males in the cecum.
A substantial interaction between metformin treatment and sex, diet type, and the intestinal layer was observed regarding the abundance pattern of Bacilli members. Lactobacillus, Enterococcus, Staphylococcus, and Streptococcus, opposite to Lactococcus, were markedly decreased in the lumen of the proximal small intestine of CD-fed males. In contrast, all genera together with Lactococcus were increased in HFD-fed males at the same site. Lactococcus was substantially increased in the distal small intestine of CD-fed mice of both sexes, while in HFD-fed males, it was reduced. Lactococcus was increased in HFD-fed males and CD-fed females in the lumen of the colon. In the mucosa, the abundance of Lactococcus was not affected by metformin in the proximal small intestine. However, it was increased in both sexes of HFD-fed mice and CD-fed males in the distal small intestine, whereas in females, it was reduced. The abundance of Lactobacillus was mainly reduced in response to metformin, though it was augmented in the mucosa of the proximal small intestine of HFD-fed males.
Intestinimonas and Clostridiales_vadinBB60_group members were affected only in the cecum and colon in the mucosa layer. A similar pattern was observed in the lumen, except that Clostridiales_vadinBB60_group was strongly increased in CD-fed males in the proximal small intestine and HFD-fed females in the distal small intestine. Butyricicoccus was affected similarly, mainly being augmented only in the mucosa of the cecum of male mice and the colon of HFD-fed males. In the lumen of the cecum, HFD-fed male mice were enriched in Butyricicoccus, while in CD-fed males genus was reduced. Butyricicoccus was increased in HFD-fed females in the lumen of the colon but unchanged in other subsets. Other Clostridiaceae representatives were not affected in the cecum and colon in the luminal layer.
Genera representing families Lachnospiraceae, Peptococcaceae, Peptostreptococcaceae, and Ruminococcaceae were affected more in the cecum and colon in both layers. In contrast to this observation, Eubacterium_coprostanoligenes_group members were more affected in both parts of the small intestine in both layers. In general, members of the families mentioned above were enriched in the mucosa of the proximal small intestine of HFD-fed males but decreased in HFD-fed females. Other features common to these genera (with a few exceptions) are a decrease in the lumen of the proximal small intestine and cecum of CD-fed mice; and enrichment in the distal small intestine and colon (predominantly males) of HFD-fed mice. Roseburia showed strong sex-related differences in the abundance changes in response to metformin treatment. The abundance of the genus was increased in the mucosa of the proximal small intestine of male mice fed both types of diet and decreased in females. Roseburia was enriched only in HFD-fed males in the cecum but unchanged in other subsets. Similarly, it was increased in the colon of HFD-fed males, and a decrease was also found in other subsets, CD-fed mice and HFD-fed females. In the lumen, Roseburia was increased in HFD-fed mice of both sexes in all intestinal parts (except a decrease in females in the distal small intestine) and decreased in CD-fed mice of both sexes in the cecum and colon and both parts of the small intestine in males only.
Discussion
The effect of metformin therapy on the composition and function of the gut microbiome has been demonstrated in previous studies;Citation20–26 however, an in-depth analysis of spatial variation of the effects of long-term metformin treatment on the gastrointestinal tract has not yet been performed in vivo. Our study provides novel information on the effects of metformin on both the gastrointestinal mucosa and the luminal layers at four different sites of the gut. Furthermore, our animal experiment included both sexes of mice, thus enabling an additional dimension of analysis of metformin’s effects. Finally, the metformin dosage was calculated to correspond to the therapeutic dose in humans, which makes our study more clinically relevant than experiments in which metformin was administered at the supratherapeutic level.
We observed significantly different alpha diversities between all the studied intestinal parts corresponding to anatomical and functional differences of the various sites. The cecum and colon microbiomes were more diverse than those of the small intestine, consistent with a previous report.Citation27 The relative abundance of Lactobacillus decreased along the intestinal tract toward the colon, as described before.Citation9 Beta diversity analysis showed a clear difference between microbial communities of the small intestine and the cecum and colon, similar to a previous study comparing different parts of the gastrointestinal tract of male mice.Citation27 Analysis revealed that metformin treatment has the most pronounced effect on the samples representing the proximal small intestine, followed by the distal small intestine. Cecum samples of all experimental groups clustered most closely, showing the least effect of any studied factors on this intestinal part and suggesting its relative stability.
We have shown the effect of metformin treatment, sex, diet type, and intestinal layer on the spatial variation of the gut microbiome by analyzing each of these factors separately. Furthermore, we have investigated the effect of metformin treatment in each of the subsets formed by combinations of levels of the studied factors: intestinal layer, intestinal part, diet type, and sex, and detected substantial variation of metformin’s effects in each of these subsets.
Metformin treatment had a more pronounced effect on the microbiome composition in both parts of the small intestine (indicated by higher absolute LogFC values). This finding confirms the hypothesis that the effect of metformin treatment is not uniform in the whole intestine but rather depends on the absorption characteristics of the medication. When all mice were contrasted based on metformin treatment status, several genera were increased uniquely in the proximal small intestine, where according to a previous study,Citation16 the absorption of metformin occurs most. Among these genera, many are aerobic bacteria – Duganella, Chryseobacterium, Undibacterium, Corynebacterium, Methylophilus, and the anaerobes Anaeroplasma and Mucispirillum. Mucispirillum is commensal in the microbiota of humans and various vertebrates. The only species of the genus, Mucispirillum schaedleri, is a core member of the laboratory mouse microbiota throughout the whole gastrointestinal tract. Mucispirillum schaedleri has not been widely identified in human studies due to its low abundance in fecal samples, but it is enriched in the intestinal mucosa.Citation28 Genomic data have indicated that instead of degrading mucosal glycans such as mucin, M. schaedleri predominantly processes monosaccharides, oligopeptides, amino acids, glycerol, and short-chain fatty acids produced by other bacteria.Citation29
Metformin treatment substantially increased the abundance of Lactococcus in the distal part of the small intestine. This is consistent with a previous study with a similar duration and route of metformin treatment but using only aged male mice, where an increase in Lactococcus was observed in fecal samples after treatment with metformin.Citation23 Lactic acid bacteria, including Lactococcus, produce lactate, a substrate for other members of the microbiota to convert it into butyrate.Citation8 We observed a subtle increase in another lactate producer, Lactobacillus, in the distal small intestine, whereas the abundance of the genus was reduced in the proximal small intestine and cecum and unchanged in the colon. Previous studiesCitation24,Citation30 have produced conflicting results regarding the effect of metformin on Lactobacillus.Citation31 This could be explained by using fecal samples that do not fully represent the small intestinal microbiota, differences in experimental designs, and species-specific effects not detected in the genus-level analysis.Citation32 This together with the intestinal part-unique effects of metformin treatment, further supports the proximal and the distal part of the small intestine as principal sites of metformin-mediated effects on the gut microbiome.
Our results show that metformin mainly targets genera belonging to Clostridia in all intestinal sites. Altered genera include the representatives of Lachnospiraceae (Blautia, Lachnoclostridium, Lachnospira, Marvinbryantia, Roseburia), Clostridiaceae (Butyricicoccus, Clostridium), Ruminococcaceae (Anaerotruncus, Faecalibacterium, Oscillibacter, Ruminococcus), and Eubacteriaceae (Eubacterium). This is consistent with a similar study in which the effect of short-term metformin treatment on the composition of the microbiome representing the intestinal lumen at different sites was assessed in male mice, showing a reduction of Clostridium and Lachnospiraceae members in response to metformin treatment.Citation19 We found an increase of Roseburia in both parts of the small intestine and depletion of the genus in the cecum and colon in the luminal layer. This could explain the previously described reduced abundance of Roseburia in the feces of HFD-fed mice after metformin treatment,Citation23 as feces mostly correspond to the samples of colonic contents.
In addition, we observed a strong sex-specific effect on the spatial variation of the gut microbiome when all mice were contrasted based on sex, as the abundance of Lactobacillus was strongly reduced in all intestinal parts and layers of males. This finding is supported by a study in healthy humans, where an increase of Lactobacillales in female mucosa-associated microbiota was reported.Citation33 Lactobacillus has been shown to be increased in diabetes patients and animals fed with a high-fat diet,Citation2,Citation13,Citation34 consistent with enrichment of the genus in the colon and both intestinal layers of HFD-fed mice compared to CD-fed mice in our study. However, we observed that Lactobacillus was decreased in the proximal small intestine of HFD-fed mice, showing the differences between the composition of the fecal microbiome and the microbiome of different intestinal parts. Previous studies have shown that Lactobacillus spp. reduce blood glucose levels in high-fat diet-induced diabetic male mice;Citation35 however, these are positively correlated with blood glucose levels in European women with T2D,Citation36 and metabolites produced by Lactobacilli may contribute to the glucose modulation of metformin.Citation37 Sex-related differences in Lactobacillus abundance that we observed might partially explain these discrepancies emphasizing the need to perform studies on individuals of both sexes to obtain as complete information as possible. Additionally, an increase in Anaerotruncus has been found in women with metabolic syndrome compared to men.Citation38 Our data support these sex-related differences, narrowing them down to the cecum. We also detected a higher abundance of opportunistic pathogens Proteus in both layers and Staphylococcus in the lumen of male mice compared to females. Proteus was increased in the distal small intestine, Staphylococcus in the cecum, and both genera in the colon of males. This suggests that the microbiota of male mice in this model contains more opportunistic pathogens than females, which could contribute to another layer of phenotypic sexual dimorphism reported in HFD-fed mice.Citation39
The role of other factors not analyzed in this study, including sex hormones, stress, dietary fiber content affecting systemic estrogen levels, the interaction between sex and genotype, and circadian rhythms, also might be driving the sex-related differences in the gut microbiome.Citation40–42 In addition, macronutrient levels and diet composition, including the availability of short-chain fatty acids, contribute to the effect of diet.Citation43 Wang et al. compared microbiome composition between HFD-fed and low-fat diet-fed mice in the cecum and colon and, similar to our results, found a higher abundance of Lachnospiraceae_UCG-006 in the cecum of HFD-fed mice.Citation13 We, however, add that in both parts of the small intestine, Lachnospiraceae_UCG-006 is reduced in HFD-fed mice, indicating that the effect of HFD feeding on this genus is not uniform throughout the intestine. Furthermore, we did not observe significant differences in the abundance of Blautia in the cecum, which was reported to be increased in this intestinal part, although it was enriched in both parts of the small intestine in our data.
Analysis between the lumen and mucosa in each of the intestinal parts revealed that Intestinibacter, Erysipelatoclostridium, and Marvinbryantia are genera enriched in the lumen of the distal small intestine uniquely. All these genera have not been extensively studied; Intestinibacter has been suggested to be involved in mucus degradation;Citation2 a representative of Erysipelatoclostridium (formerly named Clostridium ramosum) has been associated with diet-induced obesity in gnotobiotic mice;Citation44 Marvinbryantia has been described as fermenting glucose to acetate in the presence of high formate concentrations.Citation45 Enrichment of Prevotellaceae_UCG-001, Oscillibacter, and Parabacteroides in the lumen of the cecum and colon agrees with a study comparing lumen-associated and mucosa-associated microbiota.Citation33
We observed an interaction between metformin treatment and each of the levels of studied factors, showing the complex landscape of metformin’s effects on the gut microbiome. Many genera were strongly affected in only one of the sexes or specific intestinal sites. For example, this analysis allowed us to confirm the promoting effect of metformin on the abundance of Lactococcus in the distal small intestine while adding information that it is mainly confined to the mucosa and that the abundance of Lactococcus is reduced in the lumen of HFD-fed males. In addition, we found that the genus is increased in the proximal small intestine of male mice only in the lumen.
This study has some limitations. First, although we evaluated the appropriate sample size before conducting the experiment, the study would have benefited from a larger sample size for each group studied. Second, due to the complexity of the Sidle algorithm, we had to balance the sampling depth and the number of samples still available after sampling, resulting in a lower resolution for taxa with small sequence counts to retain the statistical power. Finally, we observed considerable variability in gut microbiome composition between cages, so future studies should carefully consider the appropriate experimental unit for such studies.
In conclusion, our study describes the spatial differences of the metformin’s effects on the gut microbiome in luminal and mucosal layers of the intestine using both sexes of mice. Our results have revealed that metformin mainly exerts its microbiome-modulating effects in the small intestine, increasing the abundance of Lactococcus among other bacteria, while the impact on the microbiome of the cecum and colon is less pronounced. The effect of metformin on microbiome composition depends on sex, diet type, and intestinal layer. We furthermore emphasize the importance of including animals of both sexes in studies investigating the effects of metformin on the gut microbiome.
Materials and methods
Ethics statement
Animal procedures were reviewed and approved by the National animal welfare and ethics committee (Permit No. 91).
Animals, study design, and procedures
The animal experiment has been described previously.Citation46 In short, C57BL/6N mice of both sexes with SPF status were purchased from the University of Tartu Laboratory Animal Centre and adapted to the local animal facility for one week. All the animals were housed under SPF conditions, 23 ± 2 ºC, with 55% humidity. The light cycle was 12:12 hours, with a light period from 7:00 am to 7:00 pm. Animals were housed in individually ventilated cages (Tecniplast) of up to three same-sex animals per cage on aspen bedding mixed with ALPHA-dri. Mice were fed HFD (rodent diet with 60 kcal% fat (D12492, Research Diets)) or CD (rodent diet with 10 kcal% fat (D12450J, Research Diets)) ad libitum and had free access to drinking water. At the initiation of the study, all mice were six weeks old. The total number of animals was 72, forming 24 experimental units – the cages with animals. For further analysis, each experimental unit was represented by one animal from the corresponding cage. The sample size was determined by the resource equation method, which is suitable for complex designs.Citation47
The study had a randomized block design and included eight experimental groups – HFD_M_Met-, HFD_F_Met-, HFD_M_Met+, HFD_F_Met+, CD_M_Met-, CD_F_Met-, CD_M_Met+, and CD_F_Met+, depending on T2D status induced by high-fat diet (HFD) or control diet (CD) feeding; sex (M or F for males and females respectively); and metformin treatment status (Met+ and Met- indicating exposure to metformin treatment) (). Type 2 diabetes induction and biochemical parameters were described previouslyCitation46 in detail. The duration of type 2 diabetes induction with HFD feeding was 20 weeks. Diagnostic criteria for T2D included increased body weight, increased fasting plasma glucose and insulin levels in HFD-fed mice compared to CD-fed mice, and a HOMA-IR index of at least 2. Metformin was then administered in the drinking water at a concentration calculated to correspond to 50 mg/kg body mass/day for 10 weeks while continuing to be fed either an HFD or CD. During the treatment period, all bottles, including those of the control group, were changed daily, and metformin was added freshly to the drinking water of the treatment groups.
Sample collection
All the animals were sacrificed by cervical dislocation. Luminal and mucosal microbiome samples representing four different intestinal segments – proximal small intestine (duodenum-jejunum), distal small intestine (ileum), cecum, and colon were collected (). First, intestinal segments were rinsed separately with distilled water to collect luminal contents. Second, rinsed tissue samples were put in a tissue dish containing cold PBS and cut longitudinally. Third, the remaining lumen contents were removed by repeated rinsing in separate clean tissue dishes. Finally, mucosa samples containing microbiome were obtained by scraping the inner intestinal surface of the intestinal segment with a cell scraper and collected in sterile tubes. Samples were stored at 80ºC until further analysis.
DNA isolation and 16S rRNA gene amplification
Bacterial DNA was isolated from the collected samples using FastDNA Spin Kit for Soil (MP Biomedicals) according to the manufacturer’s instructions, and the concentration was measured using the Qubit 2.0 Fluorometer (Invitrogen). The concentration of DNA before library preparation was normalized to 5 ng/µl for every sample. The V1-V2, V3-V4, and V5-V6 hypervariable regions of the 16S rRNA gene were amplified by PCR using specific primers (Supplementary Table 1) tagged with Illumina sequencing adapters and sample-specific barcodes according to Illumina’s instructions. PCR products were analyzed by 1.2% agarose gel electrophoresis and purified using NucleoMag (Macherey-Nagel) magnetic beads. Purified amplicons were pooled at equimolar concentrations, and sample indexes were added by additional PCR. The quality of libraries was assessed by Agilent High Sensitivity DNA Kit (Agilent Technologies) on the Agilent 2100 Bioanalyzer (Agilent Technologies). Samples were sequenced on Illumina MiSeq (Illumina) platform with MiSeq Reagent Kit V2 (500-cycles) (Illumina) according to the manufacturer’s instructions.
Data analysis
Data analysis began with evaluating sequencing data quality and read count distribution per sample group using the FastQC (v0.11.9)Citation48 and MultiQC (v1.12)Citation49 tools to identify possible sample level outliers and adapter contamination. Most of the analysis and diversity index calculation was performed using QIIME2 (v2022.2)Citation50 microbiome analysis environment. First, we processed the regional amplicons for each individual, using the Cutadapt pluginCitation51 to trim the forward and reverse primers for each amplicon, specifying the allowed error rate of 0.1 and allowing for indels or deletions in bases when matching with the primers. In this step, reads that did not match the primers were discarded.
The demultiplexed regional sequences were denoised with the DADA2Citation52 plugin to generate Amplicon Sequence Variants (ASVs). The trim lengths for DADA2 were selected for each region based on the base quality drop-off threshold from the visual inspection of the sample group level sequence quality box and whiskers plots to maximize the number of merged reads (Suplementary Table 1). Subsequently, all merged reads for each region were truncated to the length of 200 base pairs. The SILVA (v128) taxonomic databaseCitation53 was imported into QIIME 2 using the RESCRIPtCitation54 plugin; the database was filtered to remove any sequence with more than 5 degenerate nucleotides. Regional database reads were extracted using the q2-feature-classifier plugin.Citation55 The regional database reads were aligned with the representative ASV sequences, allowing a mismatch of 2 nucleotides. Regional average relative abundances were solved through the Sidle implementation of the Short Multiple Reads Framework (SMURF) algorithm.Citation56,Citation57 The phylogenetic tree was reconstructed by inserting consensus sequences for reconstructed amplicons into the SILVA (v128) backbone using the SEPP algorithmCitation58 phylogenetic reference backbone while also inserting sequences that did not align with the SILVA taxonomy reference database. To discard low information or artifact sequences, the reconstructed ASV table was frequency filtered for features observed in at least three samples and with a taxonomic classification of genus level or higher. From the resulting table, a random feature subsample of 945 sequences per sample was made to normalize for the differences in library size, which was then used to calculate Shannon diversity, Faith’s phylogenetic diversity, and Pielou’s evenness alpha diversity indices.
Statistically significant differences in the alpha diversity between analyzed groups were identified using the Wilcoxon Rank Sum test and Benjamini-Hochgberg’s procedure. False discovery rate (FDR) values<0.05 were considered statistically significant. Further analysis and visualization of results were performed in the RStudio (v2021.09.0) environment. Reconstructed and classified data was then imported into the phyloseq (v1.38.0)Citation59 environment. Sample level ordination was calculated on rarefied (945 sequences, seed = 43980) genus-level aggregated data, which was then transformed with the centered log ratio method and reduced with principal components analysis for each intestinal part and layer to evaluate the beta diversity. Taxonomic distribution bar plot graphs and ordination graphs were created with the microViz (v0.9.0.9009)Citation60 and Matplotlib (3.5.2)Citation61 packages, while alpha diversity box plot graphs were created with the ggplot2 (v3.3.6)Citation62 package. Finally, we performed a differential abundance test with the ANCOM-BC (v1.4.0)Citation63 package, including independent variables in the formula and excluding features not observed in at least 10% of all samples. To see the full list of used R packages, consult Supplementary Table 2. Median log fold change values of differentially abundant taxa of the same genera were visualized as bar plots using python libraries Matplotlib (3.5.2) and pandas (1.4.3).Citation64
Analysis of compositions of microbiomes with bias correction (ANCOM-BC) was performed using different levels of factors: metformin treatment status, sex, and diet type in each intestinal layer and part, n = 12 per group. To investigate the interaction between metformin treatment and the studied factors, analysis of compositions of microbiomes with bias correction (ANCOM-BC) was performed separately for each of the different combinations of factor levels, contrasting Met+ and Met- samples, n = 3 per group. Features representing the same genus were combined, and medians of the LogFC of abundances were plotted in each of the analyzed contrasts ( and Supplementary Figures S1–S4). Individual dots were included in the plots to show the genera consisting of multiple features and the distribution of LogFC for each of the features.
Supplemental Material
Download Zip (8.4 MB)Acknowledgments
We thank Justine W Debelius for helping with feature table construction and the use of the q2-Sidle plugin.
Disclosure statement
No potential conflict of interest was reported by the authors.
Supplementary material
Supplemental data for this article can be accessed online at https://doi.org/10.1080/19490976.2023.2188663
Additional information
Funding
References
- Shin NR, Lee JC, Lee HY, Kim MS, Whon TW, Lee MS, Bae JW. An increase in the Akkermansia spp. population induced by metformin treatment improves glucose homeostasis in diet-induced obese mice. Gut. 2014;63:727–23.
- Forslund K, Hildebrand F, Nielsen T, Falony G, Le Chatelier E, Sunagawa S, Prifti E, Vieira-Silva S, Gudmundsdottir V, Pedersen H, et al. Disentangling the effects of type 2 diabetes and metformin on the human gut microbiota. Nature. 2015;528:262–266.
- Bryrup T, Thomsen CW, Kern T, Allin KH, Brandslund I, Jørgensen NR, Vestergaard H, Hansen T, Hansen TH, Pedersen O, et al. Metformin-induced changes of the gut microbiota in healthy young men: results of a non-blinded, one-armed intervention study. Diabetologia. 2019;62:1024–1035.
- Tropini C, Earle KA, Huang KC, Sonnenburg JL. The gut microbiome: connecting spatial organization to function. Cell Host Microbe. 2017;21:433–442.
- Donaldson GP, Lee SM, Mazmanian SK. Gut biogeography of the bacterial microbiota. Nat Rev Microbiol. 2015;14:20–32.
- Belizário JE, Napolitano M. Human microbiomes and their roles in dysbiosis, common diseases, and novel therapeutic approaches. Front Microbiol. 2015;6:1–16.
- Wang J, Lang T, Shen J, Dai J, Tian L, Wang X. Core gut bacteria analysis of healthy mice. Front Microbiol. 2019;10:1–14.
- Thursby E, Juge N. Introduction to the human gut microbiota. Biochem J. 2017;474:1823–1836.
- Gu S, Chen D, Zhang JN, Lv X, Wang K, Duan LP, Nie Y, Wu XL. Bacterial community mapping of the mouse gastrointestinal tract. PLoS One. 2013;8:e74957.
- Liu Y, Zheng Z, Yu L, Wu S, Sun L, Wu S, Xu Q, Cai S, Qin N, Bao W. Examination of the temporal and spatial dynamics of the gut microbiome in newborn piglets reveals distinct microbial communities in six intestinal segments. Sci Rep [Internet]. 2019;9:1–8. doi:10.1038/s41598-019-40235-z. Available from.
- Yamamoto Y, Nakanishi Y, Murakami S, Aw W, Tsukimi T, Nozu R, Ueno M, Hioki K, Nakahigashi K, Hirayama A, et al. A metabolomic-based evaluation of the role of commensal microbiota throughout the gastrointestinal tract in mice. Microorganisms. 2018;6:101.
- Singh RP, Halaka DA, Hayouka Z, Tirosh O. High-Fat diet induced alteration of mice microbiota and the functional ability to utilize fructooligosaccharide for ethanol production. Front Cell Infect Microbiol. 2020;10:1–11.
- Wang B, Kong Q, Li X, Zhao J, Zhang H, Chen W, Wang G. A high-fat diet increases gut microbiota biodiversity and energy expenditure due to nutrient difference. Nutrients. 2020;12:1–20.
- Jandhyala SM, Talukdar R, Subramanyam C, Vuyyuru H, Sasikala M, Reddy DN. Role of the normal gut microbiota. World J Gastroenterol. 2015;21:8836–8847.
- Kirchgessner A. The role of the microbiota and potential for dietary intervention in chronic fatigue syndrome [Internet]. Elsevier Inc [ Available from]. 2016. doi:10.1016/B978-0-12-802304-4.00021-9.
- Bauer PV, Duca FA, Waise TMZ, Rasmussen BA, Abraham MA, Dranse HJ, Puri A, O’brien CA, Lam TKT. Metformin alters upper small intestinal microbiota that impact a glucose-SGLT1-Sensing glucoregulatory pathway. Cell Metab [Internet]. 2018;27:101–117.e5. doi:10.1016/j.cmet.2017.09.019. Available from.
- Buse JB, DeFronzo RA, Rosenstock J, Kim T, Burns C, Skare S, Baron A, Fineman M. The primary glucose-lowering effect of metformin resides in the gut, not the circulation: results from short-term pharmacokinetic and 12-week dose-ranging studies. Diabetes Care. 2016;39:198–205.
- Bailey CJ, Wilcock C, Scarpello JHB. Metformin and the intestine. Diabetologia. 2008;51:1552–1553.
- Bravard A, Gérard C, Defois C, Benoit B, Makki K, Meugnier E, Rainteau D, Rieusset J, Godet M, Vidal H. Metformin treatment for 8 days impacts multiple intestinal parameters in high-fat high-sucrose fed mice. Sci Rep [Internet]. 2021;11:1–12. doi:10.1038/s41598-021-95117-0. Available from.
- Wu H, Esteve E, Tremaroli V, Khan MT, Caesar R, Mannerås-Holm L, Ståhlman M, Olsson LM, Serino M, Planas-Fèlix M, et al. Metformin alters the gut microbiome of individuals with treatment-naive type 2 diabetes, contributing to the therapeutic effects of the drug. Nat Med [Internet]. 2017;23:850–858. doi:10.1038/nm.4345. Available from.
- Lee H, Lee Y, Kim J, An J, Lee S, Kong H, Song Y, Lee CK, Kim K. Modulation of the gut microbiota by metformin improves metabolic profiles in aged obese mice. Gut Microbes [Internet]. 2018;9:155–165. doi:10.1080/19490976.2017.1405209. Available from.
- Dong TS, Chang HH, Hauer M, Lagishetty V, Katzka W, Rozengurt E, Jacobs JP, Eibl G. Metformin alters the duodenal microbiome and decreases the incidence of pancreatic ductal adenocarcinoma promoted by diet-induced obesity. Am J Physiol - Gastrointest Liver Physiol. 2019;317:G763–72.
- Ahmadi S, Razazan A, Nagpal R, Jain S, Wang B, Mishra SP, Wang S, Justice J, Ding J, McClain DA, et al. Metformin reduces aging-related leaky gut and improves cognitive function by beneficially modulating gut microbiome/goblet cell/mucin axis. J Gerontol Ser A Biol Sci Med Sci. 2020;75:E9–21.
- Liu Z, Liao W, Zhang Z, Sun R, Luo Y, Chen Q, Li X, Lu R, Ying Y. Metformin affects gut microbiota composition and diversity associated with amelioration of dextran sulfate sodium-induced colitis in mice. Front Pharmacol. 2021;12:1–9.
- Jauvain M, Courtois S, Lehours P, Bessède E. Metformin modifies the gut microbiota of mice infected with helicobacter pylori. Pharmaceuticals. 2021;14:329.
- Li Q, He R, Zhang F, Zhang J, Lian S, Liu H. Combination of oligofructose and metformin alters the gut microbiota and improves metabolic profiles, contributing to the potentiated therapeutic effects on diet-induced obese Animals. Front Endocrinol (Lausanne). 2020;10:1–14.
- Lkhagva E, Hong J, Hong W, Tang W, Lee S. The regional diversity of gut microbiome along the GI tract of male C57BL/6 mice. BMC Microbiol. 2021;21:1–13.
- Herp S, Durai Raj AC, Salvado Silva M, Woelfel S, Stecher B. The human symbiont Mucispirillum schaedleri: causality in health and disease. Med Microbiol Immunol [Internet]. 2021;210:173–179. doi:10.1007/s00430-021-00702-9. Available from.
- Loy A, Pfann C, Steinberger M, Hanson B, Herp S, Brugiroux S, Gomes C, Boekschoten VM, Schwab C, Urich T, et al. Lifestyle and horizontal gene transfer- mediated evolution of mucispirillum schaedleri, a core member of the murine gut microbiota. mSystems. 2017;2:e00116–71.
- Bornstein S, Moschetta M, Kawano Y, Sacco A, Huynh D, Brooks D, Manier S, Fairfield H, Falank C, Roccaro AM, et al. Metformin affects cortical bone mass and marrow adiposity in diet-induced obesity in male Mice. Endocrinology. 2017;158:3369–3385.
- Zhang Q. Effects of metformin on the gut microbiota in obesity and type 2 diabetes mellitus. Diabetes Metab Syndr Obes. 2020;13:5003-5014.
- Gurung M, Li Z, You H, Rodrigues R, Jump DB, Morgun A, Shulzhenko N. Role of gut microbiota in type 2 diabetes pathophysiology. EBioMedicine [Internet]. 2020;51:102590. doi:10.1016/j.ebiom.2019.11.051. Available from.
- Borgo F, Garbossa S, Riva A, Severgnini M, Luigiano C, Benetti A, Pontiroli AE, Morace G, Borghi E. Body mass index and sex affect diverse microbial niches within the gut. Front Microbiol. 2018;9:1–12.
- Sedighi M, Razavi S, Navab-Moghadam F, Khamseh ME, Alaei-Shahmiri F, Mehrtash A, Amirmozafari N. Comparison of gut microbiota in adult patients with type 2 diabetes and healthy individuals. Microb Pathog [Internet]. 2017;111:362–369. doi:10.1016/j.micpath.2017.08.038. Available from.
- Gulnaz A, Nadeem J, Han JH, Lew LC, Dong SJ, Park YH, Rather IA, Hor YY. Lactobacillus Sps in reducing the risk of diabetes in high-fat diet-induced diabetic mice by modulating the gut microbiome and inhibiting key digestive enzymes associated with diabetes. Biology (Basel). 2021;4:348.
- Karlsson FH, Tremaroli V, Nookaew I, Bergström G, Behre CJ, Fagerberg B, Nielsen J, Bäckhed F. Gut metagenome in European women with normal, impaired and diabetic glucose control. Nature. 2013;498:99–103.
- Rooj AK, Kimura Y, Buddington RK. Metabolites produced by probiotic Lactobacilli rapidly increase glucose uptake by Caco-2 cells. BMC Microbiol. 2010;16:10.
- Santos-Marcos JA, Haro C, Vega-Rojas A, Alcala-Diaz JF, Molina-Abril H, Leon-Acuña A, Lopez-Moreno J, Landa BB, Tena-Sempere M, Perez-Martinez P, et al. Sex differences in the gut microbiota as potential determinants of gender predisposition to disease. Mol Nutr Food Res. 2019;63:1–11.
- Casimiro I, Stull ND, Tersey SA, Mirmira RG. Phenotypic sexual dimorphism in response to dietary fat manipulation in C57BL/6J mice. J Diabetes Complications [Internet]. 2021;35:107795. doi:10.1016/j.jdiacomp.2020.107795. Available from.
- Valeri F, Endres K. Frontiers in Neuroendocrinology How biological sex of the host shapes its gut microbiota. Front Neuroendocrinol [Internet]. 2021:61. Available from. doi:10.1016/j.yfrne.2021.100912.
- Kim YS, Unno T, Kim BY, Park MS. Sex differences in gut microbiota. World J Mens Health. 2020;38:48–60.
- Voigt RM, Forsyth CB, Green SJ, Engen PA Circadian rhythm and the gut microbiome [Internet]1st Elsevier Inc. 2016. Available from. doi:10.1016/bs.irn.2016.07.002.
- Leeming ER. Effect of diet on the gut microbiota: rethinking intervention duration. Nutrients. 2019;11:1–28.
- Woting A, Pfeiffer N, Loh G, Klaus S, Blaut M. Clostridium ramosum promotes high-fat diet-induced obesity in gnotobiotic mouse models. MBio. 2014;5:1–10.
- Wolin MJ, Miller TL, Collins MD, Lawson PA. Formate-Dependent growth and homoacetogenic fermentation by a bacterium from human feces: description of Bryantella formatexigens gen. nov., sp. nov. Appl Environ Microbiol. 2003;69:6321–6326.
- Silamiķele L, Silamiķelis I, Ustinova M, Kalniņa Z, Elbere I, Petrovska R, Kalniņa I, Kloviņš J. Metformin strongly affects gut microbiome composition in high-fat diet-induced type 2 diabetes mouse model of both sexes. Front Endocrinol (Lausanne). 2021;12:626359.
- Festing MFW, Overend P, Cortina Borja M, Berdoy M. The design of animal experiments: reducing the use of animals in research through better experimental design (Laboratory Animal Handbooks). Second ed. London, United Kingdom: SAGE Publications Ltd; 2016.
- Andrews S. FastQC: a quality control tool for high throughput sequence data [ Online]. 2010; Available from: http://www.bioinformatics.babraham.ac.uk/projects/fastqc/
- Ewels P, Magnusson M, Lundin S, Käller M. MultiQC: summarize analysis results for multiple tools and samples in a single report. Bioinformatics. 2016;32:3047–3048.
- Bolyen E, Rideout JR, Dillon MR, Bokulich NA, Abnet CC, Al-Ghalith GA, Alexander H, Alm EJ, Arumugam M, Asnicar F, et al. Reproducible, interactive, scalable and extensible microbiome data science using QIIME 2. Nat Biotechnol. 2019;37:852–857.
- Martin M. Cutadapt removes adapter sequences from high-throughput sequencing reads. EMBnetJournal. 2011;17:10–12.
- Callahan BJ, McMurdie PJ, Rosen MJ, Han AW, Johnson AJA, Holmes SP. DADA2: high resolution sample inference from Illumina amplicon data. Nat Methods. 2016;13:581–583.
- Quast C, Pruesse E, Yilmaz P, Gerken J, Schweer T, Yarza P, Peplies J, Glöckner FO. The SILVA ribosomal RNA gene database project: improved data processing and web-based tools. Nucleic Acids Res. 2013;41:590–596.
- Robeson MS, O’rourke DR, Kaehler BD, Ziemski M, Dillon MR, Foster JT, Bokulich NA. Rescript: reproducible sequence taxonomy reference database management. [Internet]. 2021. doi:10.1371/journal.pcbi.1009581. InternetAvailable from.
- Bokulich NA, Kaehler BD, Rideout JR, Dillon M, Bolyen E, Knight R, Huttley GA, Gregory Caporaso J. Optimizing taxonomic classification of marker-gene amplicon sequences with QIIME 2’s q2-feature-classifier plugin. Microbiome. 2018;6:1–17.
- Debelius JW, Robeson M, Hugerth LW, Boulund F, Engstrand L. A comparison of approaches to scaffolding multiple regions along the 16S rRNA gene 1 for improved resolution 2. bioRxiv [Internet]. 2021:2021.03.23.436606. Available from. doi:10.1101/2021.03.23.436606.
- Fuks G, Elgart M, Amir A, Zeisel A, Turnbaugh PJ, Soen Y, Shental N. Combining 16S rRNA gene variable regions enables high-resolution microbial community profiling. Microbiome. 2018;6:1–13.
- Mirarab S, Nguyen NW. SEPP: sATé-enabled phylogenetic placement. Pac Symp Biocomput. 2012;1:247–258.
- McMurdie PJ, Holmes S. Phyloseq: an R package for reproducible interactive analysis and graphics of microbiome census data. PLoS One. 2013;8:e61217.
- Barnett D, Arts I, Penders J. microViz: an R package for microbiome data visualization and statistics. J Open Source Softw. 2021;6:3201.
- Hunter JD. Matplotlib: a 2D graphics environment. Comput Sci Eng. 2007;9:90–95.
- Wickham H. Ggplot2: elegant graphics for data analysis. New York, USA: Springer-Verlag New York;2016.
- Lin H, Das Peddada S. Analysis of compositions of microbiomes with bias correction. Nat Commun [Internet]. 2020;11:1–11. doi:10.1038/s41467-020-17041-7. Available from.
- McKinney W. Data structures for statistical computing in python. Proc 9th Python Sci Conf. 2010;1:56–61.