
ABSTRACT
The gut microbiota affects hepatic drug metabolism. However, gut microbial factors modulating hepatic drug metabolism are largely unknown. In this study, using a mouse model of acetaminophen (APAP)-induced hepatotoxicity, we identified a gut bacterial metabolite that controls the hepatic expression of CYP2E1 that catalyzes the conversion of APAP to a reactive, toxic metabolite. By comparing C57BL/6 substrain mice from two different vendors, Jackson (6J) and Taconic (6N), which are genetically similar but harbor different gut microbiotas, we established that the differences in the gut microbiotas result in differential susceptibility to APAP-induced hepatotoxicity. 6J mice exhibited lower susceptibility to APAP-induced hepatotoxicity than 6N mice, and such phenotypic difference was recapitulated in germ-free mice by microbiota transplantation. Comparative untargeted metabolomic analysis of portal vein sera and liver tissues between conventional and conventionalized 6J and 6N mice led to the identification of phenylpropionic acid (PPA), the levels of which were higher in 6J mice. PPA supplementation alleviated APAP-induced hepatotoxicity in 6N mice by lowering hepatic CYP2E1 levels. Moreover, PPA supplementation also reduced carbon tetrachloride-induced liver injury mediated by CYP2E1. Our data showed that previously known PPA biosynthetic pathway is responsible for PPA production. Surprisingly, while PPA in 6N mouse cecum contents is almost undetectable, 6N cecal microbiota produces PPA as well as 6J cecal microbiota in vitro, suggesting that PPA production in the 6N gut microbiota is suppressed in vivo. However, previously known gut bacteria harboring the PPA biosynthetic pathway were not detected in either 6J or 6N microbiota, suggesting the presence of as-yet-unidentified PPA-producing gut microbes. Collectively, our study reveals a novel biological function of the gut bacterial metabolite PPA in the gut-liver axis and presents a critical basis for investigating PPA as a modulator of CYP2E1-mediated liver injury and metabolic diseases.
Introduction
The hepatic metabolism of xenobiotics, including drugs, is a critical part of the physiological processes that eliminate potentially harmful chemicals from the body. In general, oxidative reactions mediated by phase-I cytochrome P450 enzymes convert chemicals to more hydrophilic and supposedly less toxic intermediates, which are further converted to readily excretable forms via phase II reactions such as glucuronidation and sulfation. However, the cytochrome P450-mediated metabolism of certain xenobiotics, such as acetaminophen (APAP) and carbon tetrachloride, results in the formation of reactive metabolites that often cause deadly hepatotoxicity.Citation1,Citation2 Drug-induced liver injury is a significant cause of acute liver failure, accounting for 20–40% of all fulminant hepatic failure requiring liver transplantation.Citation3,Citation4
APAP is a medication used to reduce fever and pain and is generally considered a safe drug; however, accidental or intentional APAP overdose has been the leading cause of acute liver failure, and more than 50% of drug-induced acute liver injury has been reported to be due to APAP overdose in the US.Citation5,Citation6 Moreover, some individuals are susceptible to APAP-induced hepatotoxicity even at therapeutic doses.Citation7,Citation8 The majority of APAP ingested is eliminated in the urine as sulfate or glucuronide conjugates formed by hepatic phase II enzymes, but a small fraction is converted to its reactive metabolite N-acetyl-p-benzoquinone imine (NAPQI) by hepatic cytochrome P450 (CYP)2E1 and CYP1A2.Citation9 NAPQI, as a strong electrophile and oxidant, rapidly depletes cytoplasmic and mitochondrial glutathione (GSH) in the liver; excess NAPQI covalently binds to macromolecules (forming APAP adducts), triggering oxidative stress and inducing signal transduction pathways converging to activation (i.e., phosphorylation) of c-Jun-N-terminal kinase (JNK). Translocation of phosphorylated JNK to mitochondria and sustained JNK activation result in mitochondrial dysfunction, ultimately causing cell necrosis.Citation10
Development of fulminant liver failure after APAP ingestion exhibits large interindividual variability, but the mechanisms underlying the idiosyncratic nature of APAP hepatotoxicity remain unclear.Citation11,Citation12 While several risk factors have been reported (including age, dose, alcohol consumption, time to treatment, and co-medications), about half of the variability remains unexplained.Citation13 Several lines of evidence in mouse and human models suggest that altered gut microbiota may impact host susceptibility to APAP-induced hepatotoxicity. For example, metabolomic profiling of human urine samples collected before and after APAP administration (at a therapeutic dose) suggested that a gut bacterial metabolite p-cresol may compete with APAP sulfation, potentially diverting APAP toward cytochrome P450-mediated bioactivation.Citation14 The diurnal variation in the mouse gut microbiota was associated with altered susceptibility to APAP hepatotoxicity.Citation15,Citation16 The probiotic Lactobacillus rhamnosus GG alleviated APAP hepatotoxicity in part by the activation of nuclear factor erythroid 2-related factor 2 (NRF2), a master regulator of the antioxidant response.Citation17,Citation18 Lastly, the gut microbiota was shown to activate Toll-like receptors (TLRs) and their downstream MYC-mediated transcriptional changes in neighboring (stellate, endothelial, and Kupffer) cells of hepatocytes, increasing the susceptibility to APAP hepatotoxicity.Citation19 These studies indicate that changes in the gut microbiota impact APAP hepatotoxicity through multiple pathways, and highlight the value of APAP-induced hepatotoxicity as a model for identifying factors that mediate host-gut microbiota interactions.
In this study, we systematically compared genetically similar C57BL/6 mice carrying different gut microbiotas from two vendors, Jackson Laboratory (6J) and Taconic Biosciences (6N), regarding their susceptibility to APAP-induced hepatotoxicity. We found that 6N mice were more susceptible to APAP hepatotoxicity than 6J mice, and such difference disappeared upon the co-housing of 6J and 6N mice. Moreover, the susceptibility difference between conventional 6J and 6N mice was recapitulated by cecal microbiota transplantation into germ-free mice. Comparative untargeted metabolomic analysis of mouse portal vein sera and liver tissues led to identifying 19 metabolites whose abundances differ between 6J and 6N mice. Interestingly, 4 of the 10 metabolites more abundant in 6J mice, including phenylpropionic acid (PPA), were gut bacterial metabolic products of l-phenylalanine (l-Phe). We show that PPA supplementation in 6N mice decreased susceptibility to APAP-induced hepatotoxicity by lowering hepatic CYP2E1 levels, resulting in decreased APAP bioactivation. PPA supplementation also reduced CYP2E1-mediated hepatotoxicity by carbon tetrachloride. Our data indicate that as-yet-unknown gut bacteria carrying the previously known PPA-producing biosynthetic pathway are present in both gut microbiotas. Strikingly, while both 6J and 6N gut microbiotas produce PPA to a similar extent in vitro, PPA production in 6N gut microbiota is suppressed in vivo. This study presents a novel biological function of the gut bacterial metabolite PPA as a modulator of host response (i.e., susceptibility) to APAP and provides a basis for investigating the effects of PPA in other CYP2E1-mediated liver injuries.
Results
Differential gut microbiota modulates host susceptibility to APAP hepatotoxicity
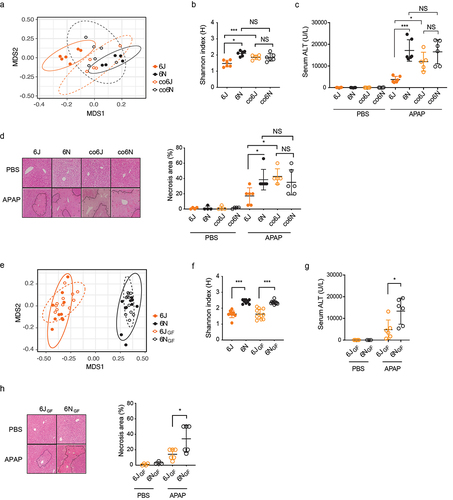
To establish whether differential gut microbiota modulates host susceptibility to APAP hepatotoxicity, we first used male C57BL/6 mice from two different vendors [Jackson Laboratory (6J) and Taconic Biosciences (6N)]. These genetically similar mice from the two different vendors were shown to harbor distinct gut microbiotas.Citation20 Considering the inter-laboratory and animal-facility variations in the susceptibility threshold to fulminant APAP hepatotoxicity, we determined an APAP dose that causes prominent hepatotoxicity in both vendors’ mice. Mice were treated with 100, 200, or 300 mg/kg APAP (or PBS) via intraperitoneal injection and sacrificed 24 h after treatment. Serum ALT levels were measured as a marker of liver damage. Both 6J and 6N mice treated with 100 mg/kg APAP did not exhibit hepatotoxicity as compared to mice treated with vehicle control (PBS). While the APAP dose of 200 mg/kg increased hepatotoxicity in about half of the mice treated, the severity of APAP hepatotoxicity was similar between 6J and 6N mice (Figure S1A). On the other hand, the mice treated with 300 mg/kg APAP displayed severe hepatotoxicity that differentiated 6J and 6N mice. At the APAP dose of 300 mg/kg, hepatotoxicity (i.e., serum ALT level) was much greater in 6N than in 6J male mice (Figure S1B). A similar trend was observed in female mice, although the severity of APAP hepatotoxicity was less in female mice than in male mice (Figure S1B), consistent with the previous reports.Citation21,Citation22 Subsequent studies for APAP hepatotoxicity were performed using male mice and an APAP dose of 300 mg/kg.
To determine whether differential gut microbiota contributes to the difference in APAP hepatotoxicity between 6J and 6N mice, 6J and 6N mice were cohoused for four weeks (a process known to assimilate gut microbiota of miceCitation23) and challenged with APAP. This created two additional groups of mice, namely co6J (6J mice cohoused with 6N) and co6N (6N mice cohoused with 6J). At the end of the 4-week cohousing, fecal samples were collected from each mouse, and their gut microbiotas were analyzed by 16S rRNA gene amplicon sequencing. Nonmetric multidimensional scaling (NMDS) plot showed that the fecal microbiota of 6J mice was well separated from that of 6N mice (p = 0.001, ANOSIM), while co6J and co6N groups co-clustered (p = 0.149, ANOSIM) (), indicating that 6J and 6N mice indeed had distinct gut microbiotas and that co-housing abrogated such difference. Similarly, the difference in Shannon index (α-diversity; an indicator of species richness) between 6J and 6N fecal microbiotas disappeared upon cohousing (). Importantly, the difference in the serum ALT levels and hepatic necrosis between 6J and 6N mice disappeared upon co-housing, with the susceptibility of co6J mice to APAP hepatotoxicity becoming similar to that of 6N mice () and corresponding changes in tissue necrosis (). To determine whether the susceptibility to APAP hepatotoxicity is transferrable by the gut microbiota, respective cecal microbiotas from 6J and 6N mice were transplanted into germ-free (GF) C57BL/6 mice and these conventionalized GF mice were tested for APAP hepatotoxicity. Pooled cecal contents from 6J or 6N mice were orally gavaged into GF mice, followed by 4-week conventionalization (generating 6JGF and 6NGF groups, respectively). Fecal sample analysis by 16S rRNA gene amplicon sequencing revealed that the fecal microbiotas of 6JGF and 6NGF mice were distinct (p = 0.001, ANOSIM) and co-clustered with those of their respective donor groups (). Also, Shannon indexes of 6JGF and 6NGF fecal microbiotas were similar to those of their respective donor mice (), indicating that cecum material transplantation successfully established the donor’s microbiota in GF mice. When challenged with APAP, 6NGF mice had higher serum ALT levels () and greater hepatic necrosis than 6JGF mice (), recapitulating the phenotypes observed in conventional 6J and 6N mice. Collectively, these results demonstrate that differential gut microbiota modulates host susceptibility to APAP-induced hepatotoxicity.
Figure 1. Differential gut microbiota modulates susceptibility to APAP-induced hepatotoxicity.
Untargeted metabolomics identifies 3-phenylpropionic acid (PPA) as a candidate gut bacterial metabolite modulating APAP hepatotoxicity
A few gut microbial metabolites have been reported or suggested to affect APAP hepatotoxicity. The gut bacterial metabolite p-cresol was proposed to competitively inhibit APAP sulfation when APAP is administered at a therapeutic dose in healthy individuals, potentially diverting greater amounts of APAP toward cytochrome P450-mediated bioactivation and possibly resulting in greater hepatotoxicity.Citation14 We determined that basal hepatic p-cresol sulfate levels were higher in 6N than in 6J mice (Figure S2A). On the other hand, hepatic APAP-sulfate levels (measured 15 min after APAP dosing) were similar between 6J and 6N mice and about 1000-fold higher than the hepatic p-cresol sulfate levels (Figure S2B compared to Figure S2A), suggesting that at a toxic dose of APAP (i.e., 300 mg/kg), the competition of APAP sulfation by p-cresol is unlikely at least in the mouse models used in this study. Short-chain fatty acids (SCFAs; acetate, propionate, and butyrate) are major metabolic products of gut bacterial fermentation of carbohydrates, with various beneficial effects on host physiology.Citation24 A recent study has suggested that SCFAs may ameliorate APAP hepatotoxicity by improving intestinal gut barrier function.Citation25 However, the cecum levels of acetate and butyrate were similar between 6J and 6N as well as between 6JGF and 6NGF mice (Figure S2C). Moreover, while cecal propionate levels were higher in 6J than in 6N mice, their levels were similar between 6JGF and 6NGF mice (Figure S2C). These results suggest minor roles of SCFAs, if any, in modulating APAP hepatotoxicity in our mouse models.
For de novo identification of gut microbial metabolites potentially responsible for the differential host susceptibility to APAP hepatotoxicity (), portal vein sera and liver tissues collected from 6J and 6N mice, as well as from 6JGF and 6NGF mice, were analyzed via LC-MS/MS-based untargeted metabolomic profiling. Corresponding samples from GF mice were included as controls. A total of 669 and 789 metabolites of known identity were detected in the liver and portal vein serum samples, respectively. A majority (568) of the metabolites identified were found in both liver and portal vein serum samples. Principal component analysis (PCA) of the metabolites identified from the liver and portal vein serum samples, respectively, revealed good separation between conventional (6J and 6N) and conventionalized (6JGF and 6NGF) mouse groups (), potentially reflecting differences in mouse husbandry at different facilities (i.e., University of Illinois at Chicago and the University of Chicago for the conventional mice and the conventionalized GF mice, respectively). Additional separation was observed between 6J and 6N groups, as well as between 6JGF and 6NGF groups. Hierarchical clustering analysis revealed the separation of samples by colonization status (i.e., conventional vs. conventionalized vs. GF). 6JGF and 6NGF samples were intermixed but showed group-related sub-clustering. Taken together, the results from the metabolomic analyses indicate that the differences in the gut microbiota dictate host metabolomic profiles.
Figure 2. Identification of gut microbial metabolites potentially associated with differential susceptibility to APAP-induced hepatotoxicity using untargeted metabolomics.
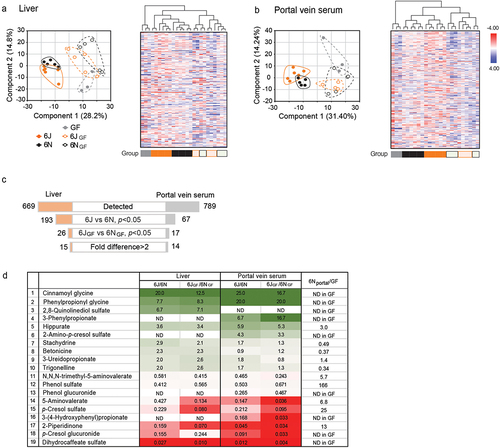
To identify gut microbial metabolites that are potentially linked to the differential APAP hepatotoxicity, the metabolome data were filtered through multiple layers of selection criteria (). First, we selected metabolites whose abundances differ between 6J and 6N (either liver or portal vein serum) samples with statistical significance (p < 0.05). Second, by comparing their directional abundance (i.e., higher or lower in 6J or 6N) with that between 6JGF and 6NGF mice, only the metabolites exhibiting the same trend in the conventional and the conventionalized mice were selected. As a result, a total of 26 and 17 metabolites were identified in the liver and portal vein serum samples, respectively, and 15 from the liver and 14 from the portal vein serum samples showed > 2-fold differences, with 10 metabolites overlapped between the two samples. This resulted in the compilation of 19 metabolites as potential candidates for modulating APAP hepatotoxicity (). Of 19 candidate metabolites, the abundance of four metabolites (i.e., stachydrine, betonicine, 3-ureidopropionate, and trigonelline) was either higher in GF mice or similar between the portal vein serum samples of conventional and GF mice, suggesting that either the host or diet is a source, and these four metabolites were excluded from further analysis. The remaining 15 metabolites were either undetectable in GF portal vein serum or detected with signal intensities less than one-third of those in conventional mice, suggesting that they are solely or primarily produced by the gut microbiota. These 15 candidate metabolites included p-cresol sulfate; the signals for p-cresol sulfate were higher in 6N than in 6J mouse liver (), consistent with our previous independent measurement (Figure S2A) and supporting the robustness of the metabolome analysis. Of the 15 candidate metabolites, our follow-up analysis was focused on six metabolites whose abundances were higher in 6J mice ().
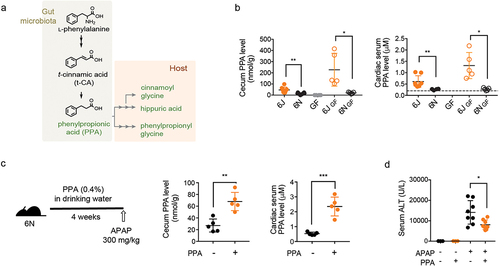
Notably, four of the six metabolites more abundant in 6J mice were derived from an l-phenylalanine (l-Phe) metabolic pathway previously defined in several gut bacteria:Citation26,Citation27 3-phenylpropionic acid (PPA), phenylpropionyl glycine, cinnamoyl glycine, and hippuric acid (). l-Phe is metabolized by gut bacteria to trans-cinnamic acid (t-CA) and subsequently to PPA. Once absorbed, PPA undergoes β-oxidation, with hippuric acid as the final product and cinnamoylglycine as a potential intermediate.Citation28,Citation29 Alternatively, PPA can be conjugated with glycine by hepatic glycine N-acyltransferase to phenylpropionylglycine.Citation28,Citation29 We validated the metabolomics results by independently measuring the levels of l-Phe-derived metabolites (t-CA and PPA) in cecum contents. Consistent with the metabolomics data, t-CA was undetectable in the cecal contents of, in particular, 6J mice (data not shown), likely due to the rapid conversion of t-CA to PPA by gut bacteria.Citation26,Citation30 t-CA was also undetectable in the liver tissue and portal vein samples (data now shown), suggesting that t-CA may not be the source of cinnamoylglycine detected in the host tissue. PPA was undetectable in GF mouse cecal contents (), supporting the notion that PPA is solely produced by gut bacteria. On the other hand, PPA was readily detected in the conventional mouse cecum contents (), and its levels in 6J and 6JGF mice (46 ± 26 and 227 ± 147 nmol/g cecal content, respectively) were comparable to the previously reported values in feces from healthy individuals (i.e., 267 nmol/g feces).Citation31 PPA levels in 6J and 6JGF mice were 3.3- and 11-fold higher than those of 6N (14 ± 8 nmol/g cecal content) and 6NGF (20 ± 7 nmol/g cecal content) mice, respectively (). Similar results were obtained with cardiac (i.e., systemic) and portal vein blood samples ( and S3A). Cecal PPA levels were well correlated with those in the portal vein (or cardiac) blood (Figures S3B and S3C), suggesting that PPA levels in the gut govern the host exposure to PPA. Collectively, these results suggested PPA as a candidate gut bacterial metabolite that potentially modulates susceptibility to APAP hepatotoxicity.
Figure 3. The gut bacterial metabolite, phenylpropionic acid (PPA), alleviates APAP hepatotoxicity.
PPA reduces APAP hepatotoxicity
To determine whether PPA reduces the susceptibility of 6N mice to APAP hepatotoxicity, 6N mice were fed PPA (0.4% in drinking water) for four weeks, followed by APAP administration. We aimed to increase PPA exposure in 6N mice by about fivefold and chose the PPA amount in drinking water based on (1) the average volume of daily water consumption for a mouse and (2) the previously reported pharmacokinetic information about t-CA (because the relevant information for PPA was not available).Citation32 PPA supplementation had no effects on the amount of water intake or the body weight gain of the mice (Figure S3D). The PPA dose used in this study led to ~ threefold increases in the cecum and cardiac serum PPA levels in 6N mice (), the levels approximating those in 6J mice (). Also, PPA supplementation led to a significant increase in cinnamoylglycine levels in the mouse liver tissue (Figure S3E), suggesting that gut microbiota-derived PPA (rather than t-CA) is likely the major source of cinnamoylglycine detected in the host tissue.Citation28,Citation29 When challenged with APAP, the PPA-fed 6N mice exhibited significantly lower hepatotoxicity at 24 h post-APAP compared with the control mice ( and S3F), indicating that PPA alleviates APAP hepatotoxicity.
PPA represses basal hepatic CYP2E1 expression
To define the underlying mechanism of PPA-mediated alleviation of APAP hepatotoxicity, we set out to identify the step(s) during the progression of APAP hepatotoxicity that is affected by PPA treatment. To this end, 6N mice were fed PPA in drinking water (0.4% w/v) for four weeks, challenged with APAP (300 mg/kg), and sacrificed at multiple time points. Serum ALT levels increased dramatically at 6 h post-APAP treatment in both control and PPA-fed mice, but the magnitude of increase was about twofold lower in PPA-fed mice (), suggesting that PPA may act on the initiation and early propagation of APAP hepatotoxicity. GSH depletion and APAP-protein adduct formation after APAP bioactivation are critical events in initiating APAP hepatotoxicity.Citation33 Both control and PPA-fed mice exhibited a near-complete GSH depletion within 30 min after APAP administration (). However, the maximum APAP-protein adduct levels at 2 h post-APAP treatment were significantly lower in the PPA-fed mice when estimated by measuring APAP-CYS produced by protease digestion of liver homogenates () or by detecting APAP-bound proteins via western blot (Figure S4A), suggesting that PPA may decrease the rate/extent of APAP bioactivation. The phosphorylated JNK was also reduced upon PPA supplementation (Figure S4A). These changes were accompanied by minimal changes in the overall APAP pharmacokinetic profiles (), consistent with the previous report that NAPQI formation is the minor elimination route of APAP.Citation1 Of note, the rate of hepatic GSH recovery was faster, and the GSH levels attained after recovery was higher in PPA-fed mice than control 6N mice, potentially due to greater induction of glutamate-cysteine ligase catalytic unit (Gclc; the rate-limiting enzyme in GSH synthesis) at 6 h post-APAP treatment (Figure S4B). Collectively, these results hinted that PPA likely exerts its effect on an initial step, i.e., the formation of NAPQI that triggers APAP hepatotoxicity.
Figure 4. Phenylpropionic acid (PPA) alleviates APAP hepatotoxicity by lowering CYP2E1 levels.
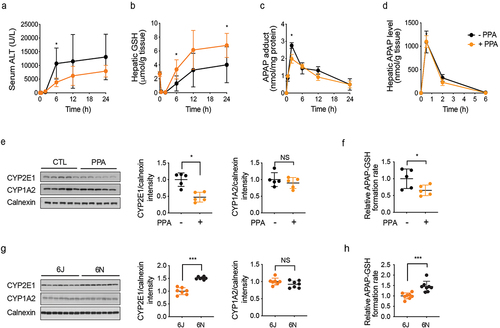
CYP2E1 is the major enzyme responsible for APAP conversion to NAPQI in both mice and humans,Citation34,Citation35 while CYP1A2 can also contribute to NAPQI formation.Citation36 We measured CYP2E1 and CYP1A2 protein levels in the livers of PPA-fed and control 6N mice using western blot. The specificity of the CYP2E1 antibody was validated using liver tissue lysates from Cyp2e1-null mice (Figure S4C). Basal protein expression levels of CYP2E1 but not CYP1A2 in hepatic microsomes (the endoplasmic reticulum fraction) were about twofold lower in PPA-fed mice compared with those in the control mice (). Consistent with this result, APAP bioactivation (as measured by the formation rate of APAP-GSH from the incubation of hepatic microsome with APAP and GSH) was 1.5-fold lower in the PPA-fed mice (). In line with decreased APAP bioactivation, hepatic levels of APAP-GSH (produced upon GSH neutralization of NAPQI) were lower in the PPA-fed mice at 0.5 h post-dosing, although the difference disappeared at 2 h (Figure S4D). The hepatic levels of APAP-mercapturic acid (APAP-NAC) and APAP-CYS were also similar between the groups, likely because the amount of APAP-GSH formed is limited by hepatic GSH contents and GSH is depleted within 2 h in both groups.
In addition to the endoplasmic reticulum, CYP2E1 proteins have also been detected in the hepatic mitochondria;Citation37 however, we did not detect CYP2E1 in mitochondrial fractions isolated from mouse liver tissues (Figure S4E). Interestingly, the hepatic mRNA levels of Cyp2e1 were similar between the control and PPA-fed mice (Figure S4F). This suggests that PPA alleviates APAP hepatotoxicity, at least in part, by decreasing hepatic CYP2E1 protein levels, likely via posttranscriptional regulation. In parallel, we examined whether PPA supplementation alters the gut microbiota by 16S rRNA gene amplicon sequencing of mouse cecum contents from the control and PPA-fed mice. The control and PPA-fed mice co-clustered on the NMDS plot (Figure S4G), and no bacterial taxa were identified to be different in relative abundance between the two groups, suggesting that PPA supplementation had little effect on gut microbiota composition.
The above results from comparing the control and PPA-fed 6N mice suggested that the lower susceptibility of 6J than 6N mice to APAP hepatotoxicity may be related to a difference in CYP2E1 protein expression levels. To examine this possibility, CYP2E1 protein levels in hepatic microsomes were compared between 6J and 6N mice as well as between 6JGF and 6NGF. Indeed, CYP2E1 protein levels were significantly lower in both 6J and 6JGF mice than in 6N and 6NGF mice ( and S4H). Consistently, the APAP-GSH formation rate was significantly lower in hepatic microsomes from 6J than those from 6N mice (). Moreover, lower CYP2E1 activity in 6J as compared to 6N mice was observed by using a CYP2E1 probe substrate, chlorzoxazone (Figure S4I). The differences in the time profile pattern of APAP-protein adduct formation and JNK phosphorylation between 6J and 6N were similar to those observed between PPA-fed and control 6N mice ( and S4A vs. Figures S4J and S4K). The time profiles for APAP oxidation products (i.e., APAP-GSH, APAP-NAC, and APAP-CYS) were also comparable (Figures S4D vs. S4L). While serum ALT levels differed between the control and PPA-fed mice at 6 h, the ALT disparity between 6J and 6N mice manifested at a much later time point (i.e., 24 h) ( vs. Figures S4J), potentially due to (1) smaller differences in CYP2E1 expression between 6J and 6N and/or (2) the contribution of other mechanisms distinct from CYP2E1 expression to altered susceptibility between 6J and 6N. Collectively, these results support the notion that higher gut PPA levels and lower hepatic CYP2E1 expression may contribute to the lower susceptibility of 6J mice (as compared to 6N) to APAP hepatotoxicity.
Previous studies have shown that the turnover rates of CYP2E1 proteins can be modulated by CYP2E1 binding to its substrates or inhibitors.Citation38–40 However, when examined with mouse hepatic microsomes, PPA did not inhibit CYP2E1-mediated metabolism of chlorzoxazone, while a known CYP2E1 substrate p-nitrophenol competitively inhibited chloroxoazone hydroxylation (Figure S4M), suggesting that PPA is not a CYP2E1 substrate. Carbon tetrachloride is another chemical that causes liver injury via the CYP2E1-mediated formation of reactive metabolitesCitation2. We examined the effects of PPA on carbon tetrachloride-induced hepatotoxicity in mice and observed that PPA supplementation (4 weeks) significantly decreased serum ALT levels after carbon tetrachloride dosing (Figure S4N). A previous study reported the protective effect of the probiotic L. rhamnosus GG against APAP hepatotoxicity via the activation of the NRF2 antioxidant response pathway.Citation18 To examine whether PPA activates NRF2, a reporter assay was performed using a luciferase expression system driven by an antioxidant response element that binds NRF2. Quercetin, a known NRF2 activator, led to a robust increase in promoter activity; however, PPA did not induce promoter activity at a concentration as high as 10 mM (Figure S4O), indicating that PPA does not activate NRF2.
Mouse gut microbiota harbors as-yet-unidentified PPA-producing gut bacteria
To identify the gut bacterial taxa potentially responsible for the differential PPA production between 6J and 6N mice, we examined the microbiotas in cecal contents from 6J and 6N mice using 16S rRNA gene amplicon sequencing. Consistent with the analyses of the fecal microbiotas between 6J and 6N as well as between 6JGF and 6NGF (), NMDS plot showed a clear separation between the cecal microbiotas of 6J and 6N mice (Figure S5A), and Shannon index was significantly higher in 6N than 6J mice (Figure S5B). At the phylum level, the 6J cecal microbiota had a higher abundance of Bacteroidetes, whereas Firmicutes are more abundant in the 6N cecal microbiota (Figure S5C). The linear discriminant analysis (LDA) effect size (LEfSe) analysis confirmed the differential abundance of bacteria at the phylum and species levels between 6J and 6N mice (Figure S5D). These results, however, did not reveal any gut bacteria previously known to produce PPA.
Four gut bacterial species, all belonging to the Firmicutes phylum (Clostridium sporogenes; C. cadaveris; C. botulinum; and Peptostreptococcus anaerobius), are known to produce PPA through a common l-Phe reductive pathway consisting of four enzymes encoded by the aat, fldBC, fldH, and acdA genes (called the Fld pathway hereafter).Citation26,Citation41 To determine if 6J and 6N gut microbiotas contain known gut bacteria harboring the Fld pathway, we performed PCR with either 6J or 6N cecal DNA as a template and four different pairs of primers, each pair detecting one of the four known fldC genes (Table S2). For C. sporogenes detection, C. sporogenes genomic DNA and cecal DNA from 6N mice orally inoculated with C. sporogenes were used as controls. For the remaining three bacteria, respective genomic DNA was used. Under our PCR conditions and assuming one copy of genomic DNA per bacterial cell, the detection limits were determined to be 125 cells for C. cadaveris, 296 for C. sporogenes, 1088 for C. botulinum, and 2407 for P. anaerobius (Table S3). Surprisingly, none of the four known fldC genes was detected in either 6J or 6N cecal DNA (Figure S5E). This result explains why the composition analysis of the cecal microbiota did not retrieve previously known PPA-producing gut bacteria and suggests that as-yet-unidentified PPA-producing gut bacteria exist in the mouse gut microbiota.
The gut microbiotas of both 6J and 6N mice metabolize l-Phe to PPA through the same biosynthetic pathway in vitro, but PPA biosynthesis in 6N mice is suppressed in vivo
l-Phe is a primary precursor of PPA, and l-Phe levels in the gut are mainly governed by proteolytic digestion of dietary proteins and gut microbial l-Phe production (pathways 1 and 2 in ).Citation29 To examine whether l-Phe availability governs cecal PPA pool size, l-Phe levels were measured in the cecum contents of 6J and 6N mice using LC-MS/MS. Cecal l-Phe levels were lower in 6J than in 6N mice (), suggesting that the gut microbiota of 6J mice may have a higher capacity to convert l-Phe to PPA than that of 6N mice and that l-Phe availability is unlikely a limiting factor for PPA production in 6N mice.
Figure 5. 6N cecal microbiota produces PPA as well as 6J cecal microbiota in vitro via a known l-Phe reductive pathway.
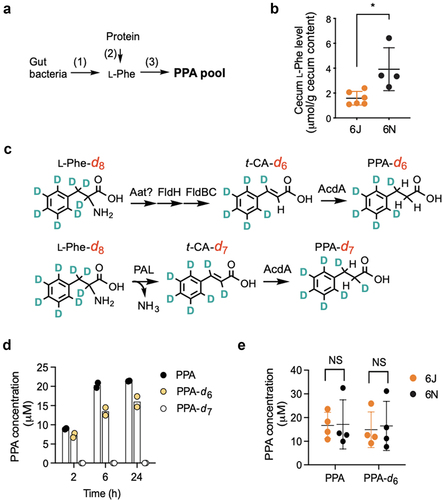
There are two known bacterial pathways for PPA production from l-Phe: (1) the Fld pathway involving multiple enzymes as mentioned above and (2) a pathway involving a single enzyme, l-Phe ammonia-lyase (PAL) (called the PAL pathway) (). In both pathways, l-Phe is metabolized to t-CA, which is further converted to PPA by an enzyme such as acyl-CoA dehydrogenase (AcdA). As mentioned above, the Fld pathway has been identified and characterized in four anaerobic gut bacteria.Citation26,Citation41 PAL enzymes have been found in terrestrial,Citation42–44 aquatic,Citation45 and nematode gut bacteriaCitation46 but have not been reported in mammalian gut bacteria. To determine if the Fld or PAL pathway mediates PPA production, we used an isotope-labeled l-Phe-d8 as a substrate and measured PPA-d6 and PPA-d7 as indicators of Fld and PAL-mediated PPA production, respectively, using LC-MS/MS (). In parallel, we also measured total PPA production from l-Phe. We validated this approach with C. sporogenes known to have the Fld pathway. When C. sporogenes was incubated with l-Phe-d8, we only observed the production of PPA-d6, confirming that C. sporogenes uses the Fld pathway for PPA production (Figure S5F).
Upon incubation with mouse cecal bacteria suspension, PPA production from l-Phe increased over time and saturated between 2 h and 6 h (). Note that the total PPA produced was slightly higher than the total PPA-d6 produced, likely indicating that total PPA is the sum of PPA produced from both intracellular and extracellular l-Phe. Similar to the incubation with C. sporogenes, cecal bacteria suspension incubated with l-Phe-d8 produced significant amounts of PPA-d6 (at ~75% of total PPA), while PPA-d7 was undetectable. These results suggest that under our test conditions, the Fld pathway is the primary route of l-Phe to PPA conversion in 6J mouse cecal bacteria.
To examine whether the PPA production rate correlates with cecal PPA levels in mice, we collected cecum contents from 6J and 6N mice and measured PPA levels in an aliquot. From the rest of the cecal contents, cecal bacteria suspensions were prepared, and the PPA production rate was measured by incubating them with either l-Phe or l-Phe-d8 as a substrate. In line with our previous results (), PPA levels were significantly higher in the cecum contents of 6J than those of 6N mice (Figure S5G). Surprisingly, however, the amounts of total PPA and PPA-d6 (produced from l-Phe and l-Phe-d8, respectively) at 2 h were similar between 6J and 6N mice (). This result suggests that the gut microbiota of 6N mice harbors as-yet-unidentified bacterial species capable of producing PPA from l-Phe via the Fld pathway in vitro and indicates that PPA production in the gut microbiota of 6N mice is suppressed in vivo.
Discussion
In this study, we found that 6N mice are more susceptible to APAP hepatotoxicity than 6J mice. Genetic drifts between substrains of C57BL/6 mice, such as a loss-of-function mutation in nicotinamide nucleotide transhydrogenase (Nnt) in 6J mice,Citation47 may partly explain the differential susceptibility to APAP hepatotoxicity.Citation48,Citation49 Under basal conditions, NNT regenerates NADPH from NADH supporting the mitochondrial antioxidant defense. Mitochondrial dysfunctions, however, can reverse the NNT reaction (NADPH → NADH) such that the functional NNT may contribute to impaired oxidative defense.Citation50 Thus, defective NNT in 6J mice may contribute to lower APAP hepatotoxicity by ameliorating the sequela of mitochondria dysfunction triggered by APAP. Importantly, however, our results support the idea that nongenetic factors also contribute to the variations in the mouse susceptibility to APAP-induced hepatotoxicity. Cohousing of 6J and 6N mice abrogates the differences in the susceptibility to APAP hepatotoxicity. Furthermore, the differences in susceptibility are transferable by gut microbiota transplantation into GF mice. These results strongly support the idea that differential gut microbiota significantly contributes to the variations in the susceptibility to APAP-induced hepatotoxicity in mice.
A few gut microbiota-derived metabolites are associated with altered host susceptibility to APAP hepatotoxicity. p-Cresol (a gut bacterial metabolic product of tyrosine) is readily conjugated by host sulfotransferases, and the resulting product p-cresol sulfate is eliminated by urinary excretion.Citation51 Among individuals taking a therapeutic dose of APAP, p-cresol sulfate level in urine was negatively correlated with urinary APAP-sulfate contents,Citation14 leading to the proposal that p-cresol may compete with APAP for sulfation. We found, however, that the hepatic levels of APAP-sulfate were 1000-fold higher than those of p-cresol sulfate and similar between 6J and 6N mice, suggesting that APAP at high doses likely overcomes the competition by p-cresol. Therefore, the contribution of p-cresol to the differential mouse susceptibility to APAP hepatotoxicity appears to be minimal, if any. Another gut bacterial metabolite 1-phenyl-1,2-propanedione (PPD) was shown to be associated with a diurnal fluctuation of APAP-induced hepatotoxicity in mice.Citation16 PPD is a volatile chemical present in plants (e.g., coffee),Citation52 and it has also been shown to be produced by several human gut bacteria.Citation16 Higher PPD levels during the night than in the daytime were correlated with increased APAP-induced hepatotoxicity, and PPD treatment was shown to decrease hepatic GSH levels in mice.Citation16 However, PPD in the cecum contents was not measurable due to its low levels (i.e., ~0.05 nmol/g cecum).Citation16 Also, we found that the basal hepatic GSH levels were similar between PPA-fed and control 6N mice (and between 6J and 6N), indicating that the contribution of PPD to the differential mouse APAP hepatotoxicity is insignificant. Lastly, the protective effect of the probiotic L. rhamnosus GG against APAP hepatotoxicity was shown to be mediated by its metabolite 5-methoxyindoleacetic acid that activates the NRF2 antioxidant response pathway.Citation18 In our untargeted metabolomic analysis of mouse liver tissue and portal vein serum samples, however, 5-methoxyindoleacetic acid was not detected. Because PPA and 5-methoxyindoleacetic acid target different cellular pathways, it will be interesting to test whether PPA synergizes the protective effects of probiotic L. rhamnosus GG against APAP-induced hepatotoxicity.
The effect of PPA on host physiology is largely unknown, despite high PPA concentrations in the mouse cecum (up to ~400 nmol/g cecum content detected in our study) and human stool (267 nmol/g feces).Citation31 PPA is also used as a food flavorant and preservative, although the estimated daily intake in humans (3–150 nmol/day)Citation53 appears to be too low to contribute significantly to host PPA exposure. A recent functional screening of gut bacterial metabolites for direct agonism of 241 G-protein coupled receptors (GPCRs) has identified PPA as an agonist of GPR109B (aka HCA3) with an EC50 of 208 μM.Citation54 GPR109B is a human-specific GPCR that is also shown to sense other bacterial metabolites such as d-phenyllactic acid with an EC50 of 150 nM.Citation55 GPCRs are well known to have overlapping specificity for the same ligand,Citation56 and the possibility that the protective effect of PPA against APAP hepatotoxicity is, at least in part, mediated via an as-yet-unknown mouse GPCR that senses PPA cannot be ruled out. The potential involvement of GPCR(s) in PPA’s protective action against APAP hepatotoxicity remains to be investigated.
We show that PPA alleviates APAP hepatotoxicity, at least in part, by lowering hepatic CYP2E1 levels without changing Cyp2e1 mRNA levels, suggesting that PPA may affect posttranscriptional regulation of CYP2E1. At the posttranscriptional level, two main mechanisms are known to control hepatic CYP2E1 levels: proteolytic degradation and substrate-induced stabilization. The CYP2E1 protein can be degraded via slow and rapid routes involving the lysosome (half-life 32 h) and the ubiquitin-proteasome pathways (half-life 7 h), respectively.Citation40 Whether PPA promotes lysosome- or proteosome-mediated degradation of CYP2E1 remains to be examined. Most CYP2E1 substrates (except “suicide” substrates such as carbon tetrachloride) stabilize and protect CYP2E1 from proteasomal degradation.Citation57 CYP2E1 has broad substrate specificity toward small (molecular weight <150 Da) and hydrophobic molecules,Citation58 as well as endogenous fatty acids (e.g., arachidonic acid).Citation59–62 While our result suggests that PPA is not a CYP2E1 substrate, we cannot rule out the possibility that PPA reduces endogenous CYP2E1 substrate levels, thereby enhancing CYP2E1 protein turnover. The detailed mechanisms underlying reduced hepatic CYP2E1 protein levels in PPA-supplemented mice remain to be elucidated.
The fact that we could not detect previously known gut bacteria that can metabolize l-Phe to PPA may reflect the divergence of enzymes in the l-Phe reductive pathwayCitation26,Citation27 and differences in the mouse and human gut microbiotas. The gut bacteria harboring the l-Phe reductive pathway were identified by exhaustive bioinformatics search in 1,868 human gut bacterial genomes using C. sporogenes’s phenyllactate dehydratase gene cluster (fldAIBC) as bait.Citation26 It should be noted that the nucleotide sequences of the four known fldC genes exhibit only 54–61% identity to each other, and the four FldC proteins share 23–46% identity at the overall amino acid level, although the four gut bacteria harboring the fldC genes are closely related in phylogeny. Our result suggests that the mouse gut microbiota harbors an as-yet-unknown l-Phe reductive pathway, which is divergent from the previously characterized pathways. This is somewhat in line with recent studies reporting that although the overall functionality of the mouse and human gut microbiotas are similar,Citation63 they only share up to 10% of bacterial species. Different bacterial species can mediate the same gut bacterial functions between humans and mice.Citation63 To better understand the PPA effects on host physiology in a mouse model, it would be essential to identify functionally equivalent mouse bacterial species harboring an l-Phe reductive pathway.
One striking finding from this study is that the cecum microbiota of 6N mice produces PPA (from l-Phe) at a similar efficiency as that of 6J mice in vitro, while the apparent PPA production of 6N mice in vivo is suppressed. A recent study has shown that the reductive metabolism of l-Phe to PPA in C. sporogenes can be enhanced by coupling with the oxidation of another amino acid (methionine, leucine, or valine) that serves as an electron donor.Citation64 Therefore, it is possible that the availability of these amino acids in the gut may modulate PPA production in vivo. While this possibility needs to be investigated, the disconnect between in vitro and in vivo phenotypes throws an important message for gut microbiota studies. Most, if not all, gut microbiota studies attempt to identify gut bacteria whose absence or presence (or differences in abundance) is associated with healthy or diseased gut microbiota. Our finding, however, argues that certain phenotypes of the gut microbiota (e.g., lack of metabolite production) should be interpreted cautiously, not solely based on the abundance of certain gut bacterial species but through functional characterization in both in vitro and in vivo settings.
In conclusion, we have identified the gut bacterial metabolite PPA as having a protective effect against APAP-induced hepatotoxicity, at least in part, by lowering hepatic CYP2E1 levels. This finding may have broader implications in CYP2E1-involved physiology. In addition to CYP2E1-mediated bioactivation of chemicals, high CYP2E1 activity contributes to the development of nonalcoholic fatty liver diseasesCitation65 and is implicated in increased insulin resistance in high-fat diet treatment,Citation66,Citation67 diabetes,Citation68 and obesity.Citation69 Cyp2e1-null mice are shown to be resistant to high-fat diet-induced obesityCitation66 and nonalcoholic steatohepatitis.Citation67 Our study shows that systemic PPA levels are well correlated with the amounts of PPA produced in the gut. This raises the possibility of leveraging the gut microbiota for higher PPA production and its systemic exposure, potentially alleviating pathology linked to CYP2E1-involved metabolic diseases.
Materials and methods
Chemicals
Acetaminophen, APAP-d4, acetaminophen sulfate, cinnamoylglycine, acetate-13C6, propionate-13C6, chlorzoxazone, 2-benzoxazolinone, t-cinnamic acid, t-cinnamic acid-d6, l-phenylalanine-d8, 3-phenylpropionic acid (PPA), 3-phenylpropionic acid-d9, and 5-sulfosalicylic acid dihydrate were purchased from Sigma-Aldrich. Acetaminophen-d3 sulfate was from Santa Cruz Biotechnology. Acetaminophen glutathione disodium salt (APAP-GSH), 3-cysteinylacetaminophen trifluoroacetic acid salt (APAP-CYS), butyrate-13C6, 3-phenylpropionic acid-13C3, p-cresol sulfate, and p-cresol sulfate-d7 potassium salt) were purchased from Toronto Research Chemical. 6-Hydroxychlorzoxazone was from Cayman Chemical. 3-(N-acetyl-l-cysteinyl) acetaminophen disodium salt (APAP-mercapturate; APAP-NAC) was from Santa Cruz.
APAP treatment and co-housing of mice
APAP was injected intraperitoneally (i.p.) for all animal experiments unless indicated otherwise. Male or female C57BL/6 mice were purchased from the Jackson laboratory (6J; the facility at Sacramento, CA, USA) or Taconic Biosciences (6N; the facility at Cambridge City, IN, USA) and maintained under specific pathogen-free conditions and fed a standard chow diet (Teklad 7012, Envigo). After one week of acclimation, mice were fasted overnight (14 h) and treated with APAP (dissolved in warm PBS) or PBS. Food was returned to the mice after treatment. Mice were sacrificed 24 h after APAP treatment. For cohousing, male C57BL/6 mice (4 weeks of age) from either 6J or 6N were cohoused with mice of a different vendor (4 mice/cage). After four weeks of cohousing, mice were fasted overnight, treated with APAP or vehicle control, and sacrificed at 24 h post-treatment. For the determination of an APAP dose that differentiates susceptibility to APAP-induced hepatotoxicity between 6J and 6N mice, 100, 200, or 300 mg/kg APAP was used. For the rest of the animal experiments, 300 mg/kg APAP was used. For time-course experiments, mice were sacrificed at 0, 0.5, 2, 6, 12, and 24 h post-APAP treatment. All animal procedures were approved by the Institutional Animal Care and Use Committee at the University of Illinois at Chicago.
Gut microbiota transplantation and APAP treatment
Cecum contents were collected from 6J or 6N mice (8–9 weeks of age; housed at the University of Illinois at Chicago), pooled, and suspended at the concentration of 100 mg/mL in pre-reduced PBS containing 30% glycerol. The mixture was homogenized and centrifuged (100g × 10 min) to remove debris. The supernatant was collected and snap-frozen in liquid nitrogen and stored at −80°C until use. The final cecal suspension (200 μL) was orally administered to male C57BL/6 germ-free (GF) mice (8–12 weeks of age; University of Chicago). Mice were fed a standard chow diet (LabDiet, 6F 5K67). After four weeks, mice were fasted overnight, treated with APAP or vehicle control, and sacrificed at 24 h post-treatment. All animal procedures involving GF mice were approved by the University of Chicago Animal Care and Use Committee.
PPA supplementation
PPA was dissolved in drinking water at the final concentration of 0.4% (w/v, pH 7.4). 6N mice (6–7 weeks of age) had free access to drinking water. After 4 weeks, mice were fasted overnight, treated with APAP or vehicle control, and sacrificed at 24 h post-treatment. For time-course experiments, mice were sacrificed at 0, 0.5, 2, 6, 12, and 24 h post-treatment.
Carbon tetrachloride hepatotoxicity
C57BL/6N male mice (6–8 weeks of age) were treated with regular or PPA-containing water (0.4% w/v) for 4 weeks. At the end of PPA supplementation, mice were treated with a vehicle control or carbon tetrachloride (at a dose of 1 mL/kg, i.p.; 10 µL/g after 10-fold dilution using mineral oil) and sacrificed at 24 h post-treatment.
Liver histology and measurement of alanine aminotransferase (ALT)
Liver tissues were fixed with 10% neutral buffered formalin embedded in paraffin. Sections were cut and stained with hematoxylin and eosin (H/E). Serum ALT levels were measured using an ALT kit (A7526–150, Pointe Scientific, MI, USA) according to the manufacturer’s instructions.
Untargeted metabolomics
Portal vein serum and liver tissues were collected before APAP administration from conventional 6J and 6N mice as well as 6JGF and 6NGF mice (n = 5/group). Respective samples from GF mice (n = 3/group) were included as controls. Samples were immediately snap-frozen in liquid nitrogen and stored at −80°C until analysis. Samples for metabolomic analysis were prepared using the automated MicroLab STAR system from Hamilton Company and analyzed via ultra performance liquid chromatography-tandem mass spectrometer (UPLC-MS/MS) by Metabolon, Inc (Durham, NC). Proteins were precipitated with methanol under vigorous shaking for 2 min (Glen Mills GenoGrinder 2000), followed by centrifugation. The resulting extracts were divided into five fractions: two for analysis by two separate reverse-phase (RP)/UPLC-MS/MS methods with positive ion mode electrospray ionization (ESI), one for analysis by RP/UPLC-MS/MS with negative ion mode ESI, one for analysis by hydrophilic interaction liquid chromatography (HILIC)/UPLC-MS/MS with negative ion mode ESI, and one sample reserved for backup. Samples were placed briefly on a TurboVap (Zymark) to remove the organic solvent. The sample extracts were stored overnight under nitrogen before preparation for analysis. For UPLC-MS/MS analysis, all methods utilized a Waters ACQUITY UPLC and a Thermo Scientific Q-Exactive high resolution/accurate mass spectrometer interfaced with a heated electrospray ionization (HESI-II) source and Orbitrap mass analyzer operated at 35,000 mass resolution. The sample extracts were dried and reconstituted in solvents compatible with each of the four methods. Each reconstitution solvent contained a series of standards at fixed concentrations to ensure injection and chromatographic consistency. One aliquot was analyzed using acidic positive ion conditions, chromatographically optimized for more hydrophilic compounds. In this method, the extract was gradient eluted from a C18 column (Waters UPLC BEH C18–2.1 × 100 mm, 1.7 μm) using water and methanol containing 0.05% perfluorooctanoic acid (PFPA) and 0.1% formic acid. Another aliquot was also analyzed using acidic positive ion conditions, which were chromatographically optimized for more hydrophobic compounds. In this method, the extract was gradient eluted from the same aforementioned C18 column using methanol, acetonitrile, water, 0.05% PFPA, and 0.01% formic acid. Another aliquot was analyzed using basic negative ion optimized conditions with a separate dedicated C18 column. The basic extracts were gradient eluted from the column using methanol and water containing 6.5 mM ammonium bicarbonate at pH 8. The fourth aliquot was analyzed via negative ionization following elution from a HILIC column (Waters UPLC BEH Amide 2.1 × 150 mm, 1.7 μm) using a gradient consisting of water and acetonitrile with 10 mM ammonium formate, pH 10.8. The MS analysis alternated between MS and data-dependent MSn scans using dynamic exclusion. The scan range covered 70–1000 m/z. Peaks were quantified using an area under the curve. Detected metabolites were identified by comparison to library entries of purified standards. Following normalization to serum sample volume or liver tissue weight, log transformation, and imputation of missing values, Welch’s two-sample t-test was used to identify metabolites that were significantly different between experimental groups. The full dataset is shown in Table S1.
Measurement of phenylpropionic acid in mouse cecum contents
Mouse cecum contents (~50 mg) were mixed with 250 μL of 50% aqueous acetonitrile, vortexed for 10 s, and centrifuged at 16,000g for 15 min at 4°C. Supernatants were collected, diluted 20-fold with 50% acetonitrile, and mixed with ice-cold acetonitrile containing trans-cinnamic acid (t-CA)-d6 (100 ng/mL) as an internal standard followed by centrifugation at 16,000g for 10 min at 4°C. Supernatants were filtered through a 0.22 μm pore Ultrafree-MC filter and used for LC-MS/MS analysis. PPA-d9 was used as a surrogate standard to obtain the calibration curve for the quantification of PPA.Citation70 Mouse serum collected from the portal vein or heart was diluted with double-distilled water (DDW) threefold and mixed with ice-cold acetonitrile containing 100 ng/mL of t-CA-d6 followed by centrifugation at 16,000g for 10 min at 4°C. The supernatant was dried and reconstituted with a 7:3 mixture of water and acetonitrile containing 0.01% acetic acid. PPA levels in the cecum or serum samples were measured using LC-MS/MS in negative ion mode. The separation was performed on an Atlantis T3 column (3 μm, 100 mm × 3 mm, i.d., Waters Corp., Milford, MA). Chromatographic separation was performed using 0.01% acetic acid in water (solvent A) and 0.01% acetic acid in acetonitrile (solvent B) at a flow rate of 0.4 mL/min. The gradient elution profile used was as follows: 70% solvent A for 0.5 min, 70% to 10% solvent A over 5 min, 10% solvent A for 4 min, 10% to 70% solvent A over 0.1 min, and 70% solvent A for 5.4 min (15 min analysis in total). The detection and quantification of analytes were accomplished by MRM of m/z 149.0/105.0 for PPA; 158.0/114.2 for PPA-d9; 147.0/103.2 for t-CA; and 152.9/109.1 for t-CA-d6. t-CA was not detected in either cecum or serum samples.
Cecal and fecal genomic DNA extraction
Fecal pellets were collected before fasting, snap-frozen in liquid nitrogen, and stored at −80°C until use. Genomic DNA was extracted using a Tissue DNA Purification Kit, implemented on a Maxwell® 16 automated extraction system (Promega). Genomic DNA quantity was assessed using a Qubit 2.0 fluorometer with the dsDNA BR Assay Kit (Life Technologies, Grand Island, NY, USA). Cecal contents of 6J and 6N mice were collected and sent to Zymo Research Inc. for genomic DNA isolation.
16S rRNA gene amplicon sequence libraries and data analysis
For fecal genomic DNA, the V4 region of the 16S rRNA gene was amplified and sequenced at the High-Throughput Genome Analysis Core at Argonne National Laboratory. Briefly, PCR amplicon libraries targeting the 16S rRNA encoding gene present in metagenomic DNA were produced using a barcoded primer set adapted for the Illumina HiSeq2000 and MiSeq.Citation71 DNA sequence data were then generated using Illumina paired-end sequencing at the Environmental Sample Preparation and Sequencing Facility (ESPSF) at Argonne National Laboratory. Specifically, the V4 region of the 16S rRNA gene (515F-806 R) was PCR amplified with region-specific primers that include sequencer adapter sequences used in the Illumina flowcell.Citation71 The forward amplification primer also contains a 12-base barcode sequence that supports the pooling of up to 2,167 samples in each lane.Citation71 Each 25 μL PCR reaction contains 9.5 μL of MO BIO PCR Water (Certified DNA-Free), 12.5 μL of QuantaBio’s AccuStart II PCR ToughMix (2× concentration, 1× final), 1 μL Golay barcode tagged Forward Primer (5 μM concentration, 200 pM final), 1 μL Reverse Primer (5 μM concentration, 200 pM final), and 1 μL of template DNA. The conditions for PCR were as follows: 94°C for 3 min to denature the DNA, with 35 cycles at 94°C for 45 s, 50°C for 60 s, and 72°C for 90 s; with a final extension of 10 min at 72°C to ensure complete amplification. Amplicons were then quantified using PicoGreen (Invitrogen) and a plate reader (Infinite 200 PRO, Tecan). Once quantified, volumes of each of the products were pooled into a single tube so that each amplicon was represented in equimolar amounts. This pool was then cleaned up using AMPure XP Beads (Beckman Coulter), and then quantified using a fluorometer (Qubit, Invitrogen). After quantification, the molarity of the pool was determined. The samples were diluted to 2 nM, denatured, and then diluted to a final concentration of 6.75 pM with a 10% PhiX spike for sequencing on the Illumina MiSeq. Amplicons were sequenced on a 151 bp × 12 bp × 151 bp MiSeq run using customized sequencing primers and procedures.Citation71
Quantitative Insights into Microbial Ecology (QIIME) software v.1.9.1 was used to analyze the sequencing data. Forward and reverse barcode sequences were imported into an artifact type of EMPPairedEndSequences and demultiplexed.Citation72 Demultiplexed reads were denoised with DADA2,Citation73 generating a table of operational taxonomic units (OTUs). Taxonomic annotations for each OTU were generated with the taxonomy classifier trained on the Greengenes18_3 97% OTUs where the sequences have been trimmed to include bases from the region of the 16S rRNA gene that was sequenced in this analysis (the V4 region, bound by the 515F/806 R primer pair).Citation72 Taxonomic and OTU abundance data were generated for all phyla, classes, orders, families, genera, and species. Nonmetric multidimensional scaling (NMDS) plot, analysis of similarities (ANOSIM), and Shannon-index were created or calculated using the R ggplot or vegan package. False discovery rates (FDRs) of the multiple comparisons were estimated for each taxon based on the p-values resulting from Spearman correlation estimates using the R multtest package. Differential abundance statistics (fold-change and p-value) were computed on each taxonomic level using the exactTest function in edgeRCitation74,Citation75 on raw expression counts obtained from quantification. P-values were adjusted for multiple testing using the false discovery rate (FDR) correction of Benjamini and Hochberg.Citation76
For cecal microbiota analysis, the cecal DNA was extracted using a ZymoBIOMICS-96 MagBead DNA kit (Zymo Research, Irvine, CA, USA), and the DNA samples were prepared for targeted sequencing with the Quick-16S NGS Library Prep kit using Primer Set V4 (Zymo Research, Irvine, CA). The ZymoBIOMICS Microbial Community Standard (Zymo Research, Irvine, CA) was used as a positive control for each DNA extraction. The sequencing library was prepared using a library preparation process in which PCR reactions were performed in real-time PCR machines to control cycles and therefore limit PCR chimera formation. The final PCR products were quantified with qPCR fluorescence readings and pooled together based on equal molarity. The final pooled library was cleaned up with the Select-a-Size DNA Clean & Concentrator (Zymo Research, Irvine, CA), then quantified with TapeStation (Agilent Technologies, Santa Clara, CA) and Qubit (Thermo Fisher Scientific, Waltham, WA). The ZymoBIOMICS Microbial Community DNA Standard (Zymo Research, Irvine, CA) was used as a positive control for each targeted library preparation. Negative controls (i.e., blank extraction control and blank library preparation control) were included to assess the level of bioburden carried by the wet-lab process. The final library was sequenced on Illumina MiSeq with a v3 reagent kit (600 cycles). The sequencing was performed with a 10% PhiX spike-in. Unique amplicon sequences were inferred from raw reads using the DADA2 pipeline.Citation73 Chimeric sequences were also removed with the DADA2 pipeline. Taxonomy assignment was performed using Uclust from QIIME v.1.9.1. Taxonomy was assigned with the Zymo Research Database, a 16S database that is internally designed and curated, as a reference. Alpha-diversity analysis was performed with QIIME v.1.9.1 (Caporaso et al., 2010). Taxonomy that has significant abundance among different groups was identified by LEfSeCitation77 using default settings.
Measurement of endogenous metabolites and APAP metabolites in the liver
Liver tissues (~50 mg) were homogenized in 450 μL of ice-cold methanol followed by centrifugation at 16,000g for 10 min at 4°C. The supernatant was filtered using a 0.22-μm Ultrafree-MC centrifugal filter (UFC30GV0S, Sigma, St. Louis, MO, USA) and stored at −80°C until use.
APAP-sulfate and p-cresol sulfate: A portion (50 μL) of the filtrates was mixed with 200 μL of methanol containing deuterated internal standards (mixtures of APAP-sulfate-d3 and p-cresol-sulfate-d7) and centrifuged at 16,000g for 10 min at 4°C. The supernatant was subjected to LC-MS/MS analysis. The concentrations of APAP-sulfate and p-cresol sulfate were measured in positive and negative ion modes, respectively, using LC-MS/MS. The separation was performed on an Atlantis T3 column (3 μm, 100 mm × 3 mm, i.d., Waters Corp., Milford, MA). Chromatographic separation was performed using 0.1% formic acid in water (solvent A) and 0.1% formic acid in acetonitrile (solvent B) at a flow rate of 0.4 mL/min. The gradient elution profile used was as follows: 95% A for 3 min, 95% to 10% A over 3 min, 10% A for 3 min, 10% to 95% A over 0.5 min, and 95% A for 5 min. The detection and quantification of analytes were accomplished by AB Sciex QTrap 4500. The following multiple reaction monitoring (MRM) pairs were detected: m/z 232.1/152.1 for APAP-sulfate; 235.1/155.1 for APAP-sulfate-d3; 328.1/152.1 for p-cresol sulfate; and 194.0/114.0 for p-cresol sulfate-d7.
Cinnamoylglycine and t-cinnamic acid: A portion (75 μL) of the filtrates was mixed with 75 μL of methanol containing deuterated internal standard (t-CA-d6 at 400 ng/mL), and the mixture was subjected to LC-MS/MS analysis. The separation was performed on an Atlantis T3 column (3 μm, 100 mm × 3 mm, i.d., Waters Corp., Milford, MA). Chromatographic separation was performed using 0.1% formic acid in water (solvent A) and 0.1% formic acid in acetonitrile (solvent B) at a flow rate of 0.4 mL/min. The gradient elution profile used was as follows: 90% A for 3 min, 90% to 10% A over 4 min, 10% A for 4 min, 10% to 90% A over 1 min, and 90% A for 3 min. The detection and quantification of analytes were performed by AB Sciex QTrap 4500 in a negative mode. The following MRM pairs were detected: m/z 146.9/102.9 for t-cinnamic acid; 203.9/159.8 for cinnamoylglycine; and 152.9/108.9 for t-CA-d6.
APAP-mercapturate (APAP-NAC), APAP-glutathione (APAP-GSH), and APAP-cysteine (APAP-CYS): A portion (50 μL) of the filtrates was mixed with 200 μL of MeOH containing internal standard (1 μg/mL of APAP-d4) and was analyzed by LC-MS/MS. The separation was performed on an Atlantis T3 column (3 μm, 100 mm × 3 mm, i.d., Waters Corp., Milford, MA). Chromatographic separation was performed using 0.1% formic acid in water (solvent A) and 0.1% formic acid in acetonitrile (solvent B) at a flow rate of 0.4 mL/min. The gradient elution profile used was as follows: 90% A for 3 min, 90% to 10% A over 4 min, 10% A for 4 min, 10% to 90% A over 1 min, and 90% A for 3 min. The detection and quantification of analytes were performed by AB Sciex QTrap 4500 in a negative mode. The following MRM pairs were detected: m/z 156.1/114.1 for APAP-d4; 455.0/181.9 for APAP-GSH; 270.9/140.0 for APAP-CYS; and 311.0/182.0 for APAP-NAC.
Measurement of short-chain fatty acids in mouse cecum contents
Mouse cecum contents (~50 mg) were mixed with 250 μL of 50% aqueous acetonitrile, vortexed for 10 s, and centrifuged at 16,000g for 15 min at 4°C. The supernatant (200 μL) was collected for analysis. A mixed standard solution containing an equal amount of each isotopically labeled short-chain fatty acid (acetate-13C6, propionate-13C6, and butyrate-13C6) at the desired concentration was made in 50% acetonitrile. For derivatization, 40 μL of the standard solution or the supernatant were mixed with 20 μL of 10 mM 3-nitrophenylhydrazine in 50% acetonitrile and 20 μL of 120 mM N-(3-dimethylaminopropyl)-N′-ethylcarbodiimide, incubated for 30 min at 40°C, and 10% acetonitrile (1 mL) was added. The diluted reaction solution was mixed with a pre-made isotope-labeled standard solution. The LC-MS/MS analysis was performed on AB Sciex Qtrap 5500 coupled to an Agilent HPLC system. All samples were analyzed using an Agilent poroshell 120 EC-C18 Column (100Å, 2.7 μm, 2.1 mm × 100 mm). Chromatographic separation was performed using a gradient of solvent A (water, 0.1% formic acid) and solvent B (acetonitrile, 0.1% formic acid) as follows: 0 min, 30% solvent B; solvent B to 100% over 4 min; solvent B at 100% for 5 min at a flow rate of 0.4 mL/min. The column was equilibrated for 3 min at 30% solvent B between sample injections. The column temperature was maintained at 25°C, and the autosampler was kept at 4°C. The detection and quantification of analytes were accomplished by MRM of m/z 136.1/94.1 for acetate; 142.1/100.1 for acetate-13C6; 150.1/94.1 for propionate; 156.1/100.1 for propionate-13C6; 164.1/94.1 for butyrate; and 170.1/100.1 for butyrate-13C6.
Measurement of total hepatic glutathione
Hepatic glutathione levels in the liver homogenates were measured using a GSSG/GSH Quantification Kit (G257, Dojindo Molecular Technologies, Rockville, MD, USA). Briefly, liver tissues were homogenized in a 5% sulfosalicylic acid solution. The homogenates were centrifuged at 8,000g for 10 min at 4°C. The supernatant was collected and stored at −80°C until use. The assay was performed following the manufacturer’s instructions.
Isolation of mouse hepatic microsomes
6J or 6N mice were sacrificed after overnight fasting, and liver tissues were collected for the preparation of hepatic microsomes. Mouse liver tissues (~100 mg) were homogenized in 1 mL of ice-cold homogenization buffer [225 mM mannitol, 75 mM sucrose, 30 mM Tris-HCl (pH 7.4), 0.5 mM EGTA, a protease inhibitor (Roche 04 693 123 004), and a phosphatase inhibitor (Roche 04 906 837 001)] followed by centrifugation at 800g for 5 min at 4°C. The supernatant was collected and centrifuged at 9,000g for 10 min at 4°C. The supernatant was collected and centrifuged at 20,000g for 30 min at 4°C to remove peroxisome pellets. The supernatant was collected and centrifuged at 100,000g for 60 min at 4°C, and the pellet was collected and resuspended in the homogenization buffer and centrifuged at 100,000g for 30 min at 4°C. Finally, the microsomal pellet collected was resuspended in microsome buffer (170 mM KCl, 50 mM KH2PO4, pH 7.4) containing the protease and phosphatase inhibitors and stored at −80°C until use.
Isolation of mouse liver mitochondria
Liver mitochondria were isolated using differential centrifugation followed by a Percoll density gradient with a slight modification.Citation78 Liver tissue (~850 mg) was homogenized in 6 mL of buffer 1 (225 mM mannitol, 75 mM sucrose, 0.5% BSA, 0.5 mM EGTA, and 30 mM Tris-HCl pH 7.4) and centrifuged at 740g for 5 min at 4°C. After repeating the centrifugation for additional three times, the supernatant was collected and centrifuged at 9,000g for 10 min at 4°C. The resulting supernatant was collected and further processed for cytosol and microsome fractionation as below. The crude mitochondrial pellet was resuspended in buffer 2 (225 mM mannitol, 75 mM sucrose, 0.5% BSA, and 30 mM Tris-HCl pH 7.4) and centrifuged at 10,000g for 10 min at 4°C. The pellet was resuspended in buffer 3 (225 mM mannitol, 75 mM sucrose, and 30 mM Tris-HCl pH 7.4) and centrifuged at 10,000g for 10 min at 4°C. The pellet was resuspended in mitochondria resuspension buffer [MRB: 250 mM mannitol, 5 mM HEPES (pH 7.4), and 0.5 mM EGTA], added on top of 30% (v/v) Percoll solution [containing 225 mM mannitol, 25 mM HEPES (pH 7.4), and 1 mM EGTA], and centrifuged at 95,000g for 30 min at 4°C. A dense band containing mitochondria at the bottom of the tube was collected, diluted 10-fold with MRB, and centrifuged for 10 min at 4°C. Finally, the pellet containing pure mitochondria was resuspended in MRB containing the protease and phosphatase inhibitors.
The supernatant containing cytosol and microsome fraction was centrifuged at 20,000g for 30 min at 4°C. The supernatant was collected and centrifuged at 100,000g for 60 min at 4°C. The supernatant was collected as the cytosol fraction, and the pellet was resuspended in microsome buffer [170 mM KCl and 50 mM KH2PO4 (pH 7.4)] and centrifuged again at 100,000g for 30 min at 4°C. The supernatant was discarded, and the microsomal pellet was resuspended in the microsome buffer containing the protease and phosphatase inhibitors.
Measurement of APAP bioactivation
The extent of APAP bioactivation in the hepatic microsome was measured as previously described with modifications.Citation79,Citation80 Briefly, APAP (at a final concentration of 1 mM) was incubated with microsome (2.5 μg) in a reaction mixture (20 μL) containing GSH (10 mM) and an NADPH-generating system [0.5 mM NADP+, 1 mM MgCl2, 0.2 U/L isocitrate dehydrogenase, and 0.5 mM isocitric acid in 100 mM Tris buffer (pH 7.4)]. After 30 min incubation, the reaction was stopped by adding 100 μL of ice-cold acetonitrile containing 100 ng/mL of APAP-d4 (as an internal standard). The reaction mixture was then centrifuged at 12,000g for 20 min at 4°C, and the APAP-GSH level in the supernatant was measured using LC-MS/MS in the positive ionization mode (QTrap 5500; Applied Biosystems, ON, Canada). The separation was performed on an Atlantis T3 column (3 μm, 100 mm × 3 mm, i.d., Waters Corp., Milford, MA, USA). Chromatographic separation was performed using a solvent mixture of water (solvent A) and acetonitrile (solvent B) containing 0.1% formic acid at a flow rate of 0.4 mL/min. The gradient elution profile used was as follows: 95% A for 3 min, 95% to 10% A over 3 min, 10% A for 3 min, 10% to 95% A over 0.5 min, and 95% A for 5 min. The detection and quantification of analytes were accomplished by MRM of m/z 457.1/140.0 for APAP-GSH and 156.1/114.0 for APAP-d4.
Measurement of CYP2E1 activity
Chlorzoxazone at a final concentration of 100 μM was incubated with the mouse liver microsome (25 μg) in a reaction mixture of 100 μL containing the NADPH-generating system and 1 mM of PPA or p-nitrophenol. After 30 min incubation, the reaction was stopped by adding 200 μL of acetonitrile containing 0.4 mM 2-benzoxazolinone (as an internal standard). Precipitated proteins were removed by centrifugation (12,000g, 4°C, 20 min), and the supernatant was analyzed using LC-MS/MS in the negative ionization mode (QTrap 5500; Applied Biosystems, ON, Canada). The separation was performed on an XTerra MS C18 column (2.5 μm, 50 mm × 2.1 mm, i.d.; Waters Corp., Milford, MA, USA). The HPLC system (Agilent 1200, Santa Clara, CA, USA) was operated isocratically at a flow rate of 0.3 mL/min. A mixture of acetonitrile (0.1% formic acid) (solvent A) and 0.1 mM ammonium formate (0.1% formic acid) (solvent B) was used as the mobile phase (A:B, 20:80). The detection and quantification of analytes were accomplished by MRM with the transitions of m/z 183.9/119.9 for 6-hydroxychlorzoxazone; 167.9/132.1 for chlorzoxazone; and 133.9/64.9 for 2-benzoxazolinone.
Western blotting
Hepatic microsomes or liver lysates (10–30 µg protein) were separated on a 10% SDS polyacrylamide gel (Bio-Rad, Hercules, CA, USA) by electrophoresis and transferred to a polyvinylidene difluoride membrane. The membrane was blocked with 5% skim milk in Tris-buffered saline with 0.1% Tween 20 at room temperature for an hour, followed by incubation with primary antibodies against β-actin (Sigma, A1978, 1:7500), calnexin (Abcam, ab22595, 1:3000), CYP2E1 (Abcam, ab28146, 1:5000), CYP1A2 (Chemicon, Mab10035, 1:5000), voltage-dependent anion channel (VDAC; ThermoFisher Scientific, PA1-954A, 1:3000), α-tubulin (Calbiochem, CP06, 1:10000), JNK (Cell Signaling, 9252, 1:1000), or pJNK (Cell Signaling, 9251, 1:1000) overnight at 4°C. On the next day, the membrane was incubated with a secondary antibody (1:10000) for one hour, and the proteins were detected by a chemiluminescent ECL reagent (Pierce, Rockford, IL, USA). The intensity of protein bands was quantified using Image J.
Measurement of APAP-protein adduct in the liver
APAP-protein adduct (i.e., APAP-CYS) was measured as previously described with modifications.Citation81,Citation82 Briefly, liver tissue (~50 mg) was homogenized in 500 μL of sodium acetate buffer (10 mM, pH 6.5) and filtered through a Bio-spin 6 column (Bio-Rad, Hercules, CA, USA) prewashed with sodium acetate buffer to remove free APAP and APAP metabolites. The filtrate was incubated with protease type XIV in water (8 U/mL) at 37°C for 24 h. Ice-cold acetonitrile (800 μL) containing APAP-d4 as an internal standard (20 ng/mL) was added and centrifuged at 16,000g for 10 min at 4°C. The supernatant (800 μL) was dried and reconstituted in a mixture of 0.1% formic acid water and 0.1% formic acid acetonitrile (95:5), followed by centrifugation at 16,000g for 10 min at 4°C. The supernatants were filtered through Ultrafree-MC centrifugal filter to remove large particles, and APAP-cysteine (APAP-CYS) in the filtrate was measured using LC-MS/MS in positive ion mode. The separation was performed on an Atlantis T3 column (3 μm, 100 mm × 3 mm, i.d., Waters Corp., Milford, MA). Chromatographic separation was performed using 0.1% formic acid in water (solvent A) and 0.1% formic acid in acetonitrile (solvent B) at a flow rate of 0.4 mL/min. The gradient elution profile used is as follows: 95% A for 3 min, 95% to 10% A over 3 min, 10% A for 3 min, 10% to 95% A over 0.5 min, and 95% A for 5 min. The detection and quantification of analytes were accomplished by multiple reaction monitoring of m/z 270.9/139.8 for APAP-CYS and 155.9/114.1 for APAP-d4. The protein level of liver homogenate filtrate was determined using a Pierce BCA Protein Assay Kit, and the APAP-CYS level was normalized to total protein amounts in the liver homogenates.
Rabbit anti-APAP serum, which was provided by Dr. Lance R. Pohl (NCI, NIH, Bethesda, MD)Citation83 and used for the detection of APAP-protein adducts, as described previously.Citation84
Quantitative real-time (qRT)-PCR
Total RNA was isolated from liver tissues using Trizol (Life Technologies) and used as a template for the synthesis of complementary DNA using High Capacity cDNA Archive Kit (Applied Biosystems, Foster City, CA). qRT-PCR was performed using the cDNA as a template and with the following primers from Integrated DNA Technologies (California, USA): Cyp2e1 (Mm.PT.58.9617541), Gclc (Mm.PT.58.30656560), and Gapdh (Mm.PT.39a.1).
Detection of the fldC genes of the four known gut bacteria in mouse cecal contents
The cecal DNA was isolated from 6J and 6N mouse cecal contents using a PowerFecal DNA isolation kit (Qiagen, 51804) following manufacturers’ instructions. Cecal DNA (6N+CS in Figure S5E) was prepared from the cecal contents of 6N mice colonized with C. sporogenes ATCC 15579 and used as an additional control for the detection of C. sporogenes. For the colonization of C. sporogenes in 6N mice, cells of C. sporogenes (CS) grown overnight in TYG medium were harvested by centrifugation (4,000g × 10 min) and resuspended in pre-reduced PBS at a cell density of ~2.5 × 10¹⁰ colony forming units (CFU)/mL, and 300 µL of the cell suspension was orally gavaged into 6N mice (males, ages 9–10 weeks) once a day for 7 days. On day 8, mice were sacrificed, and cecal contents were collected and used for cecal DNA isolation. For the genomic DNAs of four gut bacteria used as controls, the genomic DNA of P. anaerobius ATCC 49031 was purchased from ATCC (atcc.org), and that of C. botulinum VPI 4404 was purchased from bei resources (beiresources.org); and the genomic DNA of C. sporogenes ATCC 15579 and C. cadaveris CC40 were isolated as follows. Overnight cultures of C. sporogenes in TYG medium and C. cadaveris in YCFA medium grown at 37°C under anaerobic conditions (5% CO2, 5% H2, and 90% N2) were used to isolate genomic DNA using a bacterial genomic DNA isolation kit (Sigma, NA2110). For detection of the fldC genes, PCR was performed using Phusion polymerase (New England Biolabs, M0530) or Platinum Hot Start PCR Master Mix (Thermo Fisher Scientific, 13000013) at the following PCR conditions: denaturation at 94°C for 2 min, 30 cycles of 94°C for 30 sec, 55–60°C for 30 sec, and 72°C for 45 sec. Primers used are listed in Table S2, and PCR was performed on a Bio-Rad T100 Thermal Cycler. To determine a detection limit for each of the four fldC genes under our PCR conditions, SYBR Green Master Mix (ThermoFisher, 4309155) and Applied Biosystems StepOne Real-Time PCR System were used: Each bacterial genomic DNA used as a template was serially diluted by twofold and the lowest genomic DNA concentration that allows exponential amplification of PCR products was taken to calculate corresponding numbers of bacterial cells, assuming a single copy of genomic DNA per cell (see Table S3).
Measurement of l-Phe in mouse cecal contents
Mouse cecal contents (~50 mg) were mixed with 300 μL of DDW, vortexed for 30 s, and centrifuged at 16,000g for 10 min at 4°C. The supernatant was collected and diluted 10-fold with DDW containing 1 μg/mL l-Phe-d8 (Sigma-Aldrich) as an internal standard. Calibration samples were prepared using cecum contents from germ-free mice (with low basal l-Phe levels) at the final l-Phe concentration of 10,000, 5000, 2500, 1250, 625, and 313 ng/mL, and l-Phe concentrations were estimated using the standard addition method. An aliquot (140 μL) of each sample and a standard solution were dried in a speed vac. Dried samples were reconstituted in 140 μL of 50% aqueous acetonitrile and filtered using a 0.22-μm Ultrafree-MC centrifugal filter at 16,000g for 5 min at 4°C. The filtrate was subjected to LC-MS/MS analysis in a negative ion mode. The separation was performed on an Atlantis T3 column (3 μm, 100 mm × 3 mm, i.d., Waters Corp., Milford, MA), with 0.01% acetic acid in water (solvent A) and 0.01% acetic acid in acetonitrile (solvent B) at a flow rate of 0.4 mL/min. The gradient elution profile used is as follows: 95% solvent A for 3.5 min, 95% to 10% solvent A over 3 min, 10% solvent A for 5 min, 10% to 95% solvent A over 2.5 min, and 95% solvent A for 2 min. The detection and quantification of analytes were accomplished by MRM of m/z 163.929/103.100 for l-Phe; 171.995/154.000 for l-Phe-d8.
Measurement of PPA, PPA-d6 and PPA-d7 production by C. sporogenes and mouse cecal contents in vitro
To validate the production of PPA-d6 and PPA-d7 as indicators of two different biosynthetic pathways, C. sporogenes that harbors the l-Phe reductive Fld pathway but not the PAL pathway was used as a control. C. sporogenes was grown overnight in TYG broth at 37°C under anaerobic conditions. Cells were harvested by centrifugation (4,800g × 10 min) and resuspended in pre-reduced buffer (40 mM KH2PO4, 20 mM MgSO4, pH 7.0) (Dodd et al., 2017). The cell suspension was mixed with l-Phe or l-Phe-d8 (at a final concentration of 1 mM). After incubation for 1 h at 37°C under anaerobic conditions, an equal volume of ice-cold acetonitrile was added. After vortexing and centrifugation (16,000g, 10 min), 5 µL of the supernatant was mixed with 495 µL of 30% acetonitrile containing 100 ng/mL of PPA-13C3 as an internal standard and subjected to LC-MS/MS analysis as described below.
Cecal contents (~200 mg) of 6J and 6N mice were resuspended in pre-reduced PBS. After homogenization, samples were centrifuged at 100g for 10 min to remove debris. The supernatant collected was centrifuged at 16,000g for 10 min. The supernatant was collected and stored at −80°C for PPA measurement in the cecal contents. The pellet was resuspended and washed twice with pre-reduced PBS. The final cecal suspension in pre-reduced PBS was mixed with l-Phe or l-Phe-d8 (at a final concentration of 1 mM). After incubation at 37°C under anaerobic conditions, aliquots were taken at indicated time points and mixed with ice-cold acetonitrile containing 200 ng/ml of PPA-13C3 (Sigma, 589675) as an internal standard. After vortexing and centrifugation (16,000g, 10 min), the supernatant collected was filtered using a 0.22-μm Ultrafree-MC centrifugal filter (Sigma, UFC30GVNB). The filtrate was subjected to LC-MS/MS analysis in negative ion mode. Chromatographic separation was performed as described in PPA measurement in mouse cecal contents. PPA-d9 was used as a surrogate standard to obtain the calibration curve for the quantification of PPA, PPA-d6, and PPA-d7. The detection and quantification of analytes were accomplished by MRM of m/z 148.9/105.0 for PPA; 155.0/111.0 for PPA-d6; 156.0/112.0 for PPA-d7, 158.0/114.1 for PPA-d9; 152.0/107.0 for PPA-13C3.
NRF2 reporter assay
HepG2-C8 cell line was obtained from Dr. Ah-Ng Tony Kong (The State University of New Jersey), which was established by transfection with pARE-TI-luciferase plasmid and clonal selection with G418.Citation85 Cells were cultured in DMEM (Gibco) supplemented with 10% FBS (Gemini) at 37°C in a humidified incubator containing 5% CO2. Cells were seeded in 48-well plates at 6 × 10⁴/well. After 24 h, they were serum-starved overnight and treated with phenylpropionic acid for 24 h. Quercetin was used as a positive control for NRF2 activation. Luciferase activity was measured using a GloMax luminometer (Promega).
Statistical analysis
All data were expressed as mean±standard deviation (S.D.). Comparisons between groups were made by using the Student’s t-test or one-way ANOVA via GraphPad Prism 7. p-value or FDR value less than 0.05 was considered significant.
Authors contributions
Conceptualization, S.C., H.L, and H.J.; investigation, S.C., X.Y., K-J.W., V.L., N.H., E.C., E.C., J-S.P., G.G., and Y.K.; resources, E.C., O-N.B., H.L. and H.J.; writing – original draft, S.C. and H.J.; writing – review & editing, H.L. and H.J.; supervision, H.L. and H.J.
Supplemental Material
Download MS Word (1.6 MB)Supplemental Material
Download MS Word (16 KB)Supplemental Material
Download MS Excel (380 KB)Disclosure statement
No potential conflict of interest was reported by the authors.
Data availability statement
16S rRNA amplicon sequencing data have been deposited under the NCBI BioProjects (https://www.ncbi.nlm.nih.gov/bioproject/) PRJNA604264 (6J/6N cohousing and gut microbiota transplantation), PRJNA940413 (6J/6N cecal microbiota), and PRJNA604973 (PPA supplementation). Any additional information required to reanalyze the data reported in this study will be available upon request.
Supplementary material
Supplemental data for this article can be accessed online at https://doi.org/10.1080/19490976.2023.2231590
Additional information
Funding
References
- Mitchell JR, Jollow DJ, Potter WZ, Davis DC, Gillette JR, Brodie BB. Acetaminophen-induced hepatic necrosis. I. Role of drug metabolism. J Pharmacol Exp Ther. 1973;187:185–27.
- Weber LW, Boll M, Stampfl A. Hepatotoxicity and mechanism of action of haloalkanes: carbon tetrachloride as a toxicological model. Crit Rev Toxicol. 2003;33(2):105–136. doi:10.1080/713611034.
- Sarges P, Steinberg JM, Lewis JH. Drug-induced liver injury: highlights from a review of the 2015 literature. Drug Saf. 2016;39(9):801–821. doi:10.1007/s40264-016-0427-8.
- Lee WM. Drug-induced acute liver failure. Clin Liver Dis. 2013;17(4):575–586. viii. doi:10.1016/j.cld.2013.07.001.
- Larson AM, Polson J, Fontana RJ, Davern TJ, Lalani E, Hynan LS, Reisch JS, Schiødt FV, Ostapowicz G, Shakil AO, et al. Acetaminophen-induced acute liver failure: results of a United States multicenter, prospective study. Hepatology. 2005;42(6):1364–1372. doi:10.1002/hep.20948.
- Lee WM. Acute liver failure in the United States. Semin Liver Dis. 2003;23(3):217–226.
- Harrill AH, Watkins PB, Su S, Ross PK, Harbourt DE, Stylianou IM, Boorman GA, Russo MW, Sackler RS, Harris SC, et al. Mouse population-guided resequencing reveals that variants in CD44 contribute to acetaminophen-induced liver injury in humans. Genome Res. 2009;19(9):1507–1515. doi:10.1101/gr.090241.108.
- Louvet A, Ntandja Wandji LC, Lemaitre E, Khaldi M, Lafforgue C, Artru F, Quesnel B, Lassailly G, Dharancy S, Mathurin P, et al. Acute liver injury with therapeutic doses of acetaminophen: a prospective study. Hepatology. 2021;73(5):1945–1955. doi:10.1002/hep.31678.
- Zaher H, Buters JT, Ward JM, Bruno MK, Lucas AM, Stern ST, Cohen SD, Gonzalez FJ. Protection against acetaminophen toxicity in CYP1A2 and CYP2E1 double-null mice. Toxicol Appl Pharmacol. 1998;152(1):193–199. doi:10.1006/taap.1998.8501.
- Jaeschke H, Ramachandran A, Chao X, Ding WX. Emerging and established modes of cell death during acetaminophen-induced liver injury. Arch Toxicol. 2019;93(12):3491–3502. doi:10.1007/s00204-019-02597-1.
- Kaplowitz N. Acetaminophen hepatoxicity: what do we know, what don’t we know, and what do we do next? Hepatology. 2004;40:23–26. doi:10.1002/hep.20312.
- Watkins PB, Kaplowitz N, Slattery JT, Colonese CR, Colucci SV, Stewart PW, Harris SC. Aminotransferase elevations in healthy adults receiving 4 grams of acetaminophen daily: a randomized controlled trial. JAMA. 2006;296(1):87–93. doi:10.1001/jama.296.1.87.
- Schmidt LE, Dalhoff K, Poulsen HE. Acute versus chronic alcohol consumption in acetaminophen-induced hepatotoxicity. Hepatology. 2002;35(4):876–882. doi:10.1053/jhep.2002.32148.
- Clayton TA, Baker D, Lindon JC, Everett JR, Nicholson JK Pharmacometabonomic identification of a significant host-microbiome metabolic interaction affecting human drug metabolism. Proceedings of the National Academy of Sciences of the United States of America; 2009; 106:14728–14733.
- Thaiss CA, Levy M, Korem T, Dohnalova L, Shapiro H, Jaitin DA, David E, Winter DR, Gury-BenAri M, Tatirovsky E, et al. Microbiota diurnal rhythmicity programs host transcriptome oscillations. Cell. 2016;167(6):1495–510.e12. doi:10.1016/j.cell.2016.11.003.
- Gong S, Lan T, Zeng L, Luo H, Yang X, Li N, Chen X, Liu Z, Li R, Win S, et al. Gut microbiota mediates diurnal variation of acetaminophen induced acute liver injury in mice. J Hepatol. 2018;69(1):51–59. doi:10.1016/j.jhep.2018.02.024.
- Sharma S, Chaturvedi J, Chaudhari BP, Singh RL, Kakkar P. Probiotic enterococcus lactis IITRHR1 protects against acetaminophen-induced hepatotoxicity. Nutrition. 2012;28(2):173–181. doi:10.1016/j.nut.2011.02.012.
- Saeedi BJ, Liu KH, Owens JA, Hunter-Chang S, Camacho MC, Eboka RU, Chandrasekharan B, Baker NF, Darby TM, Robinson BS, et al. Gut-resident lactobacilli activate hepatic Nrf2 and protect against oxidative liver injury. Cell Metab. 2020;31(5):956–968.e5. doi:10.1016/j.cmet.2020.03.006.
- Kolodziejczyk AA, Federici S, Zmora N, Mohapatra G, Dori-Bachash M, Hornstein S, Leshem A, Reuveni D, Zigmond E, Tobar A, et al. Acute liver failure is regulated by MYC- and microbiome-dependent programs. Nat Med. 2020;26(12):1899–1911. doi:10.1038/s41591-020-1102-2.
- Sivan A, Corrales L, Hubert N, Williams JB, Aquino-Michaels K, Earley ZM, Benyamin FW, Man Lei Y, Jabri B, Alegre M-L, et al. Commensal bifidobacterium promotes antitumor immunity and facilitates anti–PD-L1 efficacy. Science. 2015;350(6264):1084–1089. doi:10.1126/science.aac4255.
- Win S, Min RW, Chen CQ, Zhang J, Chen Y, Li M, Suzuki A, Abdelmalek MF, Wang Y, Aghajan M, et al. Expression of mitochondrial membrane–linked SAB determines severity of sex-dependent acute liver injury. J Clin Invest. 2019;129(12):5278–5293. doi:10.1172/JCI128289.
- Du K, Williams CD, McGill MR, Jaeschke H. Lower susceptibility of female mice to acetaminophen hepatotoxicity: role of mitochondrial glutathione, oxidant stress and c-jun N-terminal kinase. Toxicol Appl Pharmacol. 2014;281(1):58–66. doi:10.1016/j.taap.2014.09.002.
- Caruso R, Ono M, Bunker ME, Nunez G, Inohara N. Dynamic and asymmetric changes of the microbial communities after cohousing in laboratory Mice. Cell Rep. 2019;27(11):3401–3412.e3. doi:10.1016/j.celrep.2019.05.042.
- Koh A, De Vadder F, Kovatcheva-Datchary P, Backhed F. From dietary fiber to host physiology: short-chain fatty acids as key bacterial metabolites. Cell. 2016;165(6):1332–1345. doi:10.1016/j.cell.2016.05.041.
- Xia J, Lv L, Liu B, Wang S, Zhang S, Wu Z, Yang L, Bian X, Wang Q, Wang K, et al. Akkermansia muciniphila ameliorates acetaminophen-induced liver injury by regulating gut microbial composition and metabolism. Microbiol Spectr. 2022;10(1):e0159621. doi:10.1128/spectrum.01596-21.
- Dodd D, Spitzer MH, Van Treuren W, Merrill BD, Hryckowian AJ, Higginbottom SK, Le A, Cowan TM, Nolan GP, Fischbach MA, et al. A gut bacterial pathway metabolizes aromatic amino acids into nine circulating metabolites. Nature. 2017;551(7682):648–652. doi:10.1038/nature24661.
- Elsden SR, Hilton MG, Waller JM. The end products of the metabolism of aromatic amino acids by Clostridia. Arch Microbiol. 1976;107(3):283–288. doi:10.1007/BF00425340.
- Badenhorst CP, Erasmus E, van der Sluis R, Nortje C, van Dijk AA. A new perspective on the importance of glycine conjugation in the metabolism of aromatic acids. Drug Metab Rev. 2014;46(3):343–361. doi:10.3109/03602532.2014.908903.
- Pruss KM, Chen H, Liu Y, Van Treuren W, Higginbottom SK, Jarman JB, Fischer CR, Mak J, Wong B, Cowan TM, et al. Host-microbe co-metabolism via MCAD generates circulating metabolites including hippuric acid. Nat Commun. 2023;14(1):512. doi:10.1038/s41467-023-36138-3.
- Gutierrez-Diaz I, Fernandez-Navarro T, Salazar N, Bartolome B, Moreno-Arribas MV, Lopez P, Suárez A, de Los Reyes-Gavilán CG, Gueimonde M, González S, et al. Could fecal phenylacetic and phenylpropionic acids be used as indicators of health status? J Agric Food Chem. 2018;66(40):10438–10446. doi:10.1021/acs.jafc.8b04102.
- Gao X, Pujos-Guillot E, Sebedio JL. Development of a quantitative metabolomic approach to study clinical human fecal water metabolome based on trimethylsilylation derivatization and GC/MS analysis. Anal Chem. 2010;82(15):6447–6456. doi:10.1021/ac1006552.
- Feng HP, Huang CL, Zhang LT, Li RF. Pharmacokinetics and bioavailability of cinnamic acid in mice. J China Pharm Univ. 2004;35:328–330.
- Jollow DJ, Mitchell JR, Potter WZ, Davis DC, Gillette JR, Brodie BB. Acetaminophen-induced hepatic necrosis. II. role of covalent binding in vivo. J Pharmacol Exp Ther. 1973;187:195–202.
- Lee SS, Buters JT, Pineau T, Fernandez-Salguero P, Gonzalez FJ. Role of CYP2E1 in the hepatotoxicity of acetaminophen. J Biol Chem. 1996;271(20):12063–12067. doi:10.1074/jbc.271.20.12063.
- Manyike PT, Kharasch ED, Kalhorn TF, Slattery JT. Contribution of CYP2E1 and CYP3A to acetaminophen reactive metabolite formation. Clin Pharmacol Ther. 2000;67(3):275–282. doi:10.1067/mcp.2000.104736.
- Tonge RP, Kelly EJ, Bruschi SA, Kalhorn T, Eaton DL, Nebert DW, Nelson SD. Role of CYP1A2 in the hepatotoxicity of acetaminophen: investigations using Cyp1a2 null mice. Toxicol Appl Pharmacol. 1998;153(1):102–108. doi:10.1006/taap.1998.8543.
- Robin MA, Anandatheerthavarada HK, Fang JK, Cudic M, Otvos L, Avadhani NG. Mitochondrial targeted cytochrome P450 2E1 (P450 MT5) contains an intact N terminus and requires mitochondrial specific electron transfer proteins for activity. J Biol Chem. 2001;276(27):24680–24689. doi:10.1074/jbc.M100363200.
- Song BJ, Veech RL, Park SS, Gelboin HV, Gonzalez FJ. Induction of rat hepatic N-nitrosodimethylamine demethylase by acetone is due to protein stabilization. J Biol Chem. 1989;264(6):3568–3572. doi:10.1016/S0021-9258(18)94103-7.
- Pratt-Hyatt M, Lin HL, Hollenberg PF. Mechanism-based inactivation of human CYP2E1 by diethyldithocarbamate. Drug Metab Dispos. 2010;38(12):2286–2292. doi:10.1124/dmd.110.034710.
- Roberts BJ, Song BJ, Soh Y, Park SS, Shoaf SE. Ethanol induces CYP2E1 by protein stabilization. Role of ubiquitin conjugation in the rapid degradation of CYP2E1. J Biol Chem. 1995;270(50):29632–29635. doi:10.1074/jbc.270.50.29632.
- Dickert S, Pierik AJ, Buckel W. Molecular characterization of phenyllactate dehydratase and its initiator from clostridium sporogenes. Mol Microbiol. 2002;44(1):49–60. doi:10.1046/j.1365-2958.2002.02867.x.
- Kovacs K, Banoczi G, Varga A, Szabo I, Holczinger A, Hornyanszky G, Zagyva I, Paizs C, Vértessy BG, Poppe L, et al. Expression and properties of the highly alkalophilic phenylalanine ammonia-lyase of thermophilic Rubrobacter xylanophilus. PLoS One. 2014;9(1):e85943. doi:10.1371/journal.pone.0085943.
- Weise NJ, Ahmed ST, Parmeggiani F, Galman JL, Dunstan MS, Charnock SJ, Leys D, Turner NJ. Zymophore identification enables the discovery of novel phenylalanine ammonia lyase enzymes. Sci Rep. 2017;7(1):13691. doi:10.1038/s41598-017-13990-0.
- Xiang L, Moore BS. Biochemical characterization of a prokaryotic phenylalanine ammonia lyase. J Bacteriol. 2005;187(12):4286–4289. doi:10.1128/JB.187.12.4286-4289.2005.
- Moffitt MC, Louie GV, Bowman ME, Pence J, Noel JP, Moore BS. Discovery of two cyanobacterial phenylalanine ammonia lyases: kinetic and structural characterization. Biochemistry. 2007;46(4):1004–1012. doi:10.1021/bi061774g.
- Williams JS, Thomas M, Clarke DJ. The gene stlA encodes a phenylalanine ammonia-lyase that is involved in the production of a stilbene antibiotic in Photorhabdus luminescens TT01. Microbiol. 2005;151(8):2543–2550. doi:10.1099/mic.0.28136-0.
- Almodovar AJ, Luther RJ, Stonebrook CL, Wood PA. Genomic structure and genetic drift in C57BL/6 congenic metabolic mutant mice. Mol Genet Metab. 2013;110(3):396–400. doi:10.1016/j.ymgme.2013.06.019.
- Bourdi M, Davies JS, Pohl LR. Mispairing C57BL/6 substrains of genetically engineered mice and wild-type controls can lead to confounding results as it did in studies of JNK2 in acetaminophen and concanavalin a liver injury. Chem Res Toxicol. 2011;24(6):794–796. doi:10.1021/tx200143x.
- Duan L, Davis JS, Woolbright BL, Du K, Cahkraborty M, Weemhoff J, Jaeschke H, Bourdi M. Differential susceptibility to acetaminophen-induced liver injury in sub-strains of C57BL/6 mice: 6N versus 6J. Food Chem Toxicol. 2016;98:107–118. doi:10.1016/j.fct.2016.10.021.
- Nickel AG, von Hardenberg A, Hohl M, Loffler JR, Kohlhaas M, Becker J, Reil J-C, Kazakov A, Bonnekoh J, Stadelmaier M, et al. Reversal of mitochondrial transhydrogenase causes oxidative stress in heart failure. Cell Metab. 2015;22(3):472–484. doi:10.1016/j.cmet.2015.07.008.
- Smith EA, Macfarlane GT. Enumeration of human colonic bacteria producing phenolic and indolic compounds: effects of pH, carbohydrate availability and retention time on dissimilatory aromatic amino acid metabolism. J Appl Bacteriol. 1996;81(3):288–302. doi:10.1111/j.1365-2672.1996.tb04331.x.
- Burdock GA. Encyclopedia of food and color additives. Boca Raton: CRC Press; 1997.
- Mattia A, Sipes GI. WHO food additives series: 46. (JECFA) ECoFA ed. Safety evaluation of certain food additives and contaminants. 2001. [accessed 2023 Jun 12].https://www.inchem.org/documents/jecfa/jecmono/v46je07.htm
- Colosimo DA, Kohn JA, Luo PM, Piscotta FJ, Han SM, Pickard AJ, Rao A, Cross JR, Cohen LJ, Brady SF, et al. Mapping interactions of microbial metabolites with human g-protein-coupled receptors. Cell Host & Microbe. 2019;26(2):273–282.e7. doi:10.1016/j.chom.2019.07.002.
- Peters A, Krumbholz P, Jager E, Heintz-Buschart A, Cakir MV, Rothemund S, Gaudl A, Ceglarek U, Schöneberg T, Stäubert C, et al. Metabolites of lactic acid bacteria present in fermented foods are highly potent agonists of human hydroxycarboxylic acid receptor 3. PLoS Genet. 2019;15(5):e1008145. doi:10.1371/journal.pgen.1008145.
- Husted AS, Trauelsen M, Rudenko O, Hjorth SA, Schwartz TW. GPCR-Mediated signaling of metabolites. Cell Metabolism. 2017;25:777–796. doi:10.1016/j.cmet.2017.03.008.
- Correia MA. Hepatic cytochrome P450 degradation: mechanistic diversity of the cellular sanitation brigade. Drug Metab Rev. 2003;35(2–3):107–143. doi:10.1081/DMR-120023683.
- Guengerich FP, Kim DH, Iwasaki M. Role of human cytochrome P-450 IIE1 in the oxidation of many low molecular weight cancer suspects. Chem Res Toxicol. 1991;4(2):168–179. doi:10.1021/tx00020a008.
- Roy U, Joshua R, Stark RL, Balazy M. Cytochrome P450/NADPH-dependent biosynthesis of 5,6-trans-epoxyeicosatrienoic acid from 5,6-trans-arachidonic acid. Biochem J. 2005;390:719–727. doi:10.1042/BJ20050681.
- Bondoc FY, Bao Z, Hu WY, Gonzalez FJ, Wang Y, Yang CS, Hong J-Y. Acetone catabolism by cytochrome P450 2E1: studies with CYP2E1-null mice. Biochem Pharmacol. 1999;58(3):461–463. doi:10.1016/S0006-2952(99)00111-2.
- Adas F, Berthou F, Picart D, Lozac’h P, Beauge F, Amet Y. Involvement of cytochrome P450 2E1 in the (ω–1)-hydroxylation of oleic acid in human and rat liver microsomes. J Lipid Res. 1998;39(6):1210–1219. doi:10.1016/S0022-2275(20)32545-1.
- Laethem RM, Balazy M, Falck JR, Laethem CL, Koop DR. Formation of 19(S)-, 19(R)-, and 18(R)-hydroxyeico-satetraenoic acids by alcohol-inducible cytochrome P450 2E1. J Biol Chem. 1993;268:12912–12918. doi:10.1016/S0021-9258(18)31472-8.
- Beresford-Jones BS, Forster SC, Stares MD, Notley G, Viciani E, Browne HP, Boehmler DJ, Soderholm AT, Kumar N, Vervier K, et al. The Mouse gastrointestinal bacteria catalogue enables translation between the mouse and human gut microbiotas via functional mapping. Cell Host & Microbe. 2022;30(1):124–138.e8. doi:10.1016/j.chom.2021.12.003.
- Liu Y, Chen H, Van Treuren W, Hou BH, Higginbottom SK, Dodd D. Clostridium sporogenes uses reductive Stickland metabolism in the gut to generate ATP and produce circulating metabolites. Nature Microbiology. 2022;7:695–706. doi:10.1038/s41564-022-01109-9.
- Leung TM, Nieto N. CYP2E1 and oxidant stress in alcoholic and non-alcoholic fatty liver disease. J Hepatol. 2013;58:395–398. doi:10.1016/j.jhep.2012.08.018.
- Zong H, Armoni M, Harel C, Karnieli E, Pessin JE. Cytochrome P-450 CYP2E1 knockout mice are protected against high-fat diet-induced obesity and insulin resistance. Am J Physiol Endocrinol Metab. 2012;302:E532–9. doi:10.1152/ajpendo.00258.2011.
- Abdelmegeed MA, Banerjee A, Yoo SH, Jang S, Gonzalez FJ, Song BJ. Critical role of cytochrome P450 2E1 (CYP2E1) in the development of high fat-induced non-alcoholic steatohepatitis. J Hepatol. 2012;57:860–866. doi:10.1016/j.jhep.2012.05.019.
- Wang Z, Hall SD, Maya JF, Li L, Asghar A, Gorski JC. Diabetes mellitus increases the in vivo activity of cytochrome P450 2E1 in humans. Br J Clin Pharmacol. 2003;55:77–85. doi:10.1046/j.1365-2125.2003.01731.x.
- O’Shea D, Davis SN, Kim RB, Wilkinson GR. Effect of fasting and obesity in humans on the 6-hydroxylation of chlorzoxazone: a putative probe of CYP2E1 activity. Clin Pharmacol Ther. 1994;56:359–367. doi:10.1038/clpt.1994.150.
- Thakare R, Chhonker YS, Gautam N, Alamoudi JA, Alnouti Y. Quantitative analysis of endogenous compounds. J Pharm Biomed Anal. 2016;128:426–437. doi:10.1016/j.jpba.2016.06.017.
- Caporaso JG, Lauber CL, Walters WA, Berg-Lyons D, Huntley J, Fierer N, Owens SM, Betley J, Fraser L, Bauer M, et al. Ultra-high-throughput microbial community analysis on the Illumina HiSeq and MiSeq platforms. Isme J. 2012;6:1621–1624. doi:10.1038/ismej.2012.8.
- Bolyen E, Rideout JR, Dillon MR, Bokulich NA, Abnet CC, Al-Ghalith GA, Alexander H, Alm EJ, Arumugam M, Asnicar F, et al. Reproducible, interactive, scalable and extensible microbiome data science using QIIME 2. Nat Biotechnol. 2019;37:852–857. doi:10.1038/s41587-019-0209-9.
- Callahan BJ, McMurdie PJ, Rosen MJ, Han AW, Johnson AJ, Holmes SP. DADA2: high-resolution sample inference from Illumina amplicon data. Nat Methods. 2016;13:581–583. doi:10.1038/nmeth.3869.
- McCarthy DJ, Chen Y, Smyth GK. Differential expression analysis of multifactor RNA-Seq experiments with respect to biological variation. Nucleic Acids Res. 2012;40(10):4288–4297. doi:10.1093/nar/gks042.
- Robinson MD, McCarthy DJ, Smyth GK. edgeR: a bioconductor package for differential expression analysis of digital gene expression data. Bioinformatics. 2010;26(1):139–140. doi:10.1093/bioinformatics/btp616.
- Benjamini Y, Hochberg Y. Controlling the false discovery rate - a practical and powerful approach to multiple testing. J R Stat Soc B. 1995;57(1):289–300. doi:10.1111/j.2517-6161.1995.tb02031.x.
- Segata N, Izard J, Waldron L, Gevers D, Miropolsky L, Garrett WS, Huttenhower C. Metagenomic biomarker discovery and explanation. Genome Biol. 2011;12(6):R60. doi:10.1186/gb-2011-12-6-r60.
- Wieckowski MR, Giorgi C, Lebiedzinska M, Duszynski J, Pinton P. Isolation of mitochondria-associated membranes and mitochondria from animal tissues and cells. Nat Protoc. 2009;4:1582–1590. doi:10.1038/nprot.2009.151.
- Laine JE, Auriola S, Pasanen M, Juvonen RO. Acetaminophen bioactivation by human cytochrome P450 enzymes and animal microsomes. Xenobio Fate Foreign Comp Bio Sys. 2009;39:11–21. doi:10.1080/00498250802512830.
- Patten CJ, Thomas PE, Guy RL, Lee M, Gonzalez FJ, Guengerich FP, Yang CS. Cytochrome P450 enzymes involved in acetaminophen activation by rat and human liver microsomes and their kinetics. Chem Res Toxicol. 1993;6(4):511–518. doi:10.1021/tx00034a019.
- McGill MR, Lebofsky M, Norris HR, Slawson MH, Bajt ML, Xie Y, Williams CD, Wilkins DG, Rollins DE, Jaeschke H, et al. Plasma and liver acetaminophen-protein adduct levels in mice after acetaminophen treatment: dose–response, mechanisms, and clinical implications. Toxicol Appl Pharmacol. 2013;269(3):240–249. doi:10.1016/j.taap.2013.03.026.
- McGill MR, Yan HM, Ramachandran A, Murray GJ, Rollins DE, Jaeschke H. HepaRG cells: a human model to study mechanisms of acetaminophen hepatotoxicity. Hepatology. 2011;53(3):974–982. doi:10.1002/hep.24132.
- Ju C, Reilly TP, Bourdi M, Radonovich MF, Brady JN, George JW, Pohl LR. Protective role of Kupffer cells in acetaminophen-induced hepatic injury in mice. Chem Res Toxicol. 2002;15(12):1504–1513. doi:10.1021/tx0255976.
- Michael SL, Pumford NR, Mayeux PR, Niesman MR, Hinson JA. Pretreatment of mice with macrophage inactivators decreases acetaminophen hepatotoxicity and the formation of reactive oxygen and nitrogen species. Hepatology. 1999;30:186–195. doi:10.1002/hep.510300104.
- Kim BR, Hu R, Keum YS, Hebbar V, Shen G, Nair SS, Kong ANT. Effects of glutathione on antioxidant response element-mediated gene expression and apoptosis elicited by sulforaphane. Cancer Res. 2003;63:7520–7525.