
ABSTRACT
The gut microbiota is involved in the production of numerous metabolites that maintain host wellbeing. The assembly of the gut microbiome is highly dynamic, and influenced by many postnatal factors, moreover, little is known about the development of the gut metabolome. We showed that geography has an important influence on the microbiome dynamics in the first year of life based on two independent cohorts from China and Sweden. Major compositional differences since birth were the high relative abundance of Bacteroides in the Swedish cohort and Streptococcus in the Chinese cohort. We analyzed the development of the fecal metabolome in the first year of life in the Chinese cohort. Lipid metabolism, especially acylcarnitines and bile acids, was the most abundant metabolic pathway in the newborn gut. Delivery mode and feeding induced particular differences in the gut metabolome since birth. In contrast to C-section newborns, medium- and long-chain acylcarnitines were abundant at newborn age only in vaginally delivered infants, associated by the presence of bacteria such as Bacteroides vulgatus and Parabacteroides merdae. Our data provide a basis for understanding the maturation of the fecal metabolome and the metabolic role of gut microbiota in infancy.
Introduction
The fecal metabolome contains thousands of small-molecule metabolites (such as sugars, organic acids, and amino acids), most of which are products of the co-metabolism of the gut microbiota and the host that play considerable roles in maintaining host homeostasis. Accumulating evidence suggest that the fecal metabolome functionally complement the gut microbiota and reflect the metabolic interactions among the host, diet, and gut microbiota.Citation1
The assembly of the gut microbiota begins during birth and is influenced by dietary and medical factors.Citation2 Early colonization by the gut microbiome is important for infant growth and might further persistently impact lifelong health, but the underlying mechanism is unclear.Citation3,Citation4 Most of the recent studies describing the dynamics of the gut microbiota in the first year of life were conducted in large cohorts from Europe and North America.Citation5–8 As gut microbiota composition differs between geographically and cultural distinct populations since birth,Citation9 the seeding and maturation of the gut microbiota in Chinese infants is expected to be different. The changes in the gut metabolome that occur during the assembly of the gut microbiota during the first year of life, which could have a series of effects on infant health, are also largely unknown. Of particular importance are metabolites or classes of metabolites that emerge at certain stages of neonatal development, the microbe-metabolite interplay during the microbiome assembly process, and whether factors that shape the latter lead to differences in the gut metabolome, which can affect infant health.
To address these questions, we combined liquid chromatography-mass spectrometry (LC-MS)-based nontargeted metabolomics analysis and V4-16S rRNA gene sequencing analysis of fecal samples from 152 full-term Chinese infants collected longitudinally from the first days of life to 12 months () as well as their mothers sampled just after delivery.
Table 1. Clinical characteristics of infants and mothers included in the study.
Results and discussion
Gut microbiota development in different populations
In this study, we first analyzed the development of the gut microbiome in healthy Chinese children and their mothers. As previously shown that geography and lifestyle impact the infant microbiome in the first 1000 days of life,Citation10 we compared our cohort to a Swedish cohort,Citation6 which was analyzed under the same conditions. In both cohorts, the alpha diversity (estimated as community richness with phylogenetic diversity) increased as the children grew older but was still lower at 12 months compared to the diversity of the mothers’ gut microbiota (). Principal coordinate analysis (PCoA; unweighted UniFrac distance) and linear discriminant analyses (LefSe) showed that both age and geography strongly affected the gut microbiome composition in the two cohorts during the first year of life (, and Figure S1a).
Figure 1. Development of the gut microbiota with age in Chinese and Swedish cohorts. (a) Boxplot of gut microbial alpha diversity calculated by phylogenetic diversity metrics among the NB, 4 M, 12 M and mother groups. (b) Boxplot of gut microbial alpha diversity calculated by phylogenetic diversity metrics among the NB, 4 M, 12 M and mother groups in the Chinese cohort and Swedish cohort. (c) PCoA plot of the gut microbiota based on unweighted UniFrac distance among the NB, 4 M, 12 M and mother groups. The boxplots along each axis indicate the values of first and second principal coordinates, grouped by infant groups. The whisker plots indicate 95% confidence interval around medians. (d) Boxplot of unweighted UniFrac distance of gut microbiota among the NB, 4 M, 12 M and mother groups. (e-g) Discriminative bacteria of Chinese infants and Swedish infants in the NB (e), 4 M (f) and 12 M groups (g). (****p < 0.0001, ***p < 0.001, **p < 0.01, *p < 0.05).
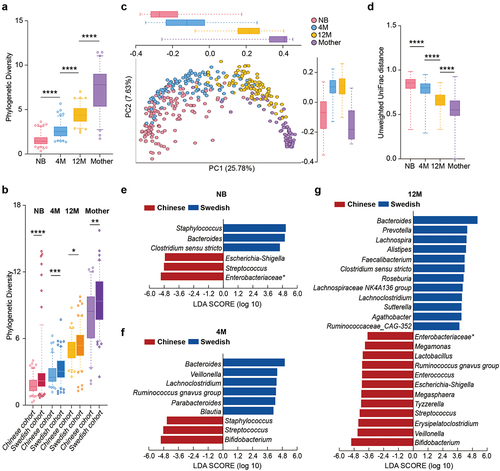
Major compositional differences between the two cohorts in the first year of life were the high relative abundance of Bacteroides in the Swedish cohort and Streptococcus in the Chinese cohort (). Compared to the Chinese infants at birth, the Swedish newborn microbiota was described by high levels of Staphylococcus and Clostridium sensu stricto (). Interestingly, high abundance of Bacteroides and Clostridium sensu stricto were also features of the Swedish mother microbiota at birth (Figure S1d). The enrichment of Proteobacteria in the newborns from the Chinese cohort, particularly Escherichia-Shigella and unclassified Enterobacteriaceae, was also in agreement with their mother’s microbiota at birth (, Figure S1b-d, and Table S1-1, Table S1-2).
At the age of 4 months, the Chinese infant microbiome was described by breast milk-associated bacteria such as Staphylococcus and Bifidobacterium, while the Swedish infant microbiome was characterized by polysaccharides degrading bacteria such as Lachnoclostridium, Ruminococcus, Blautia, and lactate-fermenting bacteria such as Veillonella (, Figure S1c, and Table S1-2). Notably, Bifidobacterium remained the dominant genus in the 12-month Chinese microbiome in addition to sugar-fermenting bacteria such as lactic acid bacteria (Lactobacillus, Enterococcus, and Streptococcus) and lactate utilizers such as Megamonas, Megasphaera, and Veillonella (, Figure S1c, and Table S1-S2). In contrast, the Swedish microbiome at 12 months was dominated by multiple bacteria involved in carbohydrate degradation, including Bacteroides, Prevotella, Alistipes, and known short-chain fatty acid producers such as Faecalibacterium, Roseburia, Lachnospiraceae, and Agathobacter (). This differences in the microbiota composition at 4 months and 12 months of life between the two populations are driven by their cultural dietary habits. At age of 4 months, solid food was already introduced to the diet of Swedish infants, which explains the presence of polysaccharide degrading bacteria as signature of their gut microbiota composition at 4-month and 12-month of age.Citation2 In comparison, solid food is introduced later than 4 months to the diet of the Chinese infants. Furthermore, at 12 months of age, the type of solid food consumed from the Chinese infants is comprised of porridge, noodles, eggs, fresh fruits and fried or boiled vegetables, meat, and fish (Table S2), which differ from the daily meal of the Swedish infants comprised of cereals, bread, cooked vegetables, meat, and fish.
Remarkably, genera associated with the mothers’ microbiome at birth highlighted their infant microbiota at the age of 12 months ( and Figure S1d), suggesting the high importance of geography and the associated dietary habits on the microbiome dynamics in the first year of life.
Global overview of the fecal metabolome in the first year of life in Chinese population
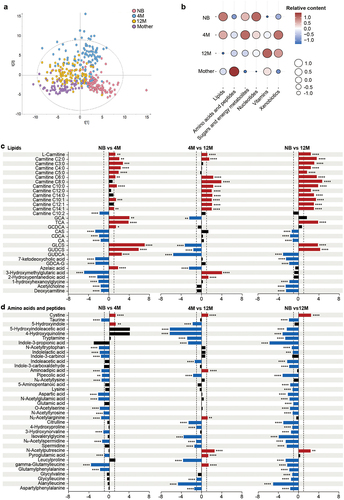
Nontargeted LC-MS-based metabolomics analysis revealed a clear separation of the fecal samples by age, as observed in the microbiome analysis, showed that the infants’ fecal metabolome also evolved with age and was still not fully mature at 12 months when compared to the mother’s fecal metabolome (). In agreement with previous data, the age-dependent profiles of fecal metabolome in our cohort were consistent with the age-specific changes in the infant diet.Citation11 The transient interruption of nutrition input just after birth promoted the catabolism of fat as the main energy metabolism pathway in newborns.Citation12 Thus, key features of the neonatal metabolome were the high levels of lipids and the low levels of amino acids, peptides, and vitamins compared to all the analyzed age groups (). Observably, with continuous milk-based diet, carbohydrates which are key compound in breast milk or formula milk, have been reported to be the major source of infant energy metabolism.Citation13 Many pathways in carbohydrates metabolism, such as galactose metabolism and fructose and mannose metabolism, become enriched with infant age.Citation14 Consistently, the levels of sugars and organic acids strongly increased in the fecal metabolome at 4 months of age (). Solid food was introduced to the Chinese infants around 6 months of age. Introductions of complementary food might be the driving force for increased branched and aromatic amino acids and reduced human milk oligosaccharides in the fecal metabolome of the infants.Citation11,Citation14 Similarly, introduction of more complex food to the infants at 12 months of age increased their protein intake and brought their diet closer to that of adults. Thus, the fecal metabolome started to resemble the mother metabolome, with low levels of lipids, sugars and nucleotides and increased amounts of amino acids and vitamins (). However, the persistently low levels of amino acids and peptides at that age compared to the mother showed that the metabolome awaited further maturation.
Figure 2. Development of the fecal metabolome with age in a Chinese cohort. (a) PLS-DA plot of the fecal metabolome in the NB, 4 M, 12 M and mother groups (R2Y = 0.385, Q2 = 0.35). The permutation test (999 times) indicates that the model is not overfitted (R2 = 0.037 Q2 = −0.076). (b) Bubble plot of the total relative content of each metabolic subclass with age. (c-d) Fold changes in lipids (c), and amino acids and peptides (d) in the NB, 4 M and 12 M groups. Fold changes were calculated as the ratio of the relative content of each metabolite between the younger age group and the older age group and converted logarithmically. Red indicates Log2 FC > 1.0 and FDR < 0.05, blue indicates Log2 FC < −1.0 and FDR < 0.05, and black indicates no significant difference. (****p < 0.0001, *** p < 0.001, ** p < 0.01, * p < 0.05).
Acylcarnitines
Acylcarnitines feature of the neonatal metabolome
Longitudinal studies of gut carnitine metabolism during the neonatal period and early infancy are rare. Here, we showed that L-carnitine and the majority of acylcarnitines presented the highest level in the fecal metabolome of the neonate, then their levels decreased gradually within the first year of life and presented the lowest measure in the mothers ( and Figure S2a), which was consistently with a previous study conducted in a Nigerian cohort.Citation15 Acylcarnitines plays an important role in the β-oxidation of fatty acids. Under normal physiological conditions, fatty acidmetabolism and oxidation are enhanced in fasted compared to fed state, and linked to increased serum levels of short- and medium- acylcarnitines.Citation16,Citation17 The stop of the nutrient supply from the mother immediately after birth makes the neonate exposed to a fasting-like state. To meet their metabolic demands, the newborns depend to a great extent on fatty acids metabolism and oxidation.Citation12,Citation18 Suggesting that fatty acid metabolism and oxidation are important energy metabolic pathways in early postnatal life potentially also in the gut.
Microbiota-associated acylcarnitine metabolism
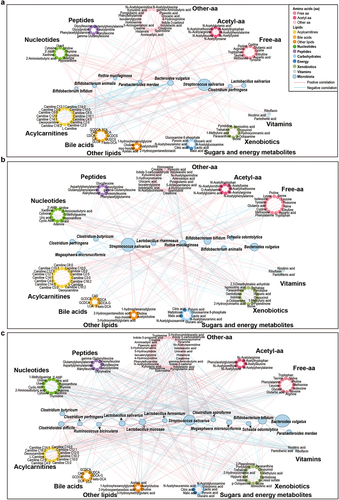
To evaluate the interaction between the developing microbiome on the metabolome and delineate microbes that shape the metabolome from birth, we integrated the infant microbiome and metabolome data. Interestingly, species inherited from the mother fecal microbiome, such as Bacteroides vulgatus, Parabacteroides merdae and Bifidobacterium bifidum, were negatively associated with acylcarnitines exclusively in the neonatal period (, and Table S3-1). Other members of the neonatal microbiome, such as Bifidobacterium animalis and Clostridium perfringens, were positively correlated with L-carnitine and short-chain acylcarnitines (, and Table S3-1). Although the links between the gut microbiota and acylcarnitines decreased as the infants grew older, the array of the microbes involved in those interactions increased. The interplay of the microbiome and the metabolome at 12 months of age shifted toward a range of median- and long-chain acylcarnitines (, and Table S3-3), associated with the increased complexity of the diet and the enhanced functional diversity of the gut microbiome at that age.Citation2
Figure 3. Networks of interactions between the gut microbiota and fecal metabolites in the NB group, 4 M group and 12 M group at the species level. (a) NB group, (b) 4 M group and (c) 12 M group. The size of the microbial node indicates the relative abundance of the bacteria.
Effect of delivery mode and diet on acylcarnitines maturation
Delivery mode and diet are crucial postnatal factors that shape gut microbiota composition and functionality since birth, and are potentially related to the risk of metabolic disorders and immune-related disease later in life.Citation2,Citation4,Citation6,Citation19 Previously, delivery mode and diet have been shown to induce clear separation in fecal metabolic profiling after birth.Citation20–22 Consistently, L-carnitine and short-chain acylcarnitines were elevated in C-section or formula-fed newborns compared with the vaginally delivered or breast-fed newborns (Figure S3a-c). However, the differences in distinct fecal aylcarnitines being identified based on delivery mode and diet in early age, were lost when the infants reached 12 months of age (data not shown). As previously reported, the C-section delivered infants’ gut microbiota communities converge with that of vaginally delivered infants over time,Citation6 the converging metabolome also revealed an intense link between microbiota and fecal metabolites. Additionally, diet is an important factor affecting the fecal metabolome, the converged metabolites profiles at 12-month infants might also be driven by the introduction of solid food to their diet.Citation23
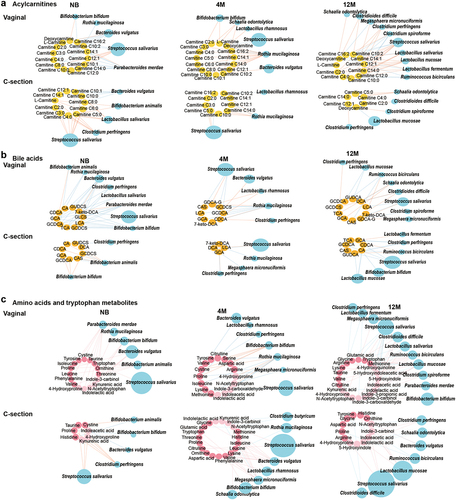
Moreover, dynamics of acylcarnitines during the first year of life were also affected by delivery mode and diet. L-carnitine and short-chain acylcarnitines were augmented only in the C-section newborns, also supported by the increased catabolism of branch-chain amino acids such as valine and leucine (). Medium- and long-chain acylcarnitines (C10:0, C12:1, and C14:1) were increased at newborn age and remained high even at 4 months only in the vaginally born infants (, and Table S4-1), suggesting the potential influence of delivery mode on fatty acid oxidation.Citation20 The accumulation of dicarboxylic fatty acids in the urine of C-section infants also supported the occurring of alternative fatty acid oxidation mechanisms.Citation24 Vaginally delivered infants have different microbiota composition and functionality from C-sectionCitation25 and therefore is expected to have different contribution to the gut metabolome. Our analysis further identified that in vaginally delivered babies strict anaerobic bacteria that originated from the mother gut microbiome, such as P. merdae and B. bifidum, were mostly negatively correlated with acylcarnitine metabolism, while B. animalis, C. perfringens, and Lactobacillus salivarius were positively associated with the acylcarnitine metabolism of C-section born infants (, and Table S5-1). Breastfeeding changes the gut microbiota in C-section infants to composition similar to vaginally born infants, by enriching the abundance of Bifidobacterium species.Citation26 Here, we observed that during the neonatal period the short-chain acylcarnitines were low in the feces of C-section delivered infants when breastfed, but formula feeding, even combined with breast milk, increased the levels of short-chain acylcarnitines (Figure S4, and Table S4-3). Feeding with formula milk promotes the abundance of species such as C. perfringens,Citation27,Citation28 which strongly correlated with the increased levels of short-chain acylcarnitines (, and Table S5-1).
Figure 4. Effects of delivery mode and feeding on infant fecal metabolism and gut microbiota, and the association of short-chain acylcarnitines at birth with infant growth. (a) Heatmap of variation in fecal metabolites in the NB, 4 M and 12 M groups based on delivery mode. The ratio of the relative content of each metabolite between the different groups was calculated and converted logarithmically to make a heatmap. Asterisks (*) indicate metabolites with |Log2 FC| > 1.0 and FDR < 0.05. (b) Impact of feeding on the variations in acylcarnitines, bile acids and tryptophan metabolites with age in vaginal infants. (c) Heatmap of the Spearman correlation coefficients between acylcarnitines at birth and infant weight gain during the first year of life. Asterisks (*) indicate a significant correlation (p < 0.05). (d) Boxplots of the correlation between shorth-chain acylcarnitines and infant growth from birth to 12 months old (*p < 0.05). (e) Discriminative bacteria based on delivery mode in the Chinese and Swedish cohorts. (f) Discriminative bacteria based on levels of short-chain acylcarnitines. Data are represented as mean ± SEM. Short-chain acylcarnitines were tertiled based on the relative abundance, separately. T1 indicates the lowest tertile and T3 indicates the highest tertile (*p < 0.05 and LDA score above 2).
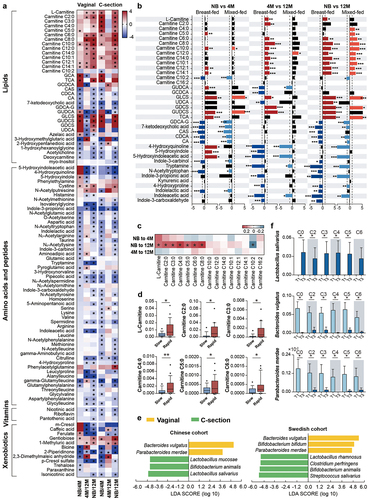
Figure 5. Maturation of the microbe-metabolome interaction in the NB, 4 M and 12 M groups based on delivery mode. (a) Acylcarnitines, (b) bile acids, (c) amino acids and tryptophan metabolites. Associations of other amino acids and derivatives with gut microbiota based on delivery mode are shown in Figure S6a. The size of the microbial node indicates the relative abundance of the bacteria.
Short-chain acylcarnitines at birth promote rapid infant growth
Previous research has shown that carnitine concentration strongly depends on neonate birth weight.Citation12 Here, we analyzed if the levels of acylcarnitines at birth might affect infant growth in the first year of life. Infants were grouped based on weight calculated by variation of standard deviation (SD) score of weight from birth to 12-month-old (slow, normal, and rapid). Results showed that higher levels of L-carnitine and short-chain acylcarnitines were all positively associated with rapid growth of infants in the first year of life (). Bacteroides vulgatus and P. merdae were acylcarnitines-related species (, and Table S3-1), and they have been reported as lean microbiota that rescues the metabolic phenotype and obesity development.Citation29 Consistently, in our study those species were key microbes of the vaginal microbiome and highly abundant in infants with low levels of short-chain acylcarnitines (). Lactobacillus salivarius, a key member of the C-section microbiome and associated with the short-chain acylcarnitines metabolism, was highly abundant in the high tertile groups of all short-chain acylcarnitines (). Moreover, all high short-chain acylcarnitine groups were dominated by C-section newborns, while low short-chain acylcarnitine groups were mostly comprised of vaginal newborns (Table S6). Here, we hypothesize that the gut microbiota might be important in neonatal gut acylcarnitines metabolism and the related long-term impact on infant growth, but this need to be additionally experimental validated.
Bile acids
The gut microbiota is a key modulator of bile acid metabolism by promoting chemical modifications of primary bile acids in the gut and thus affecting the chemical diversity of bile acids.Citation30 The complex crosstalk between the gut microbiota and bile acids determines host health,Citation31 and might have a significant impact on host wellbeing since infancy, but the latter is still poorly described.
Bile acids of the infant metabolome
Newborn babies had high presence of conjugated bile acids in feces, including glycocholic acid (GCA), taurocholic acid (TCA) and glycochenodeoxycholic acid (GCDCA) (), in agreement with previous report where conjugated bile acids became abundant immediate after birth.Citation32 Another feature of the newborn metabolome was high levels of secondary conjugated sulfated bile acids, such as glycoursodeoxycholic acid 3-sulfate (GUDCS) and glycolithocholic acid 3-sulfate (GLCS), which originated from the secondary bile acids ursodeoxycholic acid (UDCA) and lithocholic acid (LCA), the bile acids which were exclusively abundant in the mothers’ metabolome (, and Table S7). Furthermore, we detected presence of keto-bile acids in the 12-month infant fecal metabolome, such as 7-ketodeoxycholic acid ().
The mature microbiome drives bile acid succession
At neonate age, there was an extensive link between the microbiome and conjugated primary bile acids (, and Table S3-1). Microbes from the gut that possess bile salt hydrolase (BSH) activity are involved in the deconjugation of conjugated primary bile acids.Citation31 Species, such as B. animalis, B. bifidum, L. salivarius, C. perfringens, B. vulgatus, and P. merdae, are known to have multiple BSH and thus be involved in the primary bile acids deconjugation.Citation33–37 We identified in our analysis that those species were negatively associated with conjugated primary bile acids (, and Table S3-1), suggesting that for the deconjugation of primary bile acids more complex microbial community is required,Citation32 and thus the functional repertoire of the neonatal gut microbiome was still limited. With age, the number of the interactions between the microbiome and the secondary bile acid metabolism increased (, and Table S3-1, Table S3-2, Table S3-3). With the maturation of the microbiome, the increasing level of 7-ketodeoxycholic acid suggest that the mature microbiome is needed to enhance the microbial biotransformation of bile acids in the large intestine. Species such as B. vulgatus, P. merdae and Ruminococcus bicirculans, particularly at 12 months of age, positively correlated with the levels of iso-DCA (7-ketodeoxycholic acid) (, and Table S3-3), which further confirmed the involvement of the gut microbiota in the maturation of bile acid metabolism.Citation32,Citation38
Effect of delivery mode and diet on bile acids maturation
The C-section delivery strongly affected the infant’s bile acids maturation. Indeed, in the first year of life, C-section delivered babies showed less variations in the fecal bile acid concentration when compared to the vaginally born infants (, and Table S4-1). Additionally, continuous breastfeeding of vaginally delivered infants not only increased the bile acid diversity at birth but also augmented secondary bile acids at 12 months of age (, and Table S4-2). In comparison, the vaginal microbiome at 12 months of age was highly interacted with the epimerization and sulfonation of bile acids, represented by species such as C. difficile (, and Table S5-2).
Amino acids
Amino acids are an essential component of infant nutrition, and their content in breast milk is optimal for supporting healthy neonate growth during the first months of life.Citation39 Amino acids and peptides were identified as the most diverse cluster of fecal metabolites measured in our cohort (, and Table S7).
The age-specific characteristics of amino acids
The sulfur amino acid cystine was the only amino acid abundant in the neonatal metabolome and depleted in the 12-month and the mother groups ( and Figure S2b), in agreement with the previous report where variations in cystine content occur during lactation.Citation40 Tryptophan catabolites including indolelactic acid, indole-3-carbinol, indole-3-propionic acid, indoleacetic acid and tryptamine were abundant in the metabolome at 12 months (), but at lower levels than mothers (Figure S2b), and they are all well-recognized contributors to intestinal homeostasis.Citation41 Finally, we observed that the diversity of amino acids and peptides in the infant metabolome increased greatly with age in the first year of life, including enrichment of acetylated amino acids and dipeptides in the 4-month and 12-month metabolomes ().
Crosstalk of infant gut microbiota and amino acids metabolism
Microbiome-metabolome data showed a positive association between B. bifidum and indolelactic acid (Table S3–3), in agreement with a previous observation where breast milk promoted Bifidobacterium-enhanced tryptophan catabolism in nursing infants.Citation42 Tryptamine was positively correlated with Clostridioides difficile and Clostridium butyricum (Table S3–3), supporting by the idea that clostridia species was required for tryptamine production.Citation41,Citation43 Amino acid derivatives presented the least associations with the gut microbiota in early life, but the number and complexity of those associations increased with age (Mann–Whitney U-test, p < 0.01) (, and Table S3-1, Table S3-2, Table S3-3). This is probably driven by the changes in the infant diet, as introduction of high-protein solid foods promotes the colonization of the infant’s gut with protein-utilizing bacteria. For instance, Lactobacillus species were the main bacteria associated with monomeric amino acids and acetylated amino acids at 12 months of age (, and Table S3-3), and this association was also supported by the positive correlation between Lactobacillus mucosae and N-acetylputrescine (Table S3-3),Citation44 a breakdown product of amino acid. This is in agreement with the observation that Lactobacillus species can easily grow in media with free amino acids or peptides as sole nitrogen sourcesCitation45 and on genomic level the most abundant genes in Lactobacillus species are those related to amino acid transport and metabolism.Citation46 In addition to cereals, supplementation with meat, fish or egg yolk in the diet may facilitate colonization by Ruminococcaceae in the infant gut.Citation47 Consistent with this, we identified numerous interactions between R. bicirculans and multiple amino acids, especially with acetylated amino acids at 12 months of age (, and Table S3-3).
Effect of delivery mode and diet on amino acids metabolism
Breastfeeding promotes the increased microbial synthesis of cysteine,Citation48 and interestingly, microbiome-metabolome analysis suggested a strong positive interaction between cystine and S. salivarius (Table S3-1). The last is a common member of the breast milk microbiome shown to contain and express metabolic pathways for cysteine biosynthesis during colonization in gnotobiotic piglets.Citation49 Also, we found that breast milk exposure modulated tryptophan metabolism during the first year of life. While kynurenine and serotonin metabolites, essential for the development of the neonatal neuroimmune system,Citation50 were abundant at neonatal age in the vaginally breastfed infants and positively correlated to microbes such as B. bifidum, B. vulgatus, and P. merdae (, and Table S4-2, Table S5-3). Tryptamine and metabolites related to the direct conversions of tryptophan degradation increased with the maturation of the microbiome of the vaginally delivered infants and were associated with bacteria such as R. bicirculans (, and Table S5–3). In addition, the neurotransmitter as gamma-aminobutyric acid (GABA) was increased in C-section infants from 4 months of age and N-acetylputrescine, a precursor of the GABA, was exclusively elevated in the vaginally born infants since the first week of life (, and Table S4-1), suggesting the importance of the vaginal neonatal metabolome and microbiome in brain development since early life.Citation51
Other basal metabolites
Dynamics of other basal metabolites during the first year of life
Carbohydrates are significant fraction in breast milk.Citation13 After continuous breastfeeding since birth, the majority of the detected sugars had the highest levels in the metabolome at 4 months of age (Figure S2c and Figure S5a). As expected, human milk oligosaccharides (HMOs), such as N-acetylneuraminic acid (e.g., sialic acid) and maltose, were most abundant in the 4-month metabolome (Figure S5a). Uridine that activates innate immune response,Citation52 was the only nucleoside strongly abundant from the first week of life (Figure S2d and Figure S5b). Vitamin B complexes, including riboflavin, nicotinic acid and pantothenic acid, were all abundant at 12 months of age and presented at even higher levels in the mother’s metabolome (Figure S2e and Figure S5c). Additionally, xenobiotics that are well-known metabolites of the adult-type microbiota, namely, ferulate, 2-piperidinone, p-cresol sulfate, caffeic acid and isonicotinic acid, were highly abundant in the metabolome at 12 months of age (Figure S5d). Interestingly, paraxanthine, the primary metabolite of caffeine that can reflect coffee intake,Citation53 was increased in the metabolome at 4 months of age (Figure S2f and Figure S5d), suggesting possible transfer of this metabolite through breast milk from the mother.
The age-specific association between gut bacteria and other basal metabolites
Metabolome-microbiome analysis showed that bacteria involved in HMO metabolism, such as B. bifidum, B. animalis, and Rothia mucilaginosa,Citation54,Citation55 were sugar-associated bacteria in the newborn and 4-month groups (, and Table S3-1, Table S3-2). Many of those interactions also showed the highest correlation coefficients also at 4 months of age (Table S3-1, Table S3-2 and Table S3-3). The presence of clostridia species, such as R. bicirculans, in the infants microbiome at age of 12 months correlated to the production of riboflavin, nicotinic acid and pantothenic acid (, and Table S3-3), which is in agreement with a recent data that clostridia was able to produce vitamin B complex.Citation56 Moreover, more species were involved in vitamin and xenobiotic metabolism with age, exclusively in the vaginally born ones (, Figure S6b-c, and Table S4-1, Table S5-4, Table S5-5).
Conclusions
Our data showed that lipid metabolism is critical in the newborn gut due to the limited intake of nutrients and the increasing energy requirements for the newborn growth and development. Furthermore, we showed the importance of the delivery mode- and diet-driven microbiome in lipid metabolism and propose certain species that could protect against early life metabolic disorders. Altogether, the maturation of the fecal metabolome is related to the energy metabolism migration in the infant gut during the first year of life, driven by the diet and the gut microbiota, an important player in the adaption of nutrient conversion. The integration of the microbiome and metabolomics data provides new perspectives to better understand the link between the gut microbiota and its metabolites during infant growth and development, as well as a theoretical basis for future nutritional assessment and disease treatment of infants.
Materials and methods
Participants and sample collection
A total of 152 mothers and infants were recruited for the study between May 2018 and September 2019 in China. Inclusion criteria were no chronic disease of mothers (e.g., hypertension and cardiovascular disease), a gestational age between 37 and 42 weeks, and healthy infants without prematurity or genetic disease. Infant feces were collected in the first days after birth (NB group), at 4 months (4 M group) and 12 months (12 M group) of age. Mothers’ fecal samples were collected within 10 days after delivery (mother group). Among the newborns, 35% of them were breastfeeding. By 4 months, the rate of exclusive breastfeeding increased to 75%. In China, most of the newborns are fed with both breast milk and formula in the first few days after delivery. Even if not recommended by the pediatricians, the mothers provide both, breast milk and formula, as they consider that the amount of breast milk is not enough for their babies at that period. Therefore, exclusive breastfeeding rate among newborns is low. However, as the amount of breast milk gradually increases with lactation, the rate of exclusive breastfeeding increases, and a considerable number of mothers switch to exclusive breast milk feeding of their babies. That’s why more infants were breastfeeding at 4 months of age compared with the newborns. Fresh fecal samples were stored at 4°C (maximum 24 h) and transferred to −80°C for long-term storage until further analysis. General information on infants and mothers, including feeding patterns, delivery mode and medication, was recorded in questionnaires. The study was approved by the Ethics Committee of the First Affiliated Hospital of Zhengzhou University. Written informed consent was obtained from all the mothers.
Raw sequencing data representing the fecal microbiota of infants from the Swedish cohort with complete series at NB, 4 M, and 12 M were obtained after matching the proportion of vaginally delivered infants.Citation6 In total, sequencing data from 530 samples, collected longitudinally to study the development of the gut microbiota in a Swedish cohort, were included in the analysis (NB group: n = 158; 4 M group: n = 135; 12 M group: n = 129; Mother group: n = 108). Similar to the Chinese cohort, the rates of vaginal delivery in the different age groups of Swedish infants were 68% (NB group), 81% (4 M group) and 86% (12 M group). The fecal samples from the Chinese cohort were collected, prepared for sequencing and sequenced with the same protocol as the Swedish cohort. Unsupervised clustering was conducted to check the batch effect, and the results showed that no batch effect between the two cohorts (Figure S7).
The weight standard deviation (SD) scores of the newborns from the Chinese cohort were calculated according to the Chinese newborn references, adjusting for gestational age and sex.Citation57 The weight SD scores of the 4-month and 12-month infants were calculate with the Chinese child growth reference, correcting for sex and age.Citation58 To evaluate the relations between short-chain acylcarnitines and the infant growth from birth to 12-month-old, variations in SD scores during the first year of life were calculated (scores at old age minus scores at young age). An increase in SD score greater than 0.67 was grouped as rapid growth, and a reduce in SD scores for weight by more than 0.67 suggested slow growth.Citation59
DNA extraction and sequencing
Genomic DNA was isolated from 130 to 150 mg of fecal samples using a previously described method with slight modifications on the PCR system.Citation6 In our study, the V4 region of the 16S rRNA gene was amplified in a 25 µL volume containing Phusion High-Fidelity PCR Master Mix with HF Buffer (Thermo Scientific, F-531 L), 200 nM of each primer, and 20 ng of genomic DNA. The amplified V4 region of the 16S rRNA gene was then subjected to 250-bp paired-end sequencing on an Illumina MiSeq instrument (RTA version 1.18.54, MSC version 2.4, Illumina, San Diego, CA, USA) with the V2 MiSeq SBS kit (Illumina, MS-102-2003).
Preprocessing of the 16S rRNA gene
After removing samples with fewer than 1,000 reads (two samples from the 12 M group and one sample from the mother group were excluded), we obtained a total of 21,691,557 high-quality reads, with an average of 55,619 ± 29,921 sequences/sample (mean ± SD; range 2,208 to 357,251) in the Chinese cohort. Raw sequencing data were analyzed using Quantitative Insights into Microbial Ecology 2 (QIIME 2) software V 2021.2.Citation60 Demultiplexed fastq files were first imported into QIIME2 using the manifest importing tool. The paired-end reads were then quality filtered, paired-end merged and chimera filtered using DADA2.Citation61 To correct for differences in sequencing depth between the two cohorts, samples were subsampled to the same number of reads (2208 reads). The “core-metrics-phylogenetic” methods were applied for downstream diversity analysis (α- and β-diversity indexes). The biodiversity of the samples (α-diversity) was calculated using the faith phylogenetic diversity. The similarity between samples (β-diversity) was calculated by unweighted UniFrac distance and represented with the emperor in a three-dimensional principal coordinate analysis (PCoA). Unique amplicon sequence variants (ASVs) were assigned a taxonomy and aligned to the SILVA database v 138_99 at 99% similarity. The taxonomic composition table was exported at the phylum, genus and the species levels, with the relative abundance of taxa summed to 1.
LC-MS based nontargeted metabolomics analysis
Approximately 50 mg of fecal sample was mixed with 1 mL of methanol/water (1:1, v/v) solvent containing internal standards (ISs, Table S8) in an Eppendorf tube and then homogenized twice (30 Hz, 1 min) in a frozen mixed ball grinding machine (MM400, Retsch Technology, Han, Germany). Then, the mixture was centrifuged at 10,000 ×g and 4°C for 10 min. Finally, 800 μL of the supernatant was transferred to a new Eppendorf tube for lyophilization. The freeze-dried sample was reconstituted with 300 μL of acetonitrile/water (1:3, v/v) on a vortex mixer for 30 sec, and the mixture was centrifuged at 10,000 ×g and 4°C for 10 min. The supernatant was filtered through a 0.22-μm filter membrane and then used for analysis. A pooled quality control (QC) sample was prepared by mixing equal volumes of the supernatants of all samples to evaluate data quality.
Metabolomics analysis was performed on an ultra-performance liquid chromatography (UPLC, Waters, Milford, MA, USA)-Q Exactive HF MS (Thermo Fisher Scientific, Rockford, IL, USA) system using an ACQUITY UPLC BEH C8 column (Waters, 100 mm × 2.1 mm, 1.7 μm) in both positive and negative ion modes. The mobile phases were water with 0.1% formic acid solution (A phase) and acetonitrile with 0.1% formic acid solution (B phase) in both positive and negative ion modes. The column temperature was set at 50°C, and the elution flow rate was set at 0.35 mL/min. In the positive ion mode, the gradient started at 5% B, holding for 1 min, followed by a linear increase to 55% B within 14 min, arriving at 100% B at 15 min and holding for 3 min, and finally returning to 5% B and holding for 2 min for post-equilibration. In the negative ion mode, the gradient started at 2% B, holding for 1 min, followed by a linear increase to 72% B within 13 min, arriving at 100% B at 14 min and holding for 3 min, and finally returning to 5% B and holding for 3 min for post-equilibration. The MS conditions were well described in the previous research.Citation62
Metabolite identification and data preprocessing
Metabolite identification was conducted by combining the OSI-SMMS databaseCitation63 and the Massbank of North America (MONA) database (https://mona.fiehnlab.ucdavis.edu/) to examine the accurate mass, retention time and MS/MS fragments. Raw data were imported to TraceFinder (version 3.2, Thermo Fisher Scientific, Rockford, IL, USA) for peak extraction to generate a peak list with the m/z, retention time and peak area of the identified metabolites in each sample.
Metabolites in QC samples were used to evaluate the quality of the metabolomic data. Peak area of metabolites in QC samples were calibrated with the ISs that has the similar chemical properties with the metabolites, and the relative standard deviation (RSD) value after calibration was calculated. Ninety-four percent of the metabolites had the RSD value less than 30%, and were included in the following analysis. In analytical samples, metabolites detected in more than half of samples in any of the four groups were included in the following analysis, and a minimum value was assigned for undetected metabolites. A total of 152 metabolites were included with the following analysis, including 40 lipids, 68 amino acids and peptides, 10 sugars and energy metabolites, 13 nucleotides, 3 vitamins and 18 xenobiotics (Table S7), with 118 metabolites detected in all groups. Prior to follow-up analysis, the original peak area of the metabolites in analytical samples was corrected with the same IS as QC samples. Finally, sample weight was corrected for each sample.
Statistical analysis
All the boxplots, pie charts, bar plots, and heatmaps were constructed in GraphPad Prism 9.0 (GraphPad Software Inc., USA). The Mann–Whitney U-test was applied for difference analysis. The false discover rate (FDR) was controlled by the Benjamini–Hochberg method and a corrected p value < 0.05 was considered as statistically significant.
Discriminative bacteria were identified by LefSe, with linear discriminant analysis (LDA) score above 2.0.Citation64
PLS-DA of the fecal metabolome was performed by SIMCA (version 14.1, Umetrics AB, Umea, Sweden). The permutation test was used to check if the model was overfitted. The bubble matrix was plotted by an online platform (http://www.bioinformatics.com.cn). Levels of the metabolites were compared based on the logarithmic ratio of relative contents and the significantly different metabolites were defined in terms of a combination of the fold change (FC) and the FDR (|Log2 FC| > 1.0 and FDR < 0.05).
To explore the crosstalk of the gut microbiota and fecal metabolites, the Spearman correlation coefficient (r) between microbial taxa and the fecal metabolites was calculated, and significant correlations (|r| > 0.2 and p < 0.05) were visualized in Cytoscape (version 3.7.1). Microbes with a relative abundance >1% or microbiota with a relative abundance >0.1% and prevalence >10% at the species level and metabolites with a detection rate above 50% in the corresponding group were included. In summary, a total of 223, 229, 394 significant associations of bacteria and fecal metabolites were observed in the NB, 4 M, and 12 M groups, respectively.
Author contributions
Conceptualization, P.K.D, R.O. and X.L. (Xinyu Liu); methodology, P.K.D, R.O., F.Z., S.Z., Y.Y., Q.L. and X.W., formal analysis, P.K.D and R.O., investigation, X.M., Y.Z., R.C., Z.Z. and Z.L., resources, J.D., Y.H. and Z.R., writing – original draft, P.K.D and R.O., writing – review and editing, all authors; supervision, P.K.D, X.L. (Xinyu Liu), X.L. (Xin Lu) and G.X.; funding acquisition, G.X., X.L. (Xinyu Liu) and L.Z.
Supplemental Material
Download Zip (3.5 MB)Acknowledgments
We thank all the mothers and infants who participated in this study. We thank Prof. Dr. Fredrik Bäckhed for the critical discussions during the preparation of the manuscript.
Disclosure statement
No potential conflict of interest was reported by the author(s).
Data availability statement
The data for this study have been deposited in the European Nucleotide Archive (ENA) at EMBL-EBI under accession number PRJEB49858 (https://www.ebi.ac.uk/ena/browser/view/PRJEB49858), and the data for the Swedish cohort under PRJEB38986 (https://www.ebi.ac.uk/ena/browser/view/PRJEB38986). All data are available in the main text or the supplementary materials.
Supplementary material
Supplemental data for this article can be accessed online at https://doi.org/10.1080/19490976.2023.2231596
Additional information
Funding
References
- Koh A, Bäckhed F. From association to causality: the role of the gut microbiota and its functional products on host metabolism. Mol Cell. 2020;78(4):584–18. doi:10.1016/j.molcel.2020.03.005.
- Bäckhed F, Roswall J, Peng Y, Feng Q, Jia H, Kovatcheva-Datchary P, Li Y, Xia Y, Xie H, Zhong H, et al. Dynamics and stabilization of the human gut microbiome during the first year of life. Cell Host & Microbe. 2015;17(5):690–703. doi:10.1016/j.chom.2015.04.004.
- Gensollen T, Iyer SS, Kasper DL, Blumberg RS. How colonization by microbiota in early life shapes the immune system. Science. 2016;352(6285):539–544. doi:10.1126/science.aad9378.
- Li H, Zhou Y, Liu J. The impact of cesarean section on offspring overweight and obesity: a systematic review and meta-analysis. Int J Obes (Lond). 2013;37(7):893–899. doi:10.1038/ijo.2012.195.
- Reyman M, van Houten MA, van Baarle D, Bosch A, Man WH, Chu M, Arp K, Watson RL, Sanders EAM, Fuentes S, et al. Impact of delivery mode-associated gut microbiota dynamics on health in the first year of life. Nat Commun. 2019;10(1):4997. doi:10.1038/s41467-019-13014-7.
- Roswall J, Olsson LM, Kovatcheva-Datchary P, Nilsson S, Tremaroli V, Simon MC, Kiilerich P, Akrami R, Kramer M, Uhlen M, et al. Developmental trajectory of the healthy human gut microbiota during the first 5 years of life. Cell Host Microbe. 2021;29(5):765–776.e3. doi:10.1016/j.chom.2021.02.021.
- Bokulich NA, Chung J, Battaglia T, Henderson N, Jay M, Li H, Lieber AD, Fen W, Perez-Perez GI, Chen Y, et al. Antibiotics, birth mode, and diet shape microbiome maturation during early life. Sci Transl Med. 2016;8(343):343ra82. doi:10.1126/scitranslmed.aad7121.
- Pannaraj PS, Li F, Cerini C, Bender JM, Yang S, Rollie A, Adisetiyo H, Zabih S, Lincez PJ, Bittinger K, et al. Association between breast milk bacterial communities and establishment and development of the infant gut microbiome. JAMA Pediatr. 2017;171(7):647–654. doi:10.1001/jamapediatrics.2017.0378.
- Yatsunenko T, Rey FE, Manary MJ, Trehan I, Dominguez-Bello MG, Contreras M, Magris M, Hidalgo G, Baldassano RN, Anokhin AP, et al. Human gut microbiome viewed across age and geography. Nature. 2012;486(7402):222–227. doi:10.1038/nature11053.
- Olm MR, Dahan D, Carter MM, Merrill BD, Yu FB, Jain S, Meng X, Tripathi S, Wastyk H, Neff N, et al. Robust variation in infant gut microbiome assembly across a spectrum of lifestyles. Science. 2022;376(6598):1220–1223. doi:10.1126/science.abj2972.
- Conta G, Del Chierico F, Reddel S, Marini F, Sciubba F, Capuani G, Tomassini A, Di Cocco ME, Laforgia N, Baldassarre ME, et al. Longitudinal multi-omics study of a mother-infant dyad from breastfeeding to weaning: an individualized approach to understand the interactions among diet, fecal metabolome and microbiota composition. Front Mol Biosci. 2021;8:688440. doi:10.3389/fmolb.2021.688440.
- Meyburg J, Schulze A, Kohlmueller D, Linderkamp O, Mayatepek E. Postnatal Changes in Noenatal Acylcarnitine profile. Pediatr Res. 2001;49(1):125–129. doi:10.1203/00006450-200101000-00024.
- Ballard O, Morrow AL. Human milk composition: nutrients and bioactive factors. Pediatr Clin North Am. 2013;60:49–74. doi:10.1016/j.pcl.2012.10.002.
- Holzhausen EA, Shen N, Chalifour B, Tran V, Li Z, Sarnat JA, Chang HH, Jones DP, Goran MI, Liang D, et al. Longitudinal profiles of the fecal metabolome during the first 2 years of life. Sci Rep. 2023;13(1):1886. doi:10.1038/s41598-023-28862-z.
- Ayeni FA, Biagi E, Rampelli S, Fiori J, Soverini M, Audu HJ, Cristino S, Caporali L, Schnorr SL, Carelli V, et al. Infant and adult gut microbiome and metabolome in rural Bassa and urban settlers from Nigeria. Cell Reports. 2018;23(10):3056–3067. doi:10.1016/j.celrep.2018.05.018.
- Makrecka-Kuka M, Sevostjanovs E, Vilks K, Volska K, Antone U, Kuka J, Makarova E, Pugovics O, Dambrova M, Liepinsh E. Plasma acylcarnitine concentrations reflect the acylcarnitine profile in cardiac tissues. Sci Rep. 2017;7(1):17528. doi:10.1038/s41598-017-17797-x.
- Muoio DM. Metabolic inflexibility: when mitochondrial indecision leads to metabolic gridlock. Cell. 2014;159(6):1253–1262. doi:10.1016/j.cell.2014.11.034.
- Hahn P, Novak M. How important are carnitine and ketones for the newborn infant? Fed Proc. 1985;44:2369–2373.
- Henrick BM, Rodriguez L, Lakshmikanth T, Pou C, Henckel E, Olin A, Mikes J, Wang J, Tan Z, Chen Y, et al. Bifidobacteria-mediated immune system imprinting early in life. Cell. 2021;184(15):3884–3898.e11. doi:10.1016/j.cell.2021.05.030.
- Vidarsdottir H, Halldorsson TI, Geirsson RT, Bjarnason R, Franzson L, Valdimarsdottir UA, Thorkelsson T. Mode of delivery was associated with transient changes in the metabolomic profile of neonates. Acta Paediatr. 2021;110(7):2110–2118. doi:10.1111/apa.15822.
- Hyde MJ, Griffin JL, Herrera E, Byrne CD, Clarke L, Kemp PR. Delivery by caesarean section, rather than vaginal delivery, promotes hepatic steatosis in piglets. Clin Sci. 2009;118(1):47–59. doi:10.1042/CS20090169.
- Brink LR, Mercer KE, Piccolo BD, Chintapalli SV, Elolimy A, Bowlin AK, Matazel KS, Pack L, Adams SH, Shankar K, et al. Neonatal diet alters fecal microbiota and metabolome profiles at different ages in infants fed breast milk or formula. Am J Clin Nutr. 2020;111(6):1190–1202. doi:10.1093/ajcn/nqaa076.
- Sillner N, Walker A, Lucio M, Maier TV, Bazanella M, Rychlik M, Haller D, Schmitt-Kopplin P. Longitudinal profiles of dietary and microbial metabolites in formula- and breastfed infants. Front Mol Biosci. 2021;8:660456. doi:10.3389/fmolb.2021.660456.
- Hill CJ, Lynch DB, Murphy K, Ulaszewska M, Jeffery IB, O’Shea CA, Watkins C, Dempsey E, Mattivi F, Tuohy K, et al. Evolution of gut microbiota composition from birth to 24 weeks in the INFANTMET Cohort. Microbiome. 2017;5(1):4. doi:10.1186/s40168-016-0213-y.
- Chu DM, Ma J, Prince AL, Antony KM, Seferovic MD, Aagaard KM. Maturation of the infant microbiome community structure and function across multiple body sites and in relation to mode of delivery. Nat Med. 2017;23(3):314–326. doi:10.1038/nm.4272.
- Guo C, Zhou Q, Li M, Zhou L, Xu L, Zhang Y, Li D, Wang Y, Dai W, Li S, et al. Breastfeeding restored the gut microbiota in caesarean section infants and lowered the infection risk in early life. BMC Pediatr. 2020;20(1):532. doi:10.1186/s12887-020-02433-x.
- Nagpal R, Tsuji H, Takahashi T, Nomoto K, Kawashima K, Nagata S, Yamashiro Y. Gut dysbiosis following C-section instigates higher colonisation of toxigenic Clostridium perfringens in infants. Benef Microbes. 2017;8:353–365. doi:10.3920/BM2016.0216.
- Penders J, Thijs C, Vink C, Stelma FF, Snijders B, Kummeling I, van den Brandt PA, Stobberingh EE, van den Brandt PA. Factors influencing the composition of the intestinal microbiota in early infancy. Pediatrics. 2006;118(2):511–521. doi:10.1542/peds.2005-2824.
- Ridaura VK, Faith JJ, Rey FE, Cheng J, Duncan AE, Kau AL, Griffin NW, Lombard V, Henrissat B, Bain JR, et al. Gut microbiota from twins discordant for obesity modulate metabolism in mice. Science. 2013;341(6150):1241214. doi:10.1126/science.1241214.
- Sayin SI, Wahlström A, Felin J, Jäntti S, Marschall H-U, Bamberg K, Angelin B, Hyötyläinen T, Orešič M, Bäckhed F. Gut microbiota regulates bile acid metabolism by reducing the levels of tauro-beta-muricholic acid, a naturally occurring FXR antagonist. Cell Metab. 2013;17:225–235. doi:10.1016/j.cmet.2013.01.003.
- Wahlström A, Sayin SI, Marschall H-U, Bäckhed F. Intestinal crosstalk between bile acids and microbiota and its impact on host metabolism. Cell Metab. 2016;24:41–50. doi:10.1016/j.cmet.2016.05.005.
- van Best N, Rolle-Kampczyk U, Schaap FG, Basic M, Olde Damink SWM, Bleich A, Savelkoul PHM, von Bergen M, Penders J, Hornef MW. Bile acids drive the newborn’s gut microbiota maturation. Nat Commun. 2020;11(1):3692. doi:10.1038/s41467-020-17183-8.
- Narushima S, Itoha K, Miyamoto Y, Park S-H, Nagata K, Kuruma K, Uchida K. Deoxycholic acid formation in gnotobiotic mice associated with human intestinal bacteria. Lipids. 2006;41(9):835–843. doi:10.1007/s11745-006-5038-1.
- Jia W, Xie G, Jia W. Bile acid–microbiota crosstalk in gastrointestinal inflammation and carcinogenesis. Nat Rev Gastroenterol Hepatol. 2017;15(2):111–128. doi:10.1038/nrgastro.2017.119.
- Geun-Bae K, Byong-Hee L. Biochemical and molecular insights into bile salt hydrolase in the gastrointestinal microflora - a review. Asian-Australas J Anim Sci. 2005;18(10):1505–1512. doi:10.5713/ajas.2005.1505.
- Macdonald IA, Hutchison DM, Forrest TP, Bokkenheuser VD, Winter J, Holdeman LV. Metabolism of primary bile acids by Clostridium perfringens. J Steroid Biochem. 1983;18(1):97–104. doi:10.1016/0022-47318390336-9.
- Zhu L, Liao R, Huang J, Xiao C, Yang Y, Wang H, He D, Yan H, Yang C. Lactobacillus salivarius SNK-6 regulates liver lipid metabolism partly via the miR-130a-5p/MBOAT2 pathway in a NAFLD model of laying hens. Cells. 2022;11(24):4133. doi:10.3390/cells11244133.
- Tanaka M, Sanefuji M, Morokuma S, Yoden M, Momoda R, Sonomoto K, Ogawa M, Kato K, Nakayama J. The association between gut microbiota development and maturation of intestinal bile acid metabolism in the first 3 y of healthy Japanese infants. Gut Microbes. 2020;11(2):205–216. doi:10.1080/19490976.2019.1650997.
- Lönnerdal B, Woodhouse LR, Glazier C. Compartmentalization and quantitation of protein in human milk. J Nutr. 1987;117:1385–1395. doi:10.1093/jn/117.8.1385.
- Garcia-Rodenas CL, Affolter M, Vinyes-Pares G, De Castro CA, Karagounis LG, Zhang Y, Wang P, Thakkar SK. Amino acid composition of breast milk from urban Chinese mothers. Nutrients. 2016;8(10):606. doi:10.3390/nu8100606.
- Roager HM, Licht TR. Microbial tryptophan catabolites in health and disease. Nat Commun. 2018;9(1):3294. doi:10.1038/s41467-018-05470-4.
- Laursen MF, Sakanaka M, von Burg N, Morbe U, Andersen D, Moll JM, Pekmez CT, Rivollier A, Michaelsen KF, Molgaard C, et al. Bifidobacterium species associated with breastfeeding produce aromatic lactic acids in the infant gut. Nat Microbio. 2021;6(11):1367–1382. doi:10.1038/s41564-021-00970-4.
- Williams BB, Van Benschoten AH, Cimermancic P, Donia MS, Zimmermann M, Taketani M, Ishihara A, Kashyap PC, Fraser JS, Fischbach MA. Discovery and characterization of gut microbiota decarboxylases that can produce the neurotransmitter tryptamine. Cell Host & Microbe. 2014;16(4):495–503. doi:10.1016/j.chom.2014.09.001.
- Li N, Liang S, Chen Q, Zhao L, Li B, Huo G. Distinct gut microbiota and metabolite profiles induced by delivery mode in healthy Chinese infants. J Proteomics. 2021;232:104071. doi:10.1016/j.jprot.2020.104071.
- Jing Y, Mu C, Wang H, Shen J, Zoetendal EG, Zhu W. Amino acid utilization allows intestinal dominance of Lactobacillus amylovorus. Isme J. 2022;16(11):2491–2502. doi:10.1038/s41396-022-01287-8.
- Valeriano VDV, Oh JK, Bagon BB, Kim H, Kang DK. Comparative genomic analysis of Lactobacillus mucosae LM1 identifies potential niche-specific genes and pathways for gastrointestinal adaptation. Genomics. 2019;111(1):24–33. doi:10.1016/j.ygeno.2017.12.009.
- Laursen MF, Bahl MI, Michaelsen KF, Licht TR. First foods and gut microbes. Front Microbiol. 2017;8:356. doi:10.3389/fmicb.2017.00356.
- Baumann-Dudenhoeffer AM, D’Souza AW, Tarr PI, Warner BB, Dantas G. Infant diet and maternal gestational weight gain predict early metabolic maturation of gut microbiomes. Nat Med. 2018;24(12):1822–1829. doi:10.1038/s41591-018-0216-2.
- Raman AS, Gehrig JL, Venkatesh S, Chang HW, Hibberd MC, Subramanian S, Kang G, Bessong PO, Lima AAM, Kosek MN, et al. A sparse covarying unit that describes healthy and impaired human gut microbiota development. Science. 2019;365(6449):eaau4735. doi:10.1126/science.aau4735.
- Krautkramer KA, Fan J, Bäckhed F. Gut microbial metabolites as multi-kingdom intermediates. Nat Rev Microbiol. 2021;19(2):77–94. doi:10.1038/s41579-020-0438-4.
- Običan SG, Small A, Smith D, Levin H, Drassinower D, Gyamfi-Bannerman C. Mode of delivery at periviability and early childhood neurodevelopment. Am J Obstet Gynecol. 2015;213(4):.e578.1–.e578.4. doi:10.1016/j.ajog.2015.06.047.
- Kim E-K, Lee K-A, Hyeon DY, Kyung M, Jun K-Y, Seo SH, Hwang D, Kwon Y, Lee W-J. Bacterial nucleoside catabolism controls quorum sensing and commensal-to-pathogen transition in the Drosophila gut. Cell Host Microbe. 2020;27(3):345–357.e346. doi:10.1016/j.chom.2020.01.025.
- Horrigan LA, Kelly JP, Connor TJ. Immunomodulatory effects of caffeine: friend or foe? Pharmacol Ther. 2006;111(3):877–892. doi:10.1016/j.pharmthera.2006.02.002.
- Kitaoka M. Bifidobacterial enzymes involved in the metabolism of human milk oligosaccharides. Adv Nutr. 2012;3(3):422S–429S. doi:10.3945/an.111.001420.
- Fehr K, Moossavi S, Sbihi H, Boutin RCT, Bode L, Robertson B, Yonemitsu C, Field CJ, Becker AB, Mandhane PJ, et al. Breastmilk feeding practices are associated with the co-occurrence of bacteria in mothers’ milk and the infant gut: the CHILD cohort study. Cell Host Microbe. 2020;28(2):285–297.e4. doi:10.1016/j.chom.2020.06.009.
- Averianova LA, Balabanova LA, Son OM, Podvolotskaya AB, Tekutyeva LA. Production of vitamin B2 (riboflavin) by microorganisms: an overview. Front Bioeng Biotech. 2020;8:570828. doi:10.3389/fbioe.2020.570828.
- Liu Z, Zhang J, Zhao B, Xue X, Xu L, Wang F, Zhang Y. Population-based reference for birth weight for gestational age in northern China. Early Hum Dev. 2014;90:177–187. doi:10.1016/j.earlhumdev.2014.01.007.
- Coordinating Study Group of Nine Cities on the Physical Growth and Development of Children. [A national survey on growth of children under 7 years of age in nine cities of China, 2005]. Zhonghua Er Ke Za Zhi. 2007;45(8):609–614. doi:10.3760/cma.j.issn.0578-1310.2007.08.113.
- Ong KK, Loos RJ. Rapid infancy weight gain and subsequent obesity: systematic reviews and hopeful suggestions. Acta Paediatr. 2006;95:904–908. doi:10.1080/08035250600719754.
- Bolyen E, Rideout JR, Dillon MR, Bokulich NA, Abnet CC, Al-Ghalith GA, Alexander H, Alm EJ, Arumugam M, Asnicar F, et al. Reproducible, interactive, scalable and extensible microbiome data science using QIIME 2. Nat Biotechnol. 2019;37(8):852–857. doi:10.1038/s41587-019-0209-9.
- Callahan BJ, McMurdie PJ, Rosen MJ, Han AW, Johnson AJ, Holmes SP. DADA2: high-resolution sample inference from Illumina amplicon data. Nat Methods. 2016;13(7):581–583. doi:10.1038/nmeth.3869.
- Wang Q, Su B, Dong L, Jiang T, Tan Y, Lu X, Liu X, Lin X, Xu G. Liquid chromatography–mass spectrometry-based nontargeted metabolomics predicts prognosis of hepatocellular carcinoma after curative resection. J Proteome Res. 2020;19(8):3533–3541. doi:10.1021/acs.jproteome.0c00344.
- Zhao X, Zeng Z, Chen A, Lu X, Zhao C, Hu C, Zhou L, Liu X, Wang X, Hou X, et al. Comprehensive strategy to construct in-house database for accurate and batch identification of small molecular metabolites. Anal Chem. 2018;90(12):7635–7643. doi:10.1021/acs.analchem.8b01482.
- Segata N, Izard J, Waldron L, Gevers D, Miropolsky L, Garrett WS, Huttenhower C. Metagenomic biomarker discovery and explanation. Genome Biol. 2011;12(6):R60. doi:10.1186/gb-2011-12-6-r60.