
ABSTRACT
Colibactin, a bacterial genotoxin produced by E. coli strains harboring the pks genomic island, induces cytopathic effects, such as DNA breaks, cell cycle arrest, and apoptosis. Patients with inflammatory bowel diseases, such as ulcerative colitis, display changes in their microbiota with the expansion of E. coli. Whether and how colibactin affects the integrity of the colonic mucosa and whether pks+ E. coli contributes to the pathogenesis of colitis is not clear. Using a gnotobiotic mouse model, we show that under homeostatic conditions, pks+ E. coli do not directly interact with the epithelium or affect colonic integrity. However, upon short-term chemical disruption of mucosal integrity, pks+ E. coli gain direct access to the epithelium, causing epithelial injury and chronic colitis, while mice colonized with an isogenic ΔclbR mutant incapable of producing colibactin show a rapid recovery. pks+ E. coli colonized mice are unable to reestablish a functional barrier. In turn, pks+ E. coli remains in direct contact with the epithelium, perpetuating the process and triggering chronic mucosal inflammation that morphologically and transcriptionally resembles human ulcerative colitis. This state is characterized by impaired epithelial differentiation and high proliferative activity, which is associated with high levels of stromal R-spondin 3. Genetic overexpression of R-spondin 3 in colon myofibroblasts is sufficient to mimic barrier disruption and expansion of E. coli. Together, our data reveal that pks+ E. coli are pathobionts that promote severe injury and initiate a proinflammatory trajectory upon contact with the colonic epithelium, resulting in a chronic impairment of tissue integrity.
Introduction
Colibactin is a secondary metabolite that belongs to the group of cyclomodulins produced by E. coli of the phylogenetic group B2 and other gram-negative bacteria that carry the polyketide synthase (pks) genomic island.Citation1 Such pks+ bacteria are found in about 20% of the Western population. Although they are considered commensals in the colonic flora, pks+ E. coli have gained considerable attention as potential drivers of colorectal carcinogenesis due to their genotoxic effects.Citation2–7 Patients with inflammatory bowel disease (IBD), particularly those with ulcerative colitis, have high levels of E. coli in the gut.Citation8,Citation9 In particular, group B2 carriage has been found to be highly abundant in these patients.Citation10 Accordingly, it has been proposed that a higher proportion of IBD patients carry pks+ E. coli than healthy individuals.Citation2
Upon the direct attachment of pks+ bacteria to host cells, colibactin can cause DNA crosslinks, resulting in DNA double-strand breaksCitation1. Using organoids, we recently demonstrated that exposure to colibactin leads to the transformation of a subset of cells.Citation4 However, most cells respond with cell cycle arrest, which results in megalocytosis, cellular senescence, and apoptosis.Citation4,Citation11 The relevance of these cytopathic effects on colonic epithelial homeostasis and function in vivo remains unclear. Moreover, whether pks+ E. coli contributes to the pathogenesis of colitis has not yet been investigated. As the colon epithelium is crucial for the maintenance of an efficient barrier, we hypothesized that colibactin’s cytopathic effects have the potential to interfere with colonic tissue integrity, promote colonic crypt dysfunction, and cause colitis.
To address this, we developed a gnotobiotic E. coli-free mouse model. We successfully colonized these mice with the commensal pks+ M1/5 E. coli strain and found that colonization did not affect epithelial homeostasis. However, once mice experience a short-term chemical injury induced by dextran sulfate sodium (DSS), which transiently destroys the protective mucus barrier, pks+ E. coli gain direct access to the epithelium. As a result, they increase the severity of colitis and render the mucosa incapable of restoring a functional barrier. This promotes chronic inflammation, causing a state that resembles human ulcerative colitis.
Results
Mucus barrier disruption facilitates colibactin-induced pathology
To study how colibactin-producing E. coli affects the colon epithelium, we first obtained and established an in-house colony of specific pathogen-free (SPF) E. coli-free mice, originally colonized with the Charles River altered Schaedler`s flora (CRASF®).Citation12 Consistent with previous reports,Citation13,Citation14 our specific pathogen-free (SPF) mice appeared healthy and developed normally, showing no pathological behavior and exhibiting normal colon histology and weight when compared to mice with a conventional microbiota from our facility ().
Figure 1. Colibactin exacerbates DSS-induced colitis.
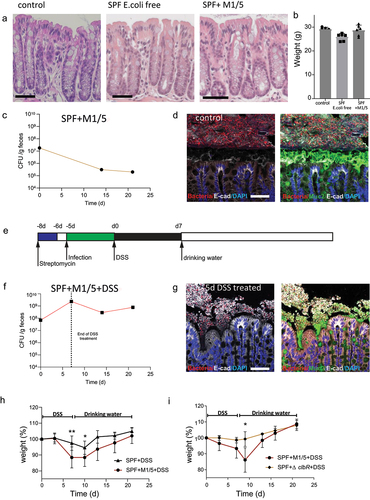
After confirming that SPF mice did not harbor E. coli, we colonized them with a commensal M1/5 E. coli isolate, which efficiently expressed colibactin and induced cytopathic effects such as DNA damage and megalocytosis in cell lines and organoids.Citation4 Mice were pretreated with streptomycin for 2 days and colonized with 1 × 10⁹ colony-forming units (CFU) of M1/5 E. coli. CFU analysis using E. coli-specific MacConkey agar plates confirmed that all mice were successfully infected, whereas no E. coli was found in uninfected mice. E. coli colonization levels gradually decreased from an initial level of approximately 1 × 10⁷ CFU/g feces to a plateau of approximately 1 × 10⁶ CFU/g feces within 2 weeks (). The infection did not induce any phenotypic or weight changes in the mice, nor did it affect the epithelial morphology in the colon ().
Colibactin-expressing E. coli rely on direct interactions with the epithelium to exert their cytotoxic effects.Citation8 We investigated whether such direct interactions occur in vivo under homeostatic conditions. Using fluorescence in situ hybridization (FISH) to map the microbial distribution in the colon of mice infected with pks+ E. coli, we found that a thick mucus layer separated the luminal microbiota from the healthy colonic epithelium, indicating that no interaction occurred between E. coli and gut epithelial cells (). Thus, we concluded that under healthy conditions, colibactin-producing E. coli are separated from the epithelium by mucus and do not affect colonic epithelial homeostasis.
We next investigated whether disruption of the mucus barrier enables pks+ E. coli to gain access to the epithelium and affect homeostasis. To address this, SPF mice were infected with M1/5 E. coli as described above, and then treated with a single 7-day cycle of DSS, starting at day 5 post-infection (). DSS is a sulfated sugar that disrupts mucus and causes colonic mucosal injury.Citation15 FISH analysis of the colon after five days of DSS treatment showed disruption of the mucus layer, with the microbiota in direct contact with the colonic epithelium (). Moreover, E. coli CFU analysis revealed that DSS treatment caused E. coli expansion (). While control SPF mice treated with DSS without prior colonization with E. coli showed only mild weight loss in response to DSS, mice colonized with pks+ E. coli showed significantly greater weight loss and delayed weight gain once DSS was discontinued ().
To address whether this effect is driven by colibactin itself, we repeated the experiment and infected the animals with either WT M1/5 E. coli or the ΔclbR isogenic mutant, which lacks clbR, a key transcriptional regulator of colibactin production.Citation16 In contrast to the mice infected with the WT M1/5 strain, mice infected with the ΔclbR mutant lost almost no weight in response to DSS treatment ().
Together, these data indicate that DSS-induced disruption of the mucus barrier enables microbes to gain direct access to the colon epithelium, leading to the expansion of resident E. coli. Under these conditions, colibactin expression is associated with severe weight loss in mice.
Colibactin enhances mucosal injury upon DSS treatment
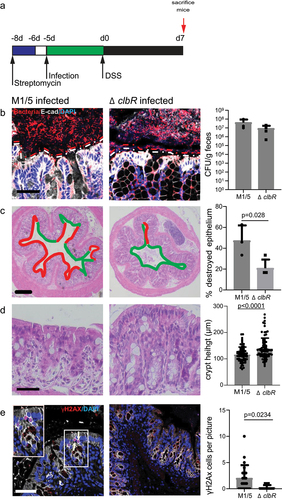
As our data indicate that colibactin causes weight loss upon DSS treatment, we investigated its effect on the colon epithelium. For this, we infected animals with WT or ΔclbR M1/5 and sacrificed them immediately after DSS treatment (). Spatial mapping of mucus thickness and microbial distribution in the colon using FISH revealed that both WT and ΔclbR infected animals experienced a disruption of the mucus layer upon DSS treatment, allowing direct interaction between microbes and surface epithelial cells (). Thus, we concluded that DSS promoted barrier disruption independently of colibactin. CFU analysis demonstrated high levels of E. coli colonization in both of the groups (, right panel). However, morphological analysis of the colon tissue using H&E staining showed that injury was significantly more extensive in mice infected with WT M1/5 E. coli compared to the mutant. Mice infected with WT E. coli had a significantly larger proportion of injured crypts, characterized by disruption of the crypt structure with only a thin remaining cell layer covering the mucosa or full lack of epithelium (ulcer formation) (). Moreover, the analysis of crypt height in the remaining crypts showed a more severe reduction in the WT M1/5 group (). As colibactin has been reported to induce DNA double-strand breaks in primary epithelial cells, leading to senescence and cell death, we next analyzed the direct effects of colibactin on colon epithelial cells in our mice. Immunolabelling for γH2AX, which detects cells with DNA breaks and marks the initiation of DNA repair, revealed an increased number of γH2AX+ cells in mice colonized with WT M1/5 compared with the ΔclbR mutant (). Taken together, we conclude that upon disruption of the mucus barrier, colibactin promotes DNA damage and extensive injury to the colon epithelium.
Figure 2. Colibactin increases the severity of tissue damage after DSS.
pks+ E. coli locks the mucosa in a chronic regenerative state
Next, we repeated the experiment but sacrificed the animals 7 days after DSS withdrawal to examine how recovery was affected by the presence of colibactin (). At this time point, mice infected with ΔclbR E. coli showed an almost completely restored mucus barrier, whereas in animals infected with WT E. coli the barrier remained inefficient, and bacteria were still able to make contact with the epithelium ().
Figure 3. Colibactin delays tissue regeneration upon injury.
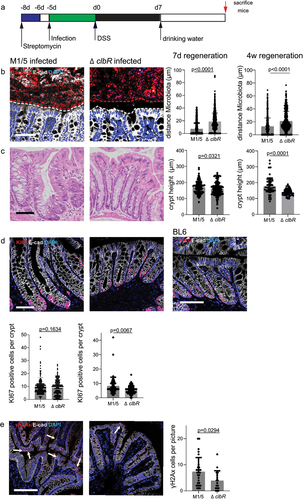
Histological analysis further revealed that crypt architecture in ΔclbR-infected animals appeared healthy, whereas WT-infected mice had elongated, polymorphic, distorted crypts with an increased number of proliferating cells marked by the expression of Ki67 (). Thus, we concluded that ΔclbR E. coli-infected mice were able to reestablish homeostasis within one week of DSS treatment, while WT-infected animals remained in a regenerative state, characterized by increased proliferation and an inefficient barrier function. Consistent with the lack of a mucus barrier, labeling for yH2AX showed that WT-infected, but not ΔclbR-infected, mice still contained a large number of positive cells, indicating that colibactin-mediated DNA damage continues in this state.
To test whether recovery in the presence of pks+ E. coli was achieved at a later time point, we treated infected animals with one cycle of DSS and allowed them to recover for 4 weeks. Even at this late time point, WT-infected mice still exhibited more severe barrier disruption, increased proliferation, and higher numbers of yH2AX+ cells than ΔclbR-infected mice (, right panels).
Thus, we concluded that colibactin impairs epithelial recovery after injury and promotes a chronic regenerative state characterized by an inefficient mucus barrier and continued epithelial cell damage.
pks+ E. coli-infected mice post-DSS develop chronic inflammation that resembles ulcerative colitis
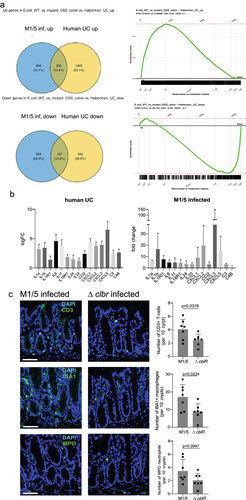
To investigate the mucosal response to colibactin in more detail, we performed transcriptome analysis of the colon tissue of WT- and ΔclbR-infected animals at 4 weeks post-DSS.
We observed that many of the most highly regulated genes were associated with inflammation. Chronic colonic inflammation is a key feature of ulcerative colitis (UC). We asked whether the transcriptional alterations in our mice displayed similarities to the changes observed in patients with ulcerative colitis. Based on previously published transcriptome data from ulcerative colitis patients,Citation17 we generated an ulcerative colitis signature gene set and performed gene set enrichment analysis (GSEA). Indeed, transcriptome data from our mice revealed a significant positive enrichment of genes upregulated in ulcerative colitis, as well as a significant negative enrichment of genes downregulated in ulcerative colitisCitation17 (). We investigated which colitis-associated genes were upregulated in our WT M1/5-infected mice and found that many of these genes were involved in critical immune signaling pathways, such as IL-1/NF-κB and IL-6 (). We next performed immunofluorescence labeling of colon tissues from mice at 4 weeks post-DSS for immune cell markers and found a significantly higher immune cell infiltration in WT M1/5 E. coli-colonized mice than in the ΔclbR-colonized animals, reflected by higher levels of CD3, IBA1, and MPO (). Thus, we conclude that colibactin triggers mucosal inflammation that transcriptionally overlaps with changes observed in ulcerative colitis.
Figure 4. Infection with pks+ E. coli causes inflammation that resembles ulcerative colitis.
The mucosa in ulcerative colitis is characterized by an up-regulation of regenerative signals that enhance proliferation and inhibit differentiation
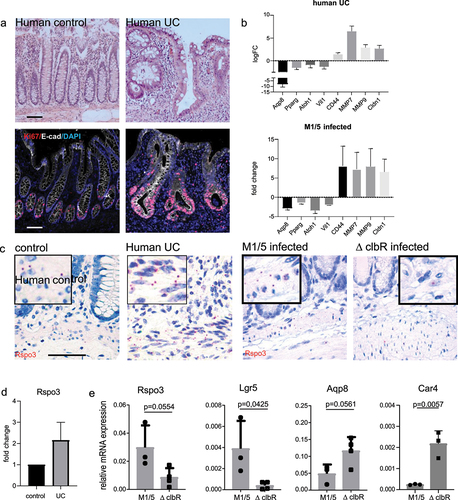
Since we found that colibactin triggered an increased proliferation of epithelial cells, we asked whether similar responses were also observed in ulcerative colitis. We obtained tissue from patients with ulcerative colitis who underwent colon surgery as well as samples of healthy mucosa from patients who underwent colon surgery for other reasons. Histological analysis and labeling for Ki67 revealed a highly proliferative, regenerative epithelium in colitis patients compared to that in healthy controls (). By further investigating which of the genes that were upregulated in both our M1/5 E. coli colonized mice and ulcerative colitis patients could promote increased proliferative activity, we identified several Wnt target genes, such as CD44 and MMP7, which are known to be expressed in colonic stem and progenitor cells (). When we analyzed genes that were downregulated in both datasets, we found several genes expressed in differentiated enterocytes: there was a loss of key enterocyte markers such as Aqp8, Car4, and Vil1, as well as PPAR-y, a key gene involved in the regulation of short-chain fatty acid metabolism in enterocytes (). Since enterocyte differentiation and the expression of the aforementioned genes are known to be negatively affected by Wnt signaling,Citation18 we searched for a regulator that could drive increased Wnt signaling. Stroma-derived R-spondin 3 has been shown to be a critical determinant of Wnt signaling and epithelial regeneration in the colon and is increased in the context of injury.Citation19,Citation20 We noticed that in the published transcriptome dataset the expression of R-spondin 3 was significantly higher in ulcerative colitis samples than in healthy controls (). RNA in situ hybridization in human samples confirmed high expression of R-spondin 3 in the stroma of ulcerative colitis patients (). Similarly, post-DSS we found increased expression of R-spondin 3 in the stroma of mice colonized with WT M1/5 E. coli compared to mice colonized with the ΔclbR mutant (, right). Using qPCR of murine colon tissue, we confirmed that compared to mice infected with the ΔclbR mutant strain, mice colonized with WT E. coli expressed increased levels of R-spondin 3 and its receptor Lgr5, which is itself a WNT/R-spondin target gene. In contrast, the enterocyte markers Aqp8 and Car4 were significantly downregulated (). Together, these data revealed increased Wnt signaling in mice colonized with M1/5 E. coli, which depends on the presence of colibactin. This is associated with increased proliferation and loss of enterocyte differentiation. All these features were also found in the colonic mucosa of patients with ulcerative colitis.
Figure 5. Epithelial changes seen in mice infected with WT M1/5 E. coli resemble those of human ulcerative colitis.
Increased R-spondin 3 expression promotes proliferation but reduces barrier integrity
To investigate whether R-spondin/Wnt signaling contributes to the mucosal responses observed in our mice, we utilized Myh11-CreERT2/Rosa26Sor 6(CAG – Rspo3) mice, which conditionally overexpress R-spondin 3 in stromal Myh11+ myofibroblasts upon administration of tamoxifen, in order to mimic the overexpression observed in WT M1/5 E. coli infected mice. Mice were sacrificed 14 days after tamoxifen treatment.
H&E staining revealed marked crypt elongation, which was associated with increased expression of Ki67, as detected by immunofluorescence labeling (). When we performed transcriptome analysis of colon tissue from WT and R-spondin 3 KI mice, we found significant upregulation of R-spondin 3, Lgr5, and MMP7 (), all of which were also upregulated in WT M1/5-colonized mice post-DSS (see ). Myc, another central target of Wnt/R-spondin, was also upregulated. Similarly, there was a significant downregulation of the key enterocyte markers Aqp8 and Car4.
Figure 6. R-spondin 3 overexpression is sufficient to disrupt the mucosal barrier.
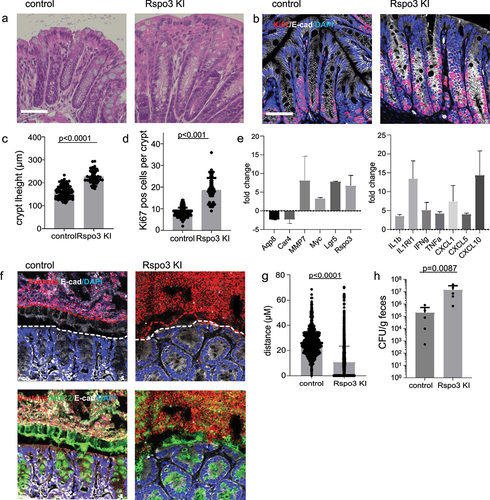
To address how this affects the mucosal barrier, we performed ISH to visualize the microbiota and found that overexpression of R-spondin 3 was sufficient to promote loss of the barrier, allowing direct interaction of bacteria with the epithelium ().
CFU analysis of E. coli in R-spondin 3 KI mice and their corresponding WT littermates at 14 days after tamoxifen treatment also confirmed a significant increase in E. coli colonization upon R-spondin 3 overexpression ().
Together, these data show that increased regeneration driven by the stem cell niche occurs at the expense of differentiation, resulting in a loss of mature cell types, insufficient barrier function, and dysbiosis characterized by an expansion of E. coli.
Overall, our data reveal a new concept of how transient disruption of the mucosal barrier can enable a powerful toxin expressed by a common member of the microbiota to initiate a long-term disruption of tissue integrity, promote a proinflammatory trajectory, and contribute to chronic colitis.
Discussion
Here, we revealed a mechanism by which colibactin-expressing E. coli can contribute to the chronification of acute experimental colitis. The resulting epithelial pathology closely resembles that of human ulcerative colitis, suggesting that this common human pathobiont can play a causative role in the development of the disease.
Crucially, the double-hit mechanism we identified explains why carriers of pks+ bacteria do not necessarily develop disease: during homeostatic conditions, the mucus barrier of the colon prevents the bacteria from reaching the epithelial cells. Only a second hit that causes mucus barrier breakdown enables bacteria to make direct contact, which in turn unleashes the full toxic potential of colibactin. Thus, we hypothesize that although pks+ E. coli are harmless to the healthy colonic mucosa, carriers are at an elevated risk of developing chronic epithelial dysfunction in the wake of an unrelated colonic injury. This would explain their overrepresentation among ulcerative colitis patients.
We have previously shown that damage to the colonic mucosa leads to the reversal of cellular hierarchy, including loss of resident stem cells and reprogramming of colonocytes into rapidly proliferating stem cells that give rise to new crypts.Citation19 This regenerative state comes at a cost: mature cells are lost, leaving the mucosa temporarily unprotected by a mucous barrier until mature crypts have been regenerated. Our findings in mice colonized with the mutant E. coli strain show that in the absence of colibactin, this regeneration process is rapid and effectively prevents major weight loss in animals. In our model, colibactin thus served as the key factor that induced cell damage and prevented homeostasis from being reestablished. Our data do not allow any conclusions to be drawn on whether colibactin actively promotes the regenerative state or whether it causes severe cell damage through which the epithelium is continually eroded. The recognition that cellular identities are not fixed and that epithelial regeneration involves the breakdown of cellular hierarchy, reprogramming of differentiated cells, and their recruitment into the stem cell pool is relatively recent.Citation21 Therefore, we have as yet no good understanding of what signals trigger the induction of the regenerative state or control the reestablishment of normal homeostasis with fully differentiated cells.
Chronic inflammatory diseases, such as Crohn´s disease or ulcerative colitis, are characterized by impaired barrier function.Citation22 This barrier is maintained by various short-lived differentiated cells, which are constantly replenished by Lgr5+ stem cells situated in the crypt base:Citation23,Citation24 Secretory goblet cells produce mucus, which is important for the maintenance of the antimicrobial barrier.Citation25 In addition, enterocytes control the microbiota in various ways: they produce antimicrobial proteins and their metabolism is important for maintaining homeostasis between the epithelium and the microbiota.Citation18,Citation26 Colonocytes rely on short-chain fatty acids produced by the anaerobic flora and their metabolism via beta-oxidation. This in turn creates an anaerobic milieu in the colon, which is essential for the maintenance of anaerobic bacteria.Citation27 In the context of injury and inflammation, this symbiotic cross-talk is disrupted and oxygen levels in the lumen increase, leading to a loss of anaerobes and a selective advantage for facultative anaerobes, such as E. coli. In congruence with this, we found overgrowth of E. coli following DSS-induced damage.
Several clinically relevant enteropathogens are facultative anaerobes, e.g. Salmonella, Citrobacter and pathogenic E. coli. Interestingly, Salmonella and Citrobacter have evolved to actively induce increased oxygen levels in the colon, which facilitates their expansionCitation28 – suggesting that colibactin carriage may be similarly adaptive to E. coli. Interestingly, Citrobacter causes increased oxygen levels by inducing hyperplasia and an increase in proliferating cells via massively increasing R-spondin levels.Citation29 In congruence, we found that when hyperplasia was genetically induced by overexpression of R-spondin 3, this was accompanied by overgrowth of E. coli and barrier loss. In contrast to enteropathogens, pks+ E. coli do not appear to actively disrupt mucosal homeostasis. Instead, they require a “first hit” that damages the mucosal barrier and enables them to make direct contact with the epithelium. Potentially, such a first hit could be initiated by sporadic factors other than DSS: As well as chemical injuries triggered by transient infections and intoxications, the mucus barrier can also be affected by dietary or pharmacological interventions. A defective mucus barrier can also have genetic causes. For example, a number of known genetic risk factors for ileal Crohn’s disease act by impairing the ability of Paneth cells to secrete the full complement of antimicrobial peptides that help to keep the mucus sterile and prevent bacteria from invading the crypts.Citation30
Similarly, the “second hit” that leads to chronification may be caused by factors other than pks+ E. coli. Indeed, Klebsiella and some other Enterobacteriaceae have been shown to carry pks. They, too, are facultative anaerobes that are likely to thrive close to the regenerative epithelium. In addition, other bacterial toxins from the microbiota may potentially be able to cause similarly severe damage when in direct contact with the epithelial cells. The findings in our knock-in mice also show that elevated R-spondin 3 levels themselves are sufficient to induce a regenerative state, barrier loss, and overgrowth of E. coli. Thus, targeting pathways that promote R-spondin 3 upregulation in chronic injury may represent a strategy to disrupt the vicious circle of injury, regeneration and dysbiosis. Indeed, a recent paper suggests that inhibition of IL-1 signaling may prevent the upregulation of R-spondin in the colon after injury.Citation31
Overall, our results provide an important new perspective for understanding the etiology of ulcerative colitis. They show that the microbiota composition in experimental colitis models can have a direct and profound effect on the outcome. While this is already well appreciated at the species level, we demonstrate that it is not sufficient to consider specific microbiota species, but that the carriage of pathogenicity determinants may be an even more important predictor of experimental outcomes.
Our double-hit model also points to new potential therapeutic targets for ulcerative colitis. All current therapy options target the immune response but usually fail to achieve complete remission. Approaches that target the toxic bacteria themselves may be able to remove the main driver of the disease, while monitoring for pks carriage could help identify susceptible individuals for preventative approaches, including lifestyle and eradication. In addition, dampening R-spondin 3 levels may restore the balance between epithelial proliferation and differentiation signals, allowing full maturation of surface cells and reestablishment of an effective barrier.
Methods
Mouse experiments
All procedures involving animals were approved by institutional and legal authorities (LaGeSo Berlin). All animals were maintained in autoclaved microisolator cages and provided with sterile drinking water and chow ad libitum. Male 6–8 week-old mice were used in this study.
To study how colibactin-producing E. coli affects the colon epithelium, we first obtained SPF E. coli-free mice that were originally colonized by the Charles River altered Schaedler flora (CRASF®). E. coli-free Bl6 mice were provided by Till Strowig. These mice were used to establish in-house colonies of Enterobacteriaceae-free C57BL/6 mice. The absence of E. coli was controlled by plating feces on MacConkey agar plates.
Human material
Human samples from patients with ulcerative colitis or healthy control tissue (from patients who underwent colon surgery for other reasons and where adjacent healthy tissue was available) were kindly provided by the Department of Pathology. The samples were de-identified, and the experiments were approved by the local ethics committee.
E. coli cultivation
M1/5 E. coli, a pks+ E. coli strain, and its isogenic ΔclbR mutant were provided by Ulrich Dobrindt and have been described previously.Citation4 In the mutant strain, the clbR gene of the pks island was deleted, which prevented the synthesis of colibactin. Both strains carry a rpsL K42R mutation conferring streptomycin resistance. E. coli was cultured overnight at 37°C and 180 rpm in liquid LB Medium and diluted 1:33 in infection medium consisting of DMEM (Gibco), 10% FCS (Biochrom) the next day. The bacteria were allowed to grow to an OD600 of 1. Mice were infected with 1 × 10⁹ CFU) via oral gavage. The required volume of bacterial suspension was centrifuged, and the density was adjusted to a concentration of 1 × 10⁹ bacteria per 100 µl of the infection medium.
Murine Infection
Enterobacteriaceae-free C57BL/6 mice were treated for 48 h with 2 mg/ml streptomycin in drinking water. Streptomycin was replaced with drinking water 24 h before infection. The mice were infected as described above. At 5 days post-infection, mice were treated with 2.5% DSS (MP Biomedical, 36000–50,000 MW, CAS number 9011-18-1) dissolved in autoclaved tap water, sterilized, and provided as drinking water for 7 days. Before DSS treatment, E. coli colonization was tested by plating diluted fecal samples on MacConkey agar plates. After DSS treatment, the mice were either sacrificed or changed to normal drinking water and allowed to recover.
R-spondin overexpression in mice
Mice overexpressing R-spondin 3 have been previously described by Hilkens et al.Citation32 These Rosa26Sor 6(CAG – Rspo3) animals were bred with Myh11-CreEr miceCitation33 to generate double-heterozygous Myh11-CreEr/Rosa26Sor 6(CAG – Rspo3) mice. To induce R-spondin 3 overexpression, tamoxifen (Sigma) was injected intraperitoneally at a single dose (4 mg/25 g body weight, diluted in 200 μl corn oil) at the indicated time points before sacrifice.
Tissue processing
For paraffin embedding, the colon pieces were flushed with PBS and fixed in 2% PFA for 1 d. Paraffin embedding, sectioning, and H&E staining were performed by the Charité Core Unit Immunopathology for Experimental Models. To visualize the microbiota using FISH, feces-filled colon pieces were fixed in methanol-Carnoy fixative (60% (v/v) methanol, 30% (v/v) chloroform, and 10% (v/v) glacial acetic acid) for up to 3 weeks.
FISH
To visualize the microbiota, fixed tissue was processed according to a previously published protocolCitation34 For dehydration, tissue was washed twice in 100% methanol for 3 min, then twice in 100% ethanol for 20 min, followed by two 15-minute washes in 100% xylene before embedding in paraffin and sectioning. Tissue sections were rehydrated for 10 minutes by incubation in 100% xylene at 60°C, followed by 5 min in 100% ethanol. Slides were allowed to dry and overlaid with EUB388-Cy3 probe (Biomers, 1 µg/µl) in hybridization solution (20 mM Tris – HCl, pH 7.4, 0.9 M NaCl, 0.1% (w/v) SDS). A cover slide was used to prevent drying and slides were incubated at 50°C overnight in a humidified chamber. Slides were washed in PBS 3× for 5 min and blocked for 30 min before the primary antibody. Mouse anti-Muc2 serum (kindly provided by Gunnar Hansson) was added and incubated overnight. After an additional washing step, secondary antibody (anti-rabbit Alexa 488, anti-mouse Alexa 647) staining was performed for 2 h. The slides were washed 3 times in PBS and mounted.
Immunofluorescence
Paraffin-embedded sections were rehydrated and subjected to antigen retrieval and blocking, followed by incubation with primary antibodies against Ki67, E-cadherin, or γH2AX (for details, see Supplementary Table S1) overnight, followed by a washing step with PBS-Triton and incubation with secondary antibody for 1 h. For γH2AX, the secondary antibody was incubated overnight. After washing with PBS-Triton, the samples were mounted to prevent fading. Samples were imaged using a Leica Sp8 confocal microscope.
Single-molecule RNA ISH hybridization
Sections of human colon tissue were processed for RNA in situ detection of R-spondin 3 using an RNAscope Red Detection Kit, according to the manufacturer’s instructions (Advanced Cell Diagnostics, Hayward, CA, USA). Positive and negative control probes were used for each experiment according to the manufacturer’s instructions. The probes used in this study are listed in Supplementary Table S3.
Quantitative RT-PCR
RNA was extracted from snap-frozen colon tissue using the RNAeasy RNA Purification Kit (Qiagen) and on-column DNase digestion. qPCR was performed using a Power SYBR Green RNA-to-CT 1-Step Kit (Applied Biosystems), according to the manufacturer’s instructions. Reactions were performed in 25 μl containing 50 ng RNA, 12.5 μl SYBR Green mix, 0.16 μl RT mix, and 0.2 μM primer (for sequences see Supplementary Table S4). Program: 30 min at 48°C, 10 min at 95°C, followed by 40 cycles of 15 s at 95°C/60 s at 60°C. For each oligonucleotide pair and RNA sample, the reaction was performed in triplicate. The amplification plots obtained from RT-PCR were analyzed using the StepOne ¢ Real-Time PCR Software v2.2. The expression levels of the target genes were normalized to those of glyceraldehyde-3-phosphate dehydrogenase in each sample.
Microarray analysis
For analysis of mice infected with WT M1/5 or ΔclbR E. coli, RNA from the colon was isolated using the RNeasy Mini Kit (Qiagen), as described above. Microarray experiments were performed as independent dual-color dye-reversal color-swap hybridizations using two biological replicates per group for the infected mice. Quality control and quantification of total RNA were carried out using an Agilent 2100 Bioanalyzer (Agilent Technologies) and a NanoDrop 1000 UV – Vis spectrophotometer (Kisker). RNA labeling was performed using a dual-color Quick-Amp Labeling Kit (Agilent Technologies). Briefly, mRNA was reverse transcribed and amplified using an oligo-dT-T7 promoter primer, and the resulting cRNA was labeled with cyanine 3-CTP or cyanine 5-CTP. After precipitation, purification, and quantification, 1.25 μg of each labeled cRNA was fragmented and hybridized to whole-genome mouse 4 × 44 K multipack microarrays (Agilent -014,868, whole mouse genome 4 × 44 K microarray kit) according to the manufacturer’s protocol (Agilent Technologies). Microarray scanning was performed at 5 μm resolution using a G2565CA high-resolution laser microarray scanner (Agilent Technologies) with an extended dynamic range (XDR). Microarray image data were analyzed with image analysis/feature extraction software (G2567AA version A.11.5.1.1, Agilent Technologies) using default settings and the GE2_1105_Oct12 extraction protocol. Raw data was background-corrected and normalized using R package limma.Citation35 Microarray data have been deposited in the Gene Expression Omnibus (GEO; https://www.ncbi.nlm.nih.gov/geo/) of the National Center for Biotechnology Information under accession numbersGSE205403.
GSEA analysis
We performed GSEA on genes pre-ranked by gene expression-based t-score between colon epithelium isolated from WT E. coli-infected animals and ΔclbR mutant-infected animals using the fgsea R package with 5000 permutations. We used gene sets from MSigDB v7.1 and a gene set of a stem cell signature obtained from Lgr5+ cells in the intestinal crypts. P-values were adjusted for multiple testing using a global FDR according to the method described by Benjamini and Hochberg. The R version 4.1 was used and can be obtained from https://cran.r-project.org/, whereas the fgsea package can be retrieved from https://www.bioconductor.org. The computational code for the GSEA analysis of microarray data in this study can be accessed under https://github.com/Sigal-Lab/Harnack_pks_E.coli_barrier.
Statistics
No statistical methods were used to determine sample size. Mouse experiments were performed with at least n = 3 biological replicates, except for the microarray analysis, in which two biological replicates were used. No mice were excluded from the experiments. All data are presented as the mean ± SD for the various groups. Statistics are based on ‘n’ biological replicates. Student’s t-test was performed to compare two groups. All analyses of statistical significance were calculated and displayed compared to the reference control group unless otherwise stated. GraphPad Prism 7 software was used for data visualization and statistical analysis.
Author’s contribution
CH and MS designed the study; CH performed most of the experiments and analyses; HB performed bioinformatics analysis of the transcriptome data; H-JM performed and analyzed the microarray; LL performed immunofluorescence staining and analysis; TS provided the mice. The MS was written by CH and MS, and all authors provided feedback.
Acknowledgments
We would like to thank Stefanie Müllerke and Janine Wolff for their excellent technical support, Uwe Klemm, Daniela Groine, Manuela Primke, and the members of the animal facility of the MPI for Infection Biology for their support with the management of the mouse colony, and Rike Zietlow for editing the paper. We also thank the members of the Sigal Lab for their constructive feedback.
Disclosure statement
No potential conflict of interest was reported by the author(s).
Data availability statement
Microarray data have been deposited in the gene expression omnibus (GEO; https://www.ncbi.nlm.nih.gov/geo/) of the National Center for Biotechnology Information under accession number GSE205403, reviewer token: sxcrkgounnorlmd.
Additional information
Funding
References
- Nougayrede JP, Homburg S, Taieb F, Boury M, Brzuszkiewicz E, Gottschalk G, Buchrieser C, Hacker J, Dobrindt U, Oswald E. Escherichia coli induces DNA double-strand breaks in eukaryotic cells. Science. 2006;313(5788):848–17. doi:10.1126/science.1127059.
- Arthur JC, Perez-Chanona E, Mühlbauer M, Tomkovich S, Uronis JM, Fan T-J, Campbell BJ, Abujamel T, Dogan B, Rogers AB, et al. Intestinal inflammation targets cancer-inducing activity of the microbiota. Science. 2012;338(6103):120–123. doi:10.1126/science.1224820.
- Cougnoux A, Dalmasso G, Martinez R, Buc E, Delmas J, Gibold L, Sauvanet P, Darcha C, Déchelotte P, Bonnet M, et al. Bacterial genotoxin colibactin promotes colon tumour growth by inducing a senescence-associated secretory phenotype. Gut. 2014;63(12):1932–1942. doi:10.1136/gutjnl-2013-305257.
- Iftekhar A, Berger H, Bouznad N, Heuberger J, Boccellato F, Dobrindt U, Hermeking H, Sigal M, Meyer TF. Genomic aberrations after short-term exposure to colibactin-producing E. coli transform primary colon epithelial cells. Nat Commun. 2021;12(1):1003. doi:10.1038/s41467-021-21162-y.
- Pleguezuelos-Manzano C, Puschhof J, Rosendahl Huber A, van Hoeck A, Wood HM, Nomburg J, Gurjao C, Manders F, Dalmasso G, Stege PB, et al. Mutational signature in colorectal cancer caused by genotoxic pks(+) E. coli. Nature. 2020;580(7802):269–273. doi:10.1038/s41586-020-2080-8.
- Dziubanska-Kusibab PJ, Berger H, Battistini F, Bouwman BAM, Iftekhar A, Katainen R, Cajuso T, Crosetto N, Orozco M, Aaltonen LA, et al. Colibactin DNA-damage signature indicates mutational impact in colorectal cancer. Nat Med. 2020;26(7):1063–1069. doi:10.1038/s41591-020-0908-2.
- Hartl K, Sigal M. Microbe-driven genotoxicity in gastrointestinal carcinogenesis. IJMS. 2020;21(20):7439. doi:10.3390/ijms21207439.
- Lupp C, Robertson ML, Wickham ME, Sekirov I, Champion OL, Gaynor EC, Finlay B. Host-mediated inflammation disrupts the intestinal microbiota and promotes the overgrowth of Enterobacteriaceae. Cell Host & Microbe. 2007;2(3):204. doi:10.1016/j.chom.2007.08.002.
- Morgan XC, Tickle TL, Sokol H, Gevers D, Devaney KL, Ward DV, Reyes JA, Shah SA, LeLeiko N, Snapper SB, et al. Dysfunction of the intestinal microbiome in inflammatory bowel disease and treatment. Genome Biol. 2012;13(9):R79. doi:10.1186/gb-2012-13-9-r79.
- Petersen AM, Halkjaer SI, Gluud LL. Intestinal colonization with phylogenetic group B2 Escherichia coli related to inflammatory bowel disease: a systematic review and meta-analysis. Scand J Gastroenterol. 2015;50(10):1199–1207. doi:10.3109/00365521.2015.1028993.
- Cuevas-Ramos G, Petit CR, Marcq I, Boury M, Oswald E, Nougayrède J-P. Escherichia coli induces DNA damage in vivo and triggers genomic instability in mammalian cells. Proc Natl Acad Sci USA. 2010;107(25):11537–11542. doi:10.1073/pnas.1001261107.
- Stehr M, Greweling MC, Tischer S, Singh M, Blöcker H, Monner DA, Müller W. Charles river altered schaedler flora (CRASF®) remained stable for four years in a mouse colony housed in individually ventilated cages. Lab Anim. 2009;43(4):362–370. doi:10.1258/la.2009.0080075.
- Roy U, Gálvez EJC, Iljazovic A, Lesker TR, Błażejewski AJ, Pils MC, Heise U, Huber S, Flavell RA, Strowig T. Distinct microbial communities trigger colitis development upon intestinal barrier damage via innate or adaptive immune cells. Cell Reports. 2017;21(4):994–1008. doi:10.1016/j.celrep.2017.09.097.
- Thiemann S, Smit N, Roy U, Lesker TR, Gálvez EJC, Helmecke J, Basic M, Bleich A, Goodman AL, Kalinke U, et al. Enhancement of IFNγ production by distinct commensals ameliorates salmonella-induced disease. Cell Host & Microbe. 2017;21(6):682–694 e685. doi:10.1016/j.chom.2017.05.005.
- Chassaing B, Aitken JD, Malleshappa M, Vijay-Kumar M. Dextran sulfate sodium (DSS)-induced colitis in mice. Curr Protoc Immunol. 2014;104(25). doi:10.1002/0471142735.im1525s104. Unit 15.
- Wallenstein A, Rehm N, Brinkmann M, Selle M, Bossuet-Greif N, Sauer D, Bunk B, Spröer C, Wami HT, Homburg S, et al. Erratum for Wallenstein et al., “ClbR is the key transcriptional activator of colibactin gene expression in Escherichia coli”. mSphere. 2020;5(4). doi:10.1128/mSphere.00591-20.
- Haberman Y, Karns R, Dexheimer PJ, Schirmer M, Somekh J, Jurickova I, Braun T, Novak E, Bauman L, Collins MH, et al. Ulcerative colitis mucosal transcriptomes reveal mitochondriopathy and personalized mechanisms underlying disease severity and treatment response. Nat Commun. 2019;10(1). doi:10.1038/s41467-018-07841-3.
- Kaiko GE, Ryu SH, Koues OI, Collins PL, Solnica-Krezel L, Pearce EJ, Pearce EL, Oltz EM, Stappenbeck TS. The colonic crypt protects stem cells from microbiota-derived metabolites. Cell. 2016;165(7):1708–1720. doi:10.1016/j.cell.2016.05.018.
- Harnack C, Berger H, Antanaviciute A, Vidal R, Sauer S, Simmons A, Meyer TF, Sigal M. R-spondin 3 promotes stem cell recovery and epithelial regeneration in the colon. Nat Commun. 2019;10(1):4368. doi:10.1038/s41467-019-12349-5.
- Greicius G, Kabiri Z, Sigmundsson K, Liang C, Bunte R, Singh MK, Virshup DM. PDGFRα + pericryptal stromal cells are the critical source of Wnts and RSPO3 for murine intestinal stem cells in vivo. Proc Natl Acad Sci USA. 2018;115(14):E3173–E3181. doi:10.1073/pnas.1713510115.
- Shivdasani RA, Clevers H, de Sauvage FJ. Tissue regeneration: Reserve or reverse? Science. 2021;371(6531):784–786. doi:10.1126/science.abb6848.
- Swidsinski A, Ladhoff A, Pernthaler A, Swidsinski S, Loening–Baucke V, Ortner M, Weber J, Hoffmann U, Schreiber S, Dietel M, et al. Mucosal flora in inflammatory bowel disease. Gastroenterology. 2002;122(1):44–54. doi:10.1053/gast.2002.30294.
- Barker N, van Es JH, Kuipers J, Kujala P, van den Born M, Cozijnsen M, Haegebarth A, Korving J, Begthel H, Peters PJ, et al. Identification of stem cells in small intestine and colon by marker gene Lgr5. Nature. 2007;449(7165):1003–1007. doi:10.1038/nature06196.
- Iftekhar A, Sigal M. Defence and adaptation mechanisms of the intestinal epithelium upon infection. Int J Med Microbiol. 2021;311(3):151486. doi:10.1016/j.ijmm.2021.151486.
- Johansson ME, Phillipson M, Petersson J, Velcich A, Holm L, Hansson GC. The inner of the two Muc2 mucin-dependent mucus layers in colon is devoid of bacteria. Proc Natl Acad Sci USA. 2008;105(39):15064–15069. doi:10.1073/pnas.0803124105.
- Litvak Y, Byndloss MX, Baumler AJ. Colonocyte metabolism shapes the gut microbiota. Science. 2018;362(6418):eaat9076. doi:10.1126/science.aat9076.
- Litvak Y, Baumler AJ. Microbiota-nourishing immunity: a guide to understanding our microbial self. Immunity. 2019;51(2):214–224. doi:10.1016/j.immuni.2019.08.003.
- Lopez CA, Miller BM, Rivera-Chavez F, Velazquez EM, Byndloss MX, Chavez-Arroyo A, Lokken KL, Tsolis RM, Winter SE, Baumler AJ. Virulence factors enhance Citrobacter rodentium expansion through aerobic respiration. Science. 2016;353(6305):1249–1253. doi:10.1126/science.aag3042.
- Papapietro O, Teatero S, Thanabalasuriar A, Yuki KE, Diez E, Zhu L, Kang E, Dhillon S, Muise AM, Durocher Y, et al. R-spondin 2 signalling mediates susceptibility to fatal infectious diarrhoea. Nat Commun. 2013;4(1):1898. doi:10.1038/ncomms2816.
- Wehkamp J, Fellermann K, Herrlinger KR, Bevins CL, Stange EF. Mechanisms of disease: defensins in gastrointestinal diseases. Nat Rev Gastroenterol Hepatol. 2005;2(9):406–415. doi:10.1038/ncpgasthep0265.
- Cox CB, Storm EE, Kapoor VN, Chavarria-Smith J, Lin DL, Wang L, Li Y, Kljavin N, Ota N, Bainbridge TW, et al. IL-1R1–dependent signaling coordinates epithelial regeneration in response to intestinal damage. Sci Immunol. 2021;6(59). doi:10.1126/sciimmunol.abe8856.
- Hilkens J, Timmer NC, Boer M, Ikink GJ, Schewe M, Sacchetti A, Koppens MAJ, Song J-Y, Bakker ERM. RSPO3 expands intestinal stem cell and niche compartments and drives tumorigenesis. Gut. 2017;66(6):1095–1105. doi:10.1136/gutjnl-2016-311606.
- Herring BP, Hoggatt AM, Burlak C, Offermanns S. Previously differentiated medial vascular smooth muscle cells contribute to neointima formation following vascular injury. Vasc Cell. 2014;6(1):21. doi:10.1186/2045-824X-6-21.
- Earle KA, Billings G, Sigal M, Lichtman J, Hansson G, Elias J, Amieva M, Huang K, Sonnenburg J. Quantitative imaging of gut microbiota spatial organization. Cell Host & Microbe. 2015;18(4):478–488. doi:10.1016/j.chom.2015.09.002.
- Ritchie ME, Phipson B, Wu D, Hu Y, Law CW, Shi W, Smyth GK. Limma powers differential expression analyses for RNA-sequencing and microarray studies. Nucleic Acids Research. 2015;43(7):e47. doi:10.1093/nar/gkv007.