
ABSTRACT
Gut microbiota–diet interaction has been identified as a key factor of metabolic associated fatty liver disease (MAFLD). Recent studies suggested that dietary polyphenols may protect against MAFLD by regulating gut microbiota; however, the underlying mechanisms remain elusive. We first investigated the effects of cyanidin 3-glucoside and its phenolic metabolites on high-fat diet induced MAFLD in C57BL/6J mice, and protocatechuic acid (PCA) showed a significant positive effect. Next, regulation of PCA on lipid metabolism and gut microbiota were explored by MAFLD mouse model and fecal microbiota transplantation (FMT) experiment. Dietary PCA reduced intraperitoneal and hepatic fat deposition with lower levels of transaminases (AST & ALT) and inflammatory cytokines (IL-1β, IL-2, IL-6, TNF-α & MCP-1), but higher HDL-c/LDL-c ratio. Characterization of gut microbiota indicated that PCA decreased the Firmicutes/Bacteroidetes ratio mainly by reducing the relative abundance of genus Enterococcus, which was positively correlated with the levels of LDL-c, AST, ALT and most of the up-regulated hepatic lipids by lipidomics analysis. FMT experiments showed that Enterococcus faecalis caused hepatic inflammation, fat deposition and insulin resistance with decreased expression of carnitine palmitoyltransferase-1 alpha (CPT1α), which can be reversed by PCA through inhibiting Enterococcus faecalis. Transcriptomics analysis suggested that Enterococcus faecalis caused a significant decrease in the expression of fibroblast growth factor 1 (Fgf1), and PCA recovered the expression of Fgf1 with insulin-like growth factor binding protein 2 (Igfbp2), insulin receptor substrate 1 (Irs1) and insulin receptor substrate 2 (Irs2). These results demonstrated that high proportion of gut Enterococcus faecalis accelerates MAFLD with decreased expression of CPT1α and Fgf1, which can be prevented by dietary supplementation of PCA.
1 Background
Metabolic associated fatty liver disease (MAFLD) is increasingly regarded as the most popular chronic liver disease that developed from excessive hepatic fat accumulation and metabolic syndromes. Recent meta-analysis has revealed that metabolic associated fatty liver disease accounts for 39.22% with high prevalence in Europe, Asia and North America, based on Medline and Embase databases.Citation1 The occurrence and development mechanism of MAFLD are complicated, although primarily based on the correlations between genetic and nutritional factors including lipids metabolism disorder, insulin resistance and intestinal microecological imbalance.Citation2 Interaction between gut microbiota, immune system and the liver involving in the first-hit in metabolic related diseases, and insulin actions was regarded as the key regulator for fat deposition and metabolism,Citation3 thus research of MAFLD based on the theory of gut-liver axis has aroused wide concern,Citation4 whereas negative impact of some traditional beneficial bacteria tends to be overlooked, such as short-chain fatty acids (SCFAs)-producing bacteriaCitation5 or microbiota belonging to Lactobacillales.Citation6 Recent studies have suggested that Enterococcus faecalis (E. faecalis), an opportunistic pathogen belonging to Lactobacillales, has the potential to induce alcoholic liver steatosis via secreting cytolysin,Citation7 and has capability of promotion in MAFLD through metabolizing trimethyllysine into N,N,N-trimethyl-5-aminovaleric acid, which can reduce carnitine synthesis to decrease oxidation of fatty acids.Citation8 Considering that, changes of potential gut microbiota become the prime concern in understanding the pathogenesis and prevention of MAFLD.
Polyphenols offer a potential as a repressor of MAFLD due to their biological functions such as antioxidant,Citation9 anti-inflammatory,Citation10 and anti-bacterialCitation11 in recent years. Our previous study has suggested that cyanidin 3-glucoside (C3G), one of the most common anthocyanins in plant, has the potential to ameliorate inflammation and oxidative stress in MAFLD mice,Citation12 by modulating gut microbiota.Citation13 However, after ingestion, C3G can be rapidly degraded into phenolic acids, which may take the primary responsibility for the biological function,Citation14 and protocatechuic acid (PCA), phloroglucinaldehyde (PGA), vanillic acid (VA), ferulic acid (FA) and their derivatives have been proved as the major phenolic metabolites of C3G in blood circulation.Citation15,Citation16 Based on the antioxidant and anti-inflammatory activities, PCA, PGA, VA and FA are suggested to be the potential bioactive phenolic metabolites of C3G in our recent study.Citation17 Therefore, this study aimed to investigate the protective effects of C3G, PCA, PGA, VA and FA against MAFLD, and challenged to clarify the protective mechanisms of PCA, a typical bioactive metabolite, focusing on regulation of gut microbiota in a high-fat diet-induced mouse model.
2 Methods
2.1 Diets and reagents
Both low-fat diet (LFD, D12450J) and high-fat diet (HFD, D12492) were purchased from Research Diets Inc. (New Brunswick, NJ, USA), and the diet composition was shown in Supplemental Table S1. C3G, PCA, VA, and FA were provided by Shanghai Yuanye Bio-Technology Co., Ltd. (Shanghai, China). PGA was purchased from Sigma-Aldrich (St. Louis, MO, USA). Enterococcus faecalis (ATCC 29,212), whose virulence factors include asa1, hyl, cylA, efa, ebp, ace, esp, gelE, sprE, fsrA, fsrB, fsrC genes, gelatinase, hemolysin and hydrogen peroxide,Citation18 was provided by South China Agricultural University.
2.2 Mouse model and experimental design
The experimental procedures were approved by Hunan Agricultural University Institutional Animal Care and Use Committee (No. 2020034). Mice and sterilized poplar bedding were purchased from Hunan Slake Jingda Laboratory Animal Co., Ltd. (License No. SCXK-Xiang 2016–0002, Changsha, Hunan, China). Mice were housed separately in cages with sterile environment under controlled temperature (23.5°C) and light (12 h light/day), and had free access to food and water. First, 28 C57BL/6J mice (SPF class, male, 6 weeks of age) were randomly allocated into 7 groups (n = 4) after acclimatization for 1 week. Mice were then fed a LFD, a HFD, or a HFD containing 0.4% (w/w) of C3G, PCA, PGA, VA, or FA for 12 weeks, respectively. The dosages of C3G and its phenolic metabolites were based on our previous study.Citation12 Next, 24 C57BL/6J mice (SPF class, male, 4 weeks of age) were randomly divided into 4 groups (n = 6) after acclimatization for 1 week, and then fed a LFD, a HFD, or a HFD containing 0.025% or 0.1% (w/w) of PCA for 12 weeks, respectively.
2.3 Bacteriostatic experiment
E. faecalis was cultured with brain heart infusion (BHI) medium and identified by comparing with sequence of E. faecalis ATCC 29,212 on National Center for Biotechnology Information (NCBI) (Supplemental Figure 2a). The bacteriostatic effect of PCA (0.355 ~ 45.455 mM) was tested by 24 h incubation, optical density (OD) value was detected under 600 nm. The calculation of Transmittance accords to the following formula:
Transmittance (%) = [(OD of Negative control – OD of Blank control) - (OD of Test – OD of Positive control)]/(OD of Negative control – OD of Blank control)
The minimum inhibitory concentration (MIC) depends on all value of Transmittance > 95 (only valid when negative controls were turbid).Citation19,Citation20 After that, “x” was converted to “log10(x)” to achieve fitting curve between Concentration (x, mM) and Transmittance (y, %). And the theoretical MIC was calculated by assignment “y” is “95”.
2.4 Fecal microbiota transplantation
To understand the effect of E. faecalis on the development of fatty liver, fecal microbiota transplantation (FMT) experiment was conducted based on our previous study (Supplemental Figure 2e).Citation21 Briefly, 12 C57BL/6J mice (SPF class, male, 4 weeks of age) were fed a LFD for 8 weeks and used as donor mice of normal gut microbiota. Meanwhile, another 12 C57BL/6J mice (SPF class, male, 4 weeks of age) were accommodated for 3 days, and then had free access to LFD and antibiotic cocktails containing vancomycin (0.5 g/L), neomycin sulfate (1 g/L), metronidazole (1 g/L) and ampicillin (1 g/L) in water for consecutive 3 weeks. Next the mice were randomly divided into two groups (n = 6), and administered with the fecal microbiota of donor mice or E. faecalis, respectively. Mice received fecal microbiota of donor mice was set as control since they had a similar gut microbiota community with the donor mice in our previous study.Citation21 Feces from donor mice were collected sterilely every day and resuspended in PBS at 0.125 g/mL, followed by low-speed centrifugation (800 × g) for 10 min. A volume of 0.15 mL of the supernatant or the third generation of BHI-cultured E. faecalis (1.8 × 10⁹ CFU/mL) was administered to mice by oral gavage once a day for consecutive 7 days, and then fed with LFD for another 11 weeks.
Further transplantation of bacteria was conducted to make complement for the effect of E. faecalis on liver metabolism (Supplemental Figure 2f). Still, LFD was chosen to avoid the influence of HFD on liver metabolism. Thirty-two C57BL/6J mice (SPF class, male, 4 weeks of age) were accommodated for 3 days, and then had free access to antibiotic cocktails as described previously for consecutive 1 week. Next the mice were randomly divided into four groups (n = 8), and administered with a volume of 0.15 mL culture medium only (control group, CTL), PCA (20 mg/mL), E. faecalis (1.8 × 10⁹ CFU/mL) or E. faecalis & PCA dissolved in culture medium, once a day for consecutive 7 days. The concentration of E. faecalis was ensured via the Michaelis standard curve (Supplemental Figure 2d), and the concentration of PCA (20 mg/mL) in fluid is equal to 0.1% in feed (around 100 mg/Kg BW).
2.5 Histomorphological analysis of fat and liver tissue
Intraperitoneal fat and liver tissue samples were fixed in 4% paraformaldehyde or fat fixative (G1119, Servicebio Technology Co., Ltd. Wuhan, Hubei, China), respectively for at least 24 h until slice production. First, 4 μm serial sections prepared by a microtome (G-P1, Servicebio, Wuhan, China) were stained with hematoxylin and eosin (H&E) after paraffin embedded by using an automated tissue processor (G-L5/P5, Servicebio, Wuhan, China). Second, liver was dehydrated in 15% sucrose solutions and then sectioned into 8–10 μm by cryostat for staining with oil red. The histological profiles were scanned by using Pannoramic MIDI (3DHISTECH Ltd., Budapest, Hungary) and further analyzed by CaseViewer (Version 2.0, 3DHISTECH Ltd., Budapest, Hungary). Hepatic histopathological scores were evaluated based on the nonalcoholic fatty liver disease (NAFLD) activity score (NAS) according to previous study.Citation22 The score ranging from 0 to 8 is defined as the unweighted sum of the scores for steatosis (0–3), lobular inflammation (0–3) and ballooning (0–2).
2.6 Analysis of biochemical indicators and cytokines in serum and liver
Blood sera were obtained by centrifuging at 1500 × g for 10 min after coagulation at room temperature for 30 min. Levels of aspartate transaminase (AST), alanine transaminase (ALT), total cholesterol (TC), triglyceride (TG), high density lipoprotein cholesterol (HDL-c) and low density lipoprotein cholesterol (LDL-c) in serum were detected in terms of manufacturers’ instructions with a MINDRAY BS-200 chemistry analyzer (MINDRAY Medical International Co., Shenzhen, China). The level of glucose in serum was measured with a glucose assay kit (Nanjing Jiancheng Bioengineering Research Institute Co., Ltd., Nanjing, Jiangsu, China), and the level of insulin in serum was detected by a Mouse INS ELISA Kit (E-EL-M1382c, Elabscience Biotechnology Co., Ltd., Wuhan, Hubei, China). Insulin resistance was reflected by HOMA-IR (homeostasis model assessment-estimated insulin resistance) according to the following formula:
HOMA-IR = fasting insulinemia (mIU/L) ×fasting glycemia (mg/dL)/405
The level of carnitine palmitoyltransferase-1 alpha (CPT1α) in serum was detected by Mouse CPT1α ELISA kit (Shanghai MLBIO Biotechnology Co. Ltd, Shanghai, China). Levels of inflammatory cytokines in serum including interleukin (IL)-1β, IL-2, IL-6, tumor necrosis factor-α (TNF-α) and monocyte chemoattractant protein-1 (MCP-1) were measured with respective ELISA kits (Thermo Fisher Scientific Inc., Rockford, IL, USA), or by flow cytometry (BD Accuri C6, San Jose, CA, USA) with a BD™ CBA Mouse Inflammation Kit (ID552364, BD Biosciences, San Jose, USA) according to the manufacturer’s manual.
Liver homogenate (0.1 g/mL) were obtained by being homogenized in phosphate solution (Shanghai MLBIO Biotechnology Co. Ltd, Shanghai, China) with a homogenizer (Shanghai Jingxin Industrial Development Co., Ltd, Shanghai, China), and the supernatant were obtained by being centrifugated at 1500 × g for 10 min at 4°C. Protein concentration was determined by using BCA protein assay kit (Beyotime Biotech Inc, Shanghai, China) according to the manufacturer’s manual. Concentration of malondialdehyde (MDA), TG and non-esterified free fatty acids (NEFA) were tested by corresponding assay kits (Nanjing Jiancheng Bioengineering Research Institute Co., Ltd., Nanjing, Jiangsu, China). Endotoxin and carnitine in liver were tested by respective ELISA kits (Shanghai MLBIO Biotechnology Co. Ltd, Shanghai, China).
2.7 Characterization of gut microbiota
Feces were collected at the first day (Feces0W) and final day (Feces12W) of experiment, and cecal contents (Cecal contents12W) were collected after sacrifice. Total DNA was extracted by using a Stool DNA Isolation Kit (Tiangen Biotech Co., Ltd., Beijing, China). DNA quality was detected and controlled by Nanodrop (Thermo Fisher Scientific Inc., Rockford, IL, USA), and then 30 ng DNA was used for PCR amplification. The V4 hypervariable region of the bacterial 16S rRNA gene was amplified by PCR, where the forward primer was 515a: 5’–GTGCCAGCMGCCGCGGTAA-3’ and the reverse primer was 806: 5’-GGACTACHVGGGTWTCTAAT-3’. For each cecal sample, a 10-digit barcode sequence was added to the 5’ end of the forward and reverse primers (provided by Allwegene Technology Inc., Beijing, China), and each sample was carried out by three same replications to mitigate reaction-level PCR biases. The volume of PCR reaction was 25 µL, containing 12.5 µL of 2×Taq PCR MasterMix, 1 µL of forward and 1 µL of reverse primers at the concentration of 5 µM respectively, 3 µL BSA at the concentration of 2 ng/µL, 3 µL DNA samples (30 ng), and 4.5 µL double-distilled H2O (ddH2O). Cycling parameters were 95°C for 5 min, followed by 25 cycles at 95°C for 45 s, 50°C for 50 s, and 72°C for 45 s, and a final extension at 72°C for 10 min. Detection parameters of agarose gel electrophoresis were referred as follows: concentration of gel with 1%, voltage with 170 V and electrophoretic time with 30 min. Three PCR products from the same sample were mixed in equidensity ratios and purified with a GeneJET Gel Extraction Kit (Thermo Fisher Scientific Inc., Rockford, IL, USA), quantified using real-time PCR, and sequenced at Allwegene Technology Inc. (Beijing, China).
2.8 Lipidomics
Liver samples (50 mg) was homogenized with 1 mL lysis buffer including methanol, methyl tert-butyl ether (MTBE) and internal standard mixture (MTBE: methanol = 3:1) for 2 min. The homogenate was then mixed with 500 μL of pure water for 1 min before centrifuging at 10,000 g for 10 min at 4°C. The supernatant was concentrated and redissolved in 100 μL mobile phase B solution. The sample extracts were analyzed by using a LC-ESI-MS/MS system (UPLC, Shim-pack UFLC SHIMADZU CBM30A system; MS, QTRAP® 4500 System). The analytical condition was as follows, column, Thermo C30 (2.6 μm, 2.1 mm × 100 mm); solvent A, acetonitrile/water (60:40 v/v), 0.04% acetic acid, 5 mmol/L ammonium formate; solvent B, acetonitrile/isopropanol (10:90 v/v), 0.04% acetic acid, 5 mmol/L ammonium formate; gradient program, A/B (80/20 at 0 min, 50/50 at 3 min, 35/65 at 5 min, 25/75 at 9 min, 10/90 at 15.5 min); flow rate, 0.35 mL/min; temperature, 45°C; injection volume, 2 μL. The effluent was alternatively connected to an ESI-triple quadrupole-linear ion trap (QTRAP)-MS.
2.9 Transcriptomics
Liver RNA was extracted using the TRIzol method (TIANGEN BIOTECH, Beijing) and treated with RNase-free DNase I (TaKaRa). RNA degradation and contamination was monitored on 1% agarose gels. RNA was quantified using Agilent 2100 Bioanalyzer (Agilent Technologies, CA, USA), the quality and integrity were assessed by NanoDrop spectrophotometer (IMPLEN, CA, USA). A total amount of 1.5 μg RNA per sample was used as input material for the RNA sample preparations. Sequencing libraries were generated using NEBNext® Ultra™ RNA Library Prep Kit for Illumina® (NEB, USA) following manufacturer’s recommendations and index codes were added to attribute sequences to each sample. Briefly, mRNA was purified from total RNA using poly-T oligo-attached magnetic beads. Fragmentation was carried out using divalent cations under elevated temperature in NEBNext First Strand Synthesis Reaction Buffer (5X). First strand cDNA was synthesized using random hexamer primer and M-MuLV Reverse Transcriptase (RNase H). Second strand cDNA synthesis was subsequently performed using DNA Polymerase I and RNase H. Remaining overhangs were converted into blunt ends via exonuclease/polymerase activities. After adenylation of 3’ ends of DNA fragments, NEBNext Adaptor with hairpin loop structure were ligated to prepare for hybridization. In order to select cDNA fragments of preferentially 200–250 bp in length, the library fragments were purified with AMPure XP system (Beckman Coulter, Beverly, USA). Then 3 μL USER Enzyme (NEB, USA) was used with size-selected, adaptor-ligated cDNA at 37°C for 15 min followed by 5 min at 95°C before PCR. Then PCR was performed with Phusion High-Fidelity DNA polymerase, Universal PCR primers and Index (X) Primer. At last, PCR products were purified (AMPure XP system) and library quality was assessed on the Agilent Bioanalyzer 2100 system. The library preparations were sequenced on an Illumina HiSeq 4000 platform by the Beijing Allwegene Technology Company Limited (Beijing, China) and paired-end 150 bp reads were generated.
Differential expression analysis of two conditions/groups was performed using the DESeq R package (1.10.1). DESeq provide statistical routines for determining differential expression in digital gene expression data using a model based on the negative binomial distribution. The resulting P values were adjusted using the Benjamini and Hochberg’s approach for controlling the false discovery rate. Genes with an adjusted P-value <0.05 found by DESeq were assigned as differentially expressed.
2.10 Western blot
Equal amounts of liver tissues were homogenized in RIPA buffer (0.1 g/mL) with a homogenizer, followed by deep splitting in a crusher (COSMO Bio Co. Ltd, Japan) at medium-speed for 12 min with interval of 10 s. The supernatant proteins were obtained by being centrifugated at 13,000 × g for 10 min at 4°C, and the protein concentration was determined by using BCA method. The protein extracts were boiled in SDS sample buffer for 5 min, and equal amounts of proteins (30 μg) were run on specific-concentration range of SDS-PAGE gel before electrophoretically transferred to PVDF membrane (Merck Millipore Ltd, Tullagreen, Carrigtwohill, Co. Cork, IRL). The membrane was then incubated with specific primary antibody and HRP-conjugated secondary antibody, following by detection with ImageQuant LAS 4000 mini.
2.11 Statistical analysis
Results are expressed as means ± SD of at least three technical replicates. Significant differences between groups were determined using one-way analysis of variance (ANOVA) tests, followed by Fisher’s least significant difference (LSD) and Duncan’s Multiple Range test (SPSS21, IBM Corp., Armonk, NY, USA). Correlation of gut microbiota, serum indicators and hepatic metabolites was determined using Pearson’s correlation analysis. Significant differences between two groups were analyzed by two-tailed t-test. A probability of P < 0.05 was considered significant.
3 Results
3.1 C3G, PCA and PGA showed the protective effect against MAFLD in mice
As shown in , HFD increased significantly the final body weight (BW) of mice (P < 0.05 vs LFD group), and dietary supplementation of C3G, PCA or PGA, but not VA or FA, decreased the final BW as compared with HFD group. Histological analysis of liver showed that HFD led to diffuse bullous lipids accumulation around hepatic vein, which was attenuated by supplementation of C3G, PCA or PGA (). Correspondingly, C3G decreased serum ALT level (), while PCA and PGA reduced AST () and ALT levels in HFD-fed mice (P < 0.05). Further analysis on the serum indicators revealed that HFD significantly increased the glucose level () and decreased the ratio of HDL-c to LDL-c (P < 0.05) (), but were recovered by supplementation of C3G, PCA or PGA.
Figure 1. C3G, PCA and PGA showed the protective effect against MAFLD in mice. (a) Growth curves of body weight. (b) Representative sections of liver by hematoxylin – eosin (H&E) staining (original magnification × 100). Levels of (c) ALT, (d) AST, (e) glucose and (f) HDL-c/LDL-c ratio in serum were measured using an automatic biochemical analyzer. Cytokines including (g) IL-1β, (H) IL-2, (I) IL-6, (J) TNF-α and (K) MCP-1 in serum were measured with their respective ELISA kit. Data represent as mean ± SD (n = 4), and bars with different letters differ significantly (P < 0.05). Hepatic histopathological scores were evaluated based on NAFLD Activity Score (NAS). The score ranging from 0 to 8 is defined as the unweighted sum of the scores for steatosis (0–3), lobular inflammation (0–3) and ballooning (0–2). ALT, alanine aminotransferase; AST, aspartate aminotransferase; C3G, cyanidin-3-glucoside; FA, ferulic acid; HDL-c, high density lipoprotein cholesterol; HFD, high-fat diet; IL, interleukin; LDL-c, low density lipoprotein cholesterol; LFD, low-fat diet; MCP-1, monocyte chemoattractant protein-1; PCA, protocatechuic acid; PGA, phloroglucinaldehyde; TNF-α, tumor necrosis factor-α; VA, vanillic acid.
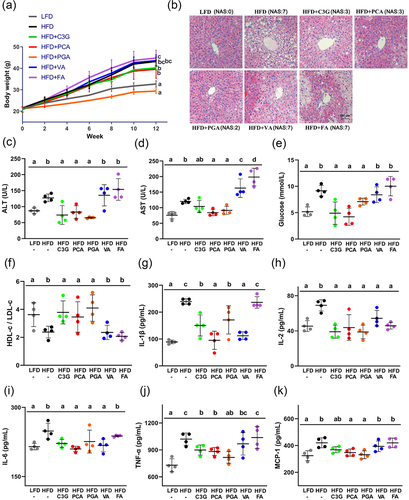
Inflammatory cytokines were then measured in serum to evaluate the inflammation induced by HFD. As shown in , supplementation of C3G, PCA or PGA decreased significantly the overproduction of IL-1β (G), IL-2 (H), IL-6 (I) and TNF-α (J) in HFD-fed mice, while PCA and PGA also decreased the MCP-1 (K) level (P < 0.05). Supplementation of VA reduced serum levels of IL-1β, IL-2 and IL-6, but showed no significant effect on TNF-α and MCP-1, while FA only decreased the level of IL-2.
3.2 PCA showed a dose-dependent effect against MAFLD by attenuating insulin resistance in mice
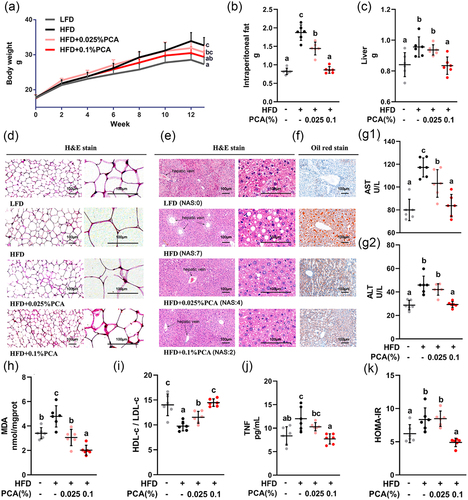
A dose-dependent experiment was further conducted to understand the protective effect of PCA on MAFLD, As shown in , dietary supplementation of 0.025% or 0.1% PCA decreased the final BW (A) of HFD-fed mice in a dose-dependent manner, which was consistent with the intraperitoneal fat (B) and liver weight (C). Particularly, PCA reduced the adipocyte size (D) in intraperitoneal fat deposition (B), and ameliorated diffuse bullous lipids accumulation in liver (E & F). As the marker of liver damage, PCA dose-dependently decreased serum levels of AST (G1) and ALT (G2), which were in accord with the level of MDA (H), a product of lipid peroxidation. Moreover, PCA recovered the HDL-c/LDL-c ratio (I) and decreased the production of TNF (J), which were consistent with the HOMA-IR (K), an index of insulin resistance. Lipidomics analysis of liver also showed that PCA significantly down-regulated the lipid metabolites in the pathways associated with insulin resistance (Supplemental Figure S1c).
Figure 2. PCA showed a dose-dependent effect against MAFLD by attenuating insulin resistance in mice. (a) Growth curves of body weight. (b) Intraperitoneal fat weight. (c) Liver weight. (d) Representative sections of intraperitoneal fat by hematoxylin – eosin (H&E) staining with original magnification × 100 (left) and × 400 (right). (e) Representative liver sections by hematoxylin – eosin (H&E) staining with original magnification × 100 (left) and × 400 (right). (f) Representative liver sections by oil red staining (original magnification × 100). (G1) Serum level of AST. (G2) Serum level of ALT. (h) the content of MDA in liver. (i) the HDL-c/LDL-c ratio in serum. (j) Serum level of TNF. (K) HOMA-IR index based on serum levels of glucose and insulin. Data represent as mean ± SD (n = 6). Bars with different letters differ significantly (P < 0.05). Hepatic histopathological scores were evaluated based on NAFLD Activity Score (NAS). The score ranging from 0 to 8 is defined as the unweighted sum of the scores for steatosis (0–3), lobular inflammation (0–3) and ballooning (0–2). ALT, alanine aminotransferase; AST, aspartate aminotransferase; HDL-c, high density lipoprotein cholesterol; HFD, high-fat diet; HOMA-IR, homeostasis model assessment-estimated insulin resistance; LDL-c, low density lipoprotein cholesterol; LFD, low-fat diet; MDA, malondialdehyde; PCA, protocatechuic acid; TNF, tumor necrosis factor.
3.3 PCA alleviated MAFLD by inhibiting enterococcus
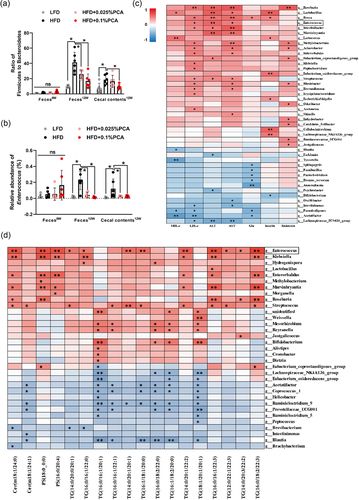
Gut microbiota has been considered as the key factor that affects development of MAFLD. As shown in , HFD increased the ratio of Firmicutes to Bacteroidetes (P < 0.05), which was restored by supplementation of PCA. Further analysis on microbial genera revealed that PCA dose-dependently decreased the relative abundance of Enterococcus (), and the correlation analysis indicated that Enterococcus was positively (P < 0.05) associated with the levels of LDL-c, ALT and AST (). Moreover, Enterococcus had a positive correlation (P < 0.05) with 12 kinds of significant hepatic lipids including Cer (m18:1/24:0), PS (18:0_0:0), PS (16:0/20:4), TG (14:0/20:0/20:1), TG (16:0/16:1/22:0), TG (14:0/20:1/20:1), TG (16:1/18:1/20:0), TG (14:0/20:1/22:2), TG (16:0/16:1/22:3), TG (12:0/22:1/22:3), TG (14:0/20:3/22:2), and TG (16:0/18:2/22:3) ().
Figure 3. PCA alleviated MAFLD by inhibiting Enterococcus. (a) Ratio of Firmicutes to Bacteroidetes. (b) the relative abundance of Enterococcus. (c) Correlation of gut microbiota and serum indicators. (d) Correlation of gut microbiota and hepatic lipid metabolites. Feces were collected at the first day (Feces0W) and final day (Feces12W) of experiment, and cecal contents (Cecal contents12W) were collected after sacrifice. The intensity of the colors represented the degree of association (red, positive correlation; blue, negative correlation). Data represent as mean ± SD (n = 6), and significant correlations were marked by *P < 0.05, **P < 0.01. ALT, alanine aminotransferase; AST, aspartate aminotransferase; Cerm, ceramide; Glu, glucose; HDL-c, high density lipoprotein cholesterol; LDL-c, low density lipoprotein cholesterol; PS, phosphatidylserine; TG, triglyceride.
The bacteriostasis effect of PCA against E. faecalis, a representative strain of Enterococcus widely existed in animals, was then evaluated in vitro, and the results indicated that 2 M PCA had obvious bacteriostatic effect against E. faecalis (Supplemental Figure 2b). MIC experiment showed that 22.727 mM PCA could inhibit the growth of E. faecalis with the transmittance > 95% (Supplemental Figure 2c), and the theoretical MIC of PCA against E. faecalis is 12.457 mM based on the fitting curve (Supplemental Figure 2d).
3.4 Transplantation of E. faecalis accelerated MAFLD in mice
The impact of E. faecalis in the pathogenesis of MAFLD was then investigated by a FMT experiment. Final BW of mice transplanted with E. faecalis (rE. faecalis) was increased by 7.46% (P = 0.072, ), and observed obvious accumulation in intraperitoneal fat (). Transplantation of E. faecalis also increased significantly the liver weight () and induced obvious diffuse bullous lipids accumulation in liver (), leading to raised levels of TNF-α () and IL-1β () in serum (P < 0.05), as compared to the control (rLFD) group. Moreover, E. faecalis decreased the expression of CPT1α in both serum () and liver (), with increased NEFA () and TG () levels, but decreased carnitine () level in liver (P < 0.05).
Figure 4. Effects of E. faecalis and PCA on MAFLD by FMT experiments. The first FMT experiment (A-K) aimed to investigate the effect of E. faecalis on MAFLD in mice (n = 6). (a) Body weight of mice. (b) Representative anatomical drawing. (c) Liver weight of mice. (f) Representative liver sections by hematoxylin – eosin (H&E) staining with original magnification × 100 (left) and × 400 (right). (e) TNF-α, (f) IL-1β, and (g) CPT1α in serum. (h) Representative CPT1α blots in liver. (i) NEFA, (j) TG, and (K) carnitine in 10% liver homogenate. The second FMT experiment (L-W) aimed to know the effect of PCA on E. faecalis associated MAFLD (n = 8). (l) Growth curves of mice body weight. (m) Intraperitoneal fat rate. (n) Liver weight. (o) HOMA-IR index based on serum levels of glucose and insulin. (p) Representative sections of intraperitoneal fat by hematoxylin-eosin (H&E) staining with original magnification × 100 (left) and × 400 (right). (q) Representative liver sections by hematoxylin-eosin (h and e) staining with original magnification × 100 (left) and × 400 (right). (r) Representative liver sections by oil red staining (original magnification × 100). (S) IL-1β and (t) CPT1α in serum. (u) Representative CPT1α blots in liver. (v) NEFA and (W) TG in 10% liver homogenate. Data represent as mean ± SD, and significant correlations were marked by *P < 0.05, **P < 0.01, ***P < 0.001, or bars with different letters differ significantly (P < 0.05). Hepatic histopathological scores were evaluated based on NAFLD Activity Score (NAS). The score ranging from 0 to 8 is defined as the unweighted sum of the scores for steatosis (0–3), lobular inflammation (0–3) and ballooning (0–2). CPT1α, carnitine palmitoyltransferase-1 alpha; E. faecalis, Enterococcus faecalis; FMT, fecal microbiota transplantation; HOMA-IR, homeostasis model assessment-estimated insulin resistance; LFD, low-fat diet; NEFA, non-esterified free fatty acids; PCA, protocatechuic acid; rE. faecalis, recipient mice of E. faecalis; rLFD, recipient mice of LFD; TG, triglyceride.
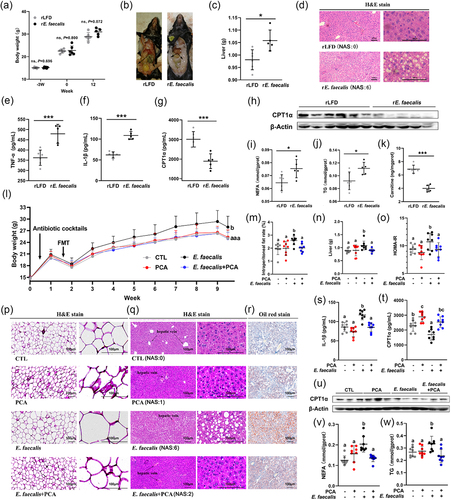
Further, FMT experiment was designed to clarify if PCA could protect against E. faecalis-mediated MAFLD. Transplantation of E. faecalis increased the BW (), intraperitoneal fat rate () and liver weight () of mice, accompanied with increased HOMA-IR index (), hypertrophic adipocyte in intraperitoneal fat (), diffuse bullous lipids accumulation in liver () and IL-1β level in serum (). Correspondingly, E. faecalis reduced the level of CPT1α both in serum () and liver (), with increased levels of NEFA () and TG () in liver, but reversed in E. faecalis+PCA group(P < 0.05).
3.5 PCA ameliorated insulin resistance induced by E. faecalis in MAFLD mice
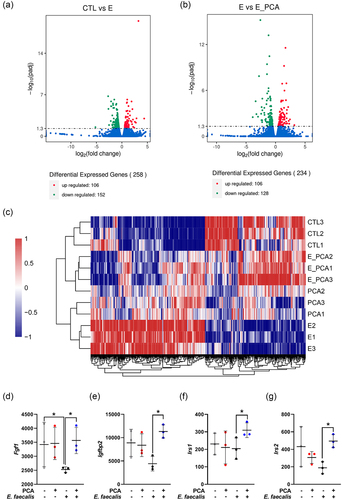
Transcriptomics indicated that E. faecalis caused significant changes in gene expression (), which could be reversed by PCA (). Further analysis on specific genes related to insulin actions revealed that E. faecalis induced a significant decrease in the expression of fibroblast growth factor 1 (Fgf1), and PCA recovered the Fgf1 expression (). Additionally, PCA recovered the expression of insulin-like growth factor binding protein 2 (Igfbp2) (), insulin receptor substrate 1 (Irs1) (), and insulin receptor substrate 2 (Irs2) ().
Figure 5. PCA ameliorated insulin resistance induced by E. faecalis in MAFLD mice. (a) Differential genes expressed between CTL and E. faecalis group. (b) Differential genes expressed between E. faecalis group and E. faecalis + PCA group. (c) Heatmap involving in CTL, PCA group, E. faecalis group and E. faecalis + PCA group. (d) Expression of Fgf1. (E) Expression of Igfbp2. (f) Expression of Irs1. (g) Expression of Irs2. Data represent as mean ± SD (n = 3), and significant correlations were marked by *P < 0.05. CTL, control group; E, E. faecalis group; E_PCA, E. faecalis + PCA group; Fgf1, fibroblast growth factor 1; Igfbp2, insulin-like growth factor binding protein 2; Irs1, insulin receptor substrate 1; Irs2, insulin receptor substrate 2; PCA, protocatechuic acid.
4. Discussion
Excessive energy intakeCitation23 and energy imbalanceCitation24 are considered as the primary factor causing overweight and obesity. Insulin resistance and abnormal lipids metabolism play an important role in the onset of MAFLD, typically characterized as high serum triglyceride, high LDL-c and low HDL-c levels.Citation25 As the first-hit to induce MAFLD, insulin resistance influenced by diets results in decrease of sugar utilization for tissues, together with the decreased sensitivity to insulin, which conversely aggravates the utilization of lipids for cells and a large amount of insulin accumulated as hyperinsulinemia.Citation26 Lipid accumulation in the liver is the main cause of cytotoxicity to hepatocytes, which induces hepatocyte injury and secondary inflammation/fibrosis during the disease.Citation27 In this study, HFD caused lipid metabolism disorder and insulin resistance as reflected by the lower HDL-c/LDL-c ratio and HOMA-IR index, accompanied by hepatic lipid accumulation and inflammation. Dietary supplementation of C3G and phenolic metabolites PCA or PGA showed protective effect against MAFLD, and PCA dose-dependently ameliorated hepatic steatohepatitis and inflammation by attenuating insulin resistance, as reflected by lower levels of AST, ALT, MDA, TNF and HOMA-IR index. As PGA is rarely found in natural resources, it was paid less attention in further studies. Additionally, VA and FA showed no significant effect on HFD-induced hepatic steatosis in mice, but VA decreased serum levels of inflammatory cytokines including IL-1β, IL-2 and IL-6, while FA decreased the level of IL-2. Our recent study also revealed that dietary VA can improve the growth performance by modulating gut microbiota in lipopolysaccharide (LPS)-challenged weaned piglets.Citation28 The crosstalk between these metabolites and intestinal microorganisms was worthy of further study.Citation17
Maintaining homeostasis in the mammalian intestine is important to prevent aberrant inflammation and metabolic disorders,Citation29 and increased Firmicutes/Bacteroidetes ratio was reported to be closely correlated with obesity.Citation30 Correspondingly, the Firmicutes/Bacteroidetes ratio was increased by HFD but reversed by PCA. Further analysis on the microbial genera revealed that PCA decreased the relative abundance of Enterococcus that belonging to Firmicutes, and the correlation analysis revealed that Enterococcus had a positive correlation with serum indicators of hepatic damage (AST & ALT). Recently, Enterococcus was considered as one of the major causative agents of infection in HFD-induced MAFLD.Citation31 As an opportunistic pathogen, E. faecalis has been showing drugs resistance and virulence genes, such as metalloprotease gelatinase E,Citation32 during the long process of biological evolution,Citation33,Citation34 leading to periapical periodontitis,Citation35 encephalitisCitation36 and intestinal inflammation.Citation32 E. faecalis was recently reported to induce liver steatosis and liver injury by secreting cytolysin,Citation7 and over-growth of E. faecalis exacerbated ethanol-induced liver disease in mice, while increase in Enterococcus promoted liver inflammation via pathogen-recognition receptor TLR2.Citation37 Moreover, E. faecalis could metabolize trimethyllysine into N,N,N-trimethyl-5-aminovaleric acid, which resulted in binding with and inhibition of γ-butyrobetaine hydroxylase, a rate limiting enzyme of carnitine synthesis from γ-butyrobetaine,Citation38 so that reducing levels of carnitine palmitoyltransferase-1 (CPT1), an essential rate-limiting enzyme located in mitochondrial outer membrane,Citation39 and causing decrease in β-oxidation of fatty acids.Citation8 In this study, transplantation of E. faecalis reduced carnitine level, and led to less expression of CPT1α, the mainest enzymatic subunit of CPT1, resulted in decrease of β-oxidation of NEFA, with negative feedback regulation on splitting decomposition process of TG to NEFA. High-fat Western-type diet was previously reported to induce a bloom in the abundance of EnterococcusCitation40,Citation41 or E. faecalis.Citation42 Other studies also indicated that eutrophic circumstance,Citation43 or antibiotic-induced early susceptible environment,Citation44 may benefit the growth of E. faecalis. Our results proved that HFD could increase the relative abundance of Enterococcus, and transplantation of E. faecalis significantly accelerated fatty liver, insulin resistance and IL-1β production, while PCA inhibited the growth of E. faecalis with reduced production of inflammatory cytokines and lipid peroxidation to attenuate hepatic steatosis. These results suggested that E. faecalis is an important factor in accelerating MAFLD, and PCA could ameliorate MAFLD at least partly by down-modulation of E. faecalis. However, whether E. faecalis was the only species of genus Enterococcus in accelerating MAFLD kept unknown, and the lethal mechanism of PCA on E. faecalis kept unknown, although PCA was reported to enhance the generation of reactive oxygen species and inhibit electron transport chain to cause bacterial cell death.Citation45 In addition, LFD was selected as the basal diet in FMT experiments in this study, and further research on the effect of PCA in HFD-fed germ-free mice would help to understand the direct effect of PCA on HFD-induced fatty liver.
The metabolism of hepatic neutral lipid, mainly TG, is critical in the development of MAFLD.Citation46 In this study, lipidomics analysis revealed that HFD significantly up-regulated lipid metabolites belong to triradylglycerols (data are not shown), which can explain the lipid accumulation in liver. Meanwhile, most of the lipid metabolites down-regulated by PCA belong to triradylglycerols (Supplemental Table S2), and involved in insulin resistance-related pathways by KEGG analysis, while other down-regulated lipids such as glycerophosphoserines (PS) and ceramides (Cer) were also proved to induce insulin resistanceCitation47 and promote the development of MAFLD.Citation48 Transplantation of E. faecalis induced insulin resistance as reflected by down-regulation of genes such as Fgf1 that can ameliorate inflammation and insulin resistance.Citation49 Lipidomics data suggested that PCA might attenuate MAFLD by improving insulin sensitivity, and transcriptomics data revealed that PCA could enhance insulin sensitivity via promoting the expression of Fgf1, Igfbp2, Irs1 and Irs2.
5. Conclusions
Dietary supplementation of PCA, a bioactive phenolic metabolite of polyphenol C3G, attenuated insulin resistance with reduced hepatic lipids accumulation, inflammation and liver damage in HFD- induced MAFLD model. Microbial sequencing and lipidomics analysis indicated that Enterococcus had a significant correlation with the changed lipid metabolites, and FMT experiments revealed that E. faecalis can accelerate hepatic steatosis by down-regulating genes related to insulin activity especially CPT1α, which can be reversed by PCA through enhancing the expression of Fgf1, Igfbp2, Irs1 and Irs2.
Authors’ contributions
Experimental execution, J.T., R.H., J.G., C.F., Y.L., M.L., and Z.H.; Writing – original draft preparation, J.T. and S.W.; Writing – review and editing, S.W., D.-X.H., J.H. and H.Z.; supervision, S.W. and J.H.
Ethics approval and consent to participate
The experimental procedures were approved by the Hunan Agricultural University Institutional Animal Care and Use Committee (No. 2020034).
Supplemental Material
Download MS Word (6.7 MB)Acknowledgments
We thank Prof. Jian Sun of South China Agricultural University for providing the E. faecalis (ATCC 29212).
Disclosure statement
No potential conflict of interest was reported by the author(s).
Data availability statement
The datasets presented in this study can be found in online repositories. The names of the repository/repositories and accession number(s) can be found below:
Sequencing of microbiota (Accession number: PRJNA764448): https://dataview.ncbi.nlm.nih.gov/object/PRJNA764067?reviewer=tqhu8ektn4cof3nv6u0t1g8a2f.
Nucleotide sequences of E. faecalis in bacteriostasis and FMT experiments: https://submit.ncbi.nlm.nih.gov/subs/?search=SUB10571133.
Supplementary material
Supplemental data for this article can be accessed online at https://doi.org/10.1080/19490976.2023.2238959
Additional information
Funding
References
- Lim GEH, Tang A, Ng CH, Chin YH, Lim WH, Tan DJH, Yong JN, Xiao J, Lee C-M, Chan M, et al. An observational data meta-analysis on the differences in prevalence and risk factors between MAFLD vs NAFLD. Clin Gastroenterol Hepatol. 2021;21(3):619–629.e7. doi:10.1016/j.cgh.2021.11.038.
- Buzzetti E, Pinzani M, Tsochatzis EA. The multiple-hit pathogenesis of non-alcoholic fatty liver disease (NAFLD). Metabolism. 2016;65(8):1038–16. doi:10.1016/j.metabol.2015.12.012.
- Wu S, Tan J, Zhang H, Hou D, He J. Tissue-specific mechanisms of fat metabolism that focus on insulin actions. J Adv Res. 2022. doi:10.1016/j.jare.2022.12.009.
- Kobayashi T, Iwaki M, Nakajima A, Nogami A, Yoneda M. Current research on the pathogenesis of NAFLD/NASH and the gut–liver axis: gut microbiota, dysbiosis, and leaky-gut syndrome. Int J Mol Sci. 2022;23(19):11689. doi:10.3390/ijms231911689.
- Rau M, Rehman A, Dittrich M, Groen AK, Hermanns HM, Seyfried F, Beyersdorf N, Dandekar T, Rosenstiel P, Geier A. Fecal SCFAs and SCFA-producing bacteria in gut microbiome of human NAFLD as a putative link to systemic T-cell activation and advanced disease. United European Gastroenterol J. 2018;6(10):1496–1507. doi:10.1177/2050640618804444.
- Natividad JM, Agus A, Planchais J, Lamas B, Jarry AC, Martin R, Michel ML, Chong-Nguyen C, Roussel R, Straube M, et al. Impaired aryl hydrocarbon receptor ligand production by the gut microbiota is a key factor in metabolic syndrome. Cell Metab. 2018;28(5):737–749 e734. doi:10.1016/j.cmet.2018.07.001.
- Duan Y, Llorente C, Lang S, Brandl K, Chu H, Jiang L, White RC, Clarke TH, Nguyen K, Torralba M, et al. Bacteriophage targeting of gut bacterium attenuates alcoholic liver disease. Nature. 2019;575(7783):505–511. doi:10.1038/s41586-019-1742-x.
- Zhao M, Zhao L, Xiong X, He Y, Huang W, Liu Z, Ji L, Pan B, Guo X, Wang L, et al.: TMAVA, a metabolite of intestinal microbes, is increased in plasma from patients with liver steatosis, inhibits gamma-butyrobetaine hydroxylase, and exacerbates fatty liver in mice. Gastroenterology 2020, 158:2266–2281 e2227.
- Wu S, Yano S, Chen J, Hisanaga A, Sakao K, He X, He J, Hou DX. Polyphenols from Lonicera caerulea L. Berry Inhibit LPS-induced inflammation through dual modulation of inflammatory and antioxidant mediators. J Agric Food Chem. 2017;65(25):5133–5141. doi:10.1021/acs.jafc.7b01599.
- Wu S, He X, Wu X, Qin S, He J, Zhang S, Hou D-X. Inhibitory effects of blue honeysuckle (Lonicera caerulea L) on adjuvant-induced arthritis in rats: Crosstalk of anti-inflammatory and antioxidant effects. J Funct Foods. 2015;17:514–523. doi:10.1016/j.jff.2015.06.007.
- Xu C, Yagiz Y, Hsu WY, Simonne A, Lu J, Marshall MR. Antioxidant, antibacterial, and antibiofilm properties of polyphenols from muscadine grape (Vitis rotundifolia Michx.) pomace against selected foodborne pathogens. J Agric Food Chem. 2014;62(28):6640–6649. doi:10.1021/jf501073q.
- Wu S, Yano S, Hisanaga A, He X, He J, Sakao K, Hou DX. Polyphenols from Lonicera caerulea L. berry attenuate experimental nonalcoholic steatohepatitis by inhibiting proinflammatory cytokines productions and lipid peroxidation. Mol Nutr Food Res. 2017;61(4):61. doi:10.1002/mnfr.201600858.
- Wu S, Hu R, Nakano H, Chen K, Liu M, He X, Zhang H, He J, Hou DX. Modulation of gut microbiota by Lonicera caerulea l. berry polyphenols in a mouse model of fatty liver induced by high fat diet. Molecules. 2018;23(12):23. doi:10.3390/molecules23123213.
- Czank C, Cassidy A, Zhang Q, Morrison DJ, Preston T, Kroon PA, Botting NP, Kay CD. Human metabolism and elimination of the anthocyanin, cyanidin-3-glucoside: a (13)C-tracer study. Am J Clin Nutr. 2013;97(5):995–1003. doi:10.3945/ajcn.112.049247.
- de Ferrars RM, Czank C, Zhang Q, Botting NP, Kroon PA, Cassidy A, Kay CD, de Ferrars RM. The pharmacokinetics of anthocyanins and their metabolites in humans. Br J Pharmacol. 2014;171(13):3268–3282. doi:10.1111/bph.12676.
- Amin HP, Czank C, Raheem S, Zhang Q, Botting NP, Cassidy A, Kay CD. Anthocyanins and their physiologically relevant metabolites alter the expression of IL-6 and VCAM-1 in CD40L and oxidized LDL challenged vascular endothelial cells. Mol Nutr Food Res. 2015;59(6):1095–1106. doi:10.1002/mnfr.201400803.
- Tan J, Li Y, Hou DX, Wu S. The effects and mechanisms of cyanidin-3-glucoside and its phenolic metabolites in maintaining intestinal integrity. Antioxid (Basel). 2019;8. doi:10.3390/antiox8100479.
- Gok SM, Dagi HT, Kara F, Arslan U, Findik D. Klinik Örneklerden İzole Edilen Enterococcus faecium ve Enterococcus faecalis İzolatlarının Antibiyotik Direnci ve Virülans Faktörlerinin Araştırılması. Mikrobiyol Bul. 2020;54(1):26–39. doi:10.5578/mb.68810.
- Igawa G, Casey M, Sawabe E, Nukui Y, Okugawa S, Moriya K, Koike R, Tohda S, Saito R. Comparison of agar dilution and broth microdilution methods for Clostridium difficile antimicrobial susceptibility testing. J Glob Antimicrob Resist. 2016;7:43–45. doi:10.1016/j.jgar.2016.07.007.
- Kaiser SJ, Mutters NT, Blessing B, Gunther F. Natural isothiocyanates express antimicrobial activity against developing and mature biofilms of Pseudomonas aeruginosa. Fitoterapia. 2017;119:57–63. doi:10.1016/j.fitote.2017.04.006.
- Tan J, Gong J, Liu F, Li B, Li Z, You J, He J, Wu S. Evaluation of an antibiotic cocktail for fecal microbiota transplantation in mouse. Front Nutr. 2022;9. doi:10.3389/fnut.2022.918098.
- Kleiner DE, Brunt EM, Van NM, Behling C, Contos MJ, Cummings OW, Ferrell LD, Liu YC, Torbenson MS, Unalp-Arida A, et al. Design and validation of a histological scoring system for nonalcoholic fatty liver disease. Hepatology. 2005;41(6):1313–1321. doi:10.1002/hep.20701.
- Ruiz E, Avila JM, Valero T, Del Pozo S, Rodriguez P, Aranceta-Bartrina J, Gil A, Gonzalez-Gross M, Ortega RM, Serra-Majem L, et al. Energy intake, profile, and dietary sources in the Spanish population: findings of the ANIBES study. Nutrients. 2017;7:4739–4762. doi:10.3390/nu7064739.
- Hill JO, Wyatt HR, Peters JC. Energy balance and obesity. Circulation. 2012;126(1):126–132. doi:10.1161/CIRCULATIONAHA.111.087213.
- Zhao Q, Liu F, Wang YH, Lai HM, Zhao Q, Luo JY, Ma YT, Li XM, Yang YN. LDL-C: HDL-C ratio and common carotid plaque in Xinjiang Uygur obese adults: a cross-sectional study. BMJ Open. 2018;8:e022757. doi:10.1136/bmjopen-2018-022757.
- Matias AM, Estevam WM, Coelho PM, Haese D, Kobi J, Lima-Leopoldo AP, Leopoldo AS. Differential effects of high sugar, high lard or a combination of both on nutritional, hormonal and cardiovascular metabolic profiles of rodents. Nutrients. 2018;10(8):10. doi:10.3390/nu10081071.
- Malhi H, Gores GJ. Molecular mechanisms of lipotoxicity in nonalcoholic fatty liver disease. Semin Liver Dis. 2008;28(4):360–369. doi:10.1055/s-0028-1091980.
- Hu R, Wu S, Li B, Tan J, Yan J, Wang Y, Tang Z, Liu M, Fu C, Zhang H, et al. Dietary ferulic acid and vanillic acid on inflammation, gut barrier function and growth performance in lipopolysaccharide-challenged piglets. Animal Nutr. 2022;8:144–152. doi:10.1016/j.aninu.2021.06.009.
- Foley SE, Dente MJ, Lei XQ, Sallis BF, Loew EB, Meza-Segura M, Fitzgerald KA, McCormick BA. Microbial metabolites orchestrate a distinct multi-tiered regulatory network in the intestinal epithelium that directs P-glycoprotein expression. Mbio. 2022;13(4):e01993–22. doi:10.1128/mbio.01993-22.
- Bishara J, Farah R, Mograbi J, Khalaila W, Abu-Elheja O, Mahamid M, Nseir W. Obesity as a risk factor for Clostridium difficile infection. Clin Infect Dis. 2013;57(4):489–493. doi:10.1093/cid/cit280.
- Garcia-Solache M, Rice LB. The enterococcus: a model of adaptability to its environment. Clin Microbiol Rev. 2019;32(2):32. doi:10.1128/CMR.00058-18.
- Steck N, Hoffmann M, Sava IG, Kim SC, Hahne H, Tonkonogy SL, Mair K, Krueger D, Pruteanu M, Shanahan F, et al. Enterococcus faecalis metalloprotease compromises epithelial barrier and contributes to intestinal inflammation. Gastroenterology. 2011;141(3):959–971. doi:10.1053/j.gastro.2011.05.035.
- Wiegerinck M, Hyoju SK, Mao J, Zaborin A, Adriaansens C, Salzman E, Hyman NH, Zaborina O, van Goor H, Alverdy JC. Novel de novo synthesized phosphate carrier compound ABA-PEG20k-Pi20 suppresses collagenase production in Enterococcus faecalis and prevents colonic anastomotic leak in an experimental model. Br J Surg. 2018;105(10):1368–1376. doi:10.1002/bjs.10859.
- La Rosa SL, Casey PG, Hill C, Diep DB, Nes IF, Brede DA. In vivo assessment of growth and virulence gene expression during commensal and pathogenic lifestyles of luxABCDE-tagged Enterococcus faecalis strains in murine gastrointestinal and intravenous infection models. Appl Environ Microbiol. 2013;79(13):3986–3997. doi:10.1128/AEM.00831-13.
- Yin W, Liu S, Dong M, Liu Q, Shi C, Bai H, Wang Q, Yang X, Niu W, Wang L. A new NLRP3 inflammasome inhibitor, dioscin, promotes osteogenesis. Small. 2020;16(1):e1905977. doi:10.1002/smll.201905977.
- Chai Y, Gu X, Wu Q, Guo B, Qi Y, Wang X, Zhou X, Li J, Han M, Zhong F. Genome sequence analysis reveals potential for virulence genes and multi-drug resistance in an Enterococcus faecalis 2A (XJ05) strain that causes lamb encephalitis. BMC Vet Res. 2019;15(1):235. doi:10.1186/s12917-019-1936-3.
- Llorente C, Jepsen P, Inamine T, Wang L, Bluemel S, Wang HJ, Loomba R, Bajaj JS, Schubert ML, Sikaroodi M, et al. Gastric acid suppression promotes alcoholic liver disease by inducing overgrowth of intestinal Enterococcus. Nat Commun. 2017;8(1):837. doi:10.1038/s41467-017-00796-x.
- Rydzik AM, Chowdhury R, Kochan GT, Williams ST, McDonough MA, Kawamura A, Schofield CJ. Modulating carnitine levels by targeting its biosynthesis – selective inhibition of γ-butyrobetaine hydroxylase. Chem Sci. 2014;5(5):1765–1771. doi:10.1039/C4SC00020J.
- Adeva-Andany MM, Carneiro-Freire N, Seco-Filgueira M, Fernandez-Fernandez C, Mourino-Bayolo D. Mitochondrial beta-oxidation of saturated fatty acids in humans. Mitochondrion. 2019;46:73–90. doi:10.1016/j.mito.2018.02.009.
- Hyoju SK, Adriaansens C, Wienholts K, Sharma A, Keskey R, Arnold W, van Dalen D, Gottel N, Hyman N, Zaborin A, et al. Low-fat/high-fibre diet prehabilitation improves anastomotic healing via the microbiome: an experimental model. Br J Surg. 2020;107(6):743–755. doi:10.1002/bjs.11388.
- Qiao Y, Sun J, Ding Y, Le G, Shi Y. Alterations of the gut microbiota in high-fat diet mice is strongly linked to oxidative stress. Appl Microbiol Biotechnol. 2013;97(4):1689–1697. doi:10.1007/s00253-012-4323-6.
- Qiao Y, Sun J, Xia S, Tang X, Shi Y, Le G. Effects of resveratrol on gut microbiota and fat storage in a mouse model with high-fat-induced obesity. Food Funct. 2014;5(6):1241–1249. doi:10.1039/c3fo60630a.
- Ali L, Wang YQ, Zhang J, Ajmal M, Xiao Z, Wu J, Chen JL, Yu D. Nutrient-induced antibiotic resistance in Enterococcus faecalis in the eutrophic environment. J Glob Antimicrob Resist. 2016;7:78–83. doi:10.1016/j.jgar.2016.07.014.
- Lu Y, Cai X, Zheng Y, Lyv Q, Wu J. Dominant bacteria and influencing factors of early intestinal colonization in very low birth weight infants: A prospective cohort study. J Clin Lab Anal. 2022;36(3):e24290. doi:10.1002/jcla.24290.
- Fatimah ZH, Kabiru S, Ramat SH, Taofeek OA, Judith NU, Oluwayemisi BI, Najeeb OA, Hikmat OA, Sharafa AB, Hamdalat FM, et al. Involvement of oxidative stress in protocatechuic acid-mediated bacterial lethality. Microbiologyopen. 2017;6(4):e00472. doi:10.1002/mbo3.472.
- Musso G, Gambino R, Cassader M. Recent insights into hepatic lipid metabolism in non-alcoholic fatty liver disease (NAFLD). Prog Lipid Res. 2009;48(1):1–26. doi:10.1016/j.plipres.2008.08.001.
- Chavez JA, Summers SA. A ceramide-centric view of insulin resistance. Cell Metab. 2012;15(5):585–594. doi:10.1016/j.cmet.2012.04.002.
- Pagadala M, Kasumov T, McCullough AJ, Zein NN, Kirwan JP. Role of ceramides in nonalcoholic fatty liver disease. Trends Endocrinol Metab. 2012;23(8):365–371. doi:10.1016/j.tem.2012.04.005.
- Zhao L, Fan M, Zhao L, Yun H, Yang Y, Wang C, Qin D. Fibroblast growth factor 1 ameliorates adipose tissue inflammation and systemic insulin resistance via enhancing adipocyte mTORC2/Rictor signal. J Cell Mol Med. 2020;24(21):12813–12825. doi:10.1111/jcmm.15872.