
 ?Mathematical formulae have been encoded as MathML and are displayed in this HTML version using MathJax in order to improve their display. Uncheck the box to turn MathJax off. This feature requires Javascript. Click on a formula to zoom.
ABSTRACT
Climate change poses several risks to the value of financial assets and financial stability. The study conducted in this paper focuses on the German banking sector and estimates its exposure to climate risks arising from a transition to a carbon-neutral economy. Our analysis identifies the energy, transportation, and manufacturing sectors as the most sensitive to transition risks. It shows that the German banking sector's direct exposure to climate transition risks is non-negligible. Moreover, it indicates that an amplified exposure to transition risks characterizes large private banks. These findings are comparable to other countries exposures and relevant to financial supervision and regulation, calling for increased engagement to assess, measure, and manage climate-related financial risks.
Highlights
The exposure of the German banking sector to climate-related transition risks is non-negligible.
The energy, transportation, and manufacturing sectors are sensitive to transition risks and represent the main drivers of the materialization of credit risks with potentially relevant financial stability implications.
Large private banks face an amplified exposure to transition risks.
Promoting climate-related financial policies and climate mitigation and adaptation policies are crucial to an orderly and timely transition to a net-zero carbon economy at the country level.
1. Introduction
The risks derived from increased greenhouse gas (GHG) emissions and global temperatures are widely studied (IPCC Citation2014, Citation2018, Citation2021). The international community agrees on the relevance of addressing climate risks because they can lead to economic damages and financial losses (see Eckstein et al. Citation2019; Batten, Sowerbutts, and Tanaka Citation2020; Reaños Citation2021, among others). However, countries have yet to embark on deep decarbonization pathways to implement the goals agreed on in the Paris Agreement (Tagliapietra et al. Citation2019; Roelfsema et al. Citation2020; van Soest, den Elzen, and van Vuuren Citation2021; IPCC Citation2023).
Germany is usually considered – together with the UK and Denmark – a climate ‘leader’. However, climate mitigation ambitions do not always correspond to substantial instruments and actions that lead to long-term emissions reductions (Michaelowa Citation2013; Vogt-Schilb and Hallegatte Citation2017; Lamb and Minx Citation2020). With France, Italy, and the UK, Germany has significantly reduced its GHG emissions from 1990 and is following the European Union (EU) climate change mitigation policies (Zheng et al. Citation2019). Across the EU Member States, the emissions were the highest in Germany in 2014–2016 (21% of the EU-28 total or 936 mil. tonnes of CO2eq.), followed by the United Kingdom and France (Zheng et al. Citation2019). For 2050, the EU set the target to reduce economy-wide GHG emissions by 80–95% (with 1990 as the reference year); more recently, as part of the European Green Deal, the Commission revised this goal and proposed on 4 March 2020, the first European Climate Law to enshrine a 2050 climate-neutrality target into law (European Parliament Citation2021). In this revised framework, EU Member States must develop long-term national strategies on how they plan to achieve the GHG emissions reductions needed to meet their commitments under the Paris Agreement and EU objectives. A recent version of the German ‘Klimaschutzgesetz’, or Climate Change Act, adopted in June 2021, requires reducing CO2-emissions by 65% by 2030 (with 1990 as the reference year) and achieving climate neutrality by 2045 (Bundesregierung Citation2021). The revised Climate Change Act also sets an annual path of aggregate emissions through 2040 and revised annual sectoral targets through 2030. However, the emissions targets are far from being met and are still insufficient to limit global warming below the 1.5 threshold (Keles and Yilmaz Citation2020; D'Orazio and Löwenstein Citation2022).
Recent studies suggest that while challenging, limiting global warming and achieving the Paris Agreement targets is feasible with carbon emission reduction reforms. A significant reduction in global CO2 emissions is necessary to align with the Paris Agreement, surpassing current trends and policies. Several studies indicate that global net CO2 emissions must reach zero or become negative before 2050 to achieve the Paris Agreement targets (see, e.g. IPCC Citation2023).
In particular, implementing the low-carbon transition will require targeted climate policies (such as carbon taxes), regulation changes, environmental innovation, and consumer preferences (Semieniuk et al. Citation2021). Different tools are available to policymakers to implement their mitigation strategies (see Krogstrup and Oman Citation2019; Polzin and Sanders Citation2020, for a review) and governments are at the forefront of this endeavor (Boyle et al. Citation2021).
However, introducing climate policies to reduce CO2 emissions could result in transition risks for high-emitting firms. Implementing policies to curb emissions and transition to a greener economy could create substantial risks for the most carbon-intensive industries. For instance, industries that heavily rely on non-renewable or highly polluting resources, like mining or fossil fuel extraction, may encounter a significant decline in profits and higher production costs.
Due to the interrelations between climate change, economic processes, and the financial sector (D'Orazio Citation2023b), central banks, financial supervisors, and regulators have started considering climate-related risks in their policymaking (NGFS Citation2020b; OMFIF Citation2020). Although their action cannot substitute for an adequate climate policy (Lane Citation2019; Weidmann Citation2020), it is now widely acknowledged that they cannot stand on the sidelines because of the effects climate change will have on their ability to achieve their monetary policy (Batten, Sowerbutts, and Tanaka Citation2016; Campiglio et al. Citation2018; Coeuré Citation2018; Battiston and Monasterolo Citation2019; Kemfert, Schäfer, and Semmler Citation2020) and financial stability mandates (Elderson Citation2018; D'Orazio and Popoyan Citation2019; Bressan, Monasterolo, and Battiston Citation2021; D'Orazio and Popoyan Citation2022, Citation2023). Against this backdrop, it is now widely agreed that financial regulators and supervisors should consider both climate-related physical and transition risks (Carney Citation2015), although special attention should be devoted to risks deriving from a transition to a low-carbon economy which might play a larger role in the short-term. Since they represent a material risk to the banking system and may even be a source of systemic risk, it is crucial to understand the degree of concentration in climate risk exposures (Monasterolo Citation2020).
The lack of research on assessing financial sector's exposure to climate risks is a cause for concern, particularly at the country or EU level. While few studies assess the climate risk exposure of the financial sector at the country or EU level (see, e.g. Vermeulen et al. Citation2019; Battiston et al. Citation2020; Faiella and Lavecchia Citation2020; Roncoroni et al. Citation2021; Ritter Citation2022), the German case has been hardly studied yet (see Daumas Citation2023, for a comprehensive review). Therefore, this study sets out to fill this research gap by examining the carbon intensity of financial assets in Germany's banking sector, thus quantifying transition risks and estimating the banking sector's vulnerability to the transition to a low-carbon economy. The study utilizes a comprehensive dataset that includes sectoral and aggregate bank data and GHG emissions data for empirical analysis. The results indicate that the German banking sector is significantly exposed to climate transition risks, which cannot be ignored.
The study's contribution to the existing literature is noteworthy in various ways. Firstly, depending on the method of estimation, the exposure is quantified as 19.4% (Carbon Critical Sectors), 32.56% (Loan Carbon Intensity), and 25.17% (Climate Policy Relevant Sectors) of the total loan volume. Secondly, the study highlights that larger banks are more vulnerable to amplified risks, which highlights the need to urgently understand the implications of climate transition risks for the financial sector. The findings reveal that insufficient consideration of resulting risks from the low-carbon transition can harm the financial sector in Germany. Thirdly, the exposure calculations presented in this study could be used by policymakers to identify climate-related risks' allocation in the banking sector, enabling an adequate prudential response. Based on our calculations further research can evaluate how different sources of transition risks, such as stricter climate policies, changes in investors and consumer preferences, and structural changes, might impact the financial sector. Finally, by conducting climate-related stress tests, policymakers could use the results to assess vulnerability beyond exposures.
The remainder of the paper is organized as follows. Section 2 offers a literature review focusing on the methods developed in the past decades to study the financial sector's exposure to climate risks. The methodology and data used in the proposed analysis are described in Section 3. Section 4 shows and discusses the results of our study. The implications of the direct exposures of German banks to transition risks are then examined in detail in Section 5 by considering the peculiarities of the financial sector and the current national political debate on its resilience to climate change. Finally, Section 6 offers concluding remarks.
2. Climate-related financial risks and the stability of the financial system
In a seminal contribution, Carney (Citation2015) brought attention to the exposure of banks and the banking system to climate change through different risk drivers. On the one hand, the rising frequency and severity of extreme weather events can result in the manifestation of physical risks, leading to economic costs and financial losses from stranded assets or harm to human capital (Botzen, Deschenes, and Sanders Citation2019; Battiston, Mandel, and Monasterolo Citation2021; Caldecott et al. Citation2021). On the other hand, changes in government fiscal and climate policies, technological advancements, or shifts in investor and consumer sentiment and preferences can trigger the materialization of transition risks, resulting in amplified costs and losses for financial institutions.
Financial institutions could face detrimental effects from both transition and physical risks. They may directly face losses from defaulted loans or asset holdings to affected firms. Indirect exposures could arise from households and firms linked to supply chains or affected by a more widespread economic downturn caused by lower demand and higher unemployment. Furthermore, as climate change progresses, the likelihood of sudden value losses in climate risk-sensitive areas may increase, leading to collateral and asset value erosion for many financial institutions. Insurance liabilities, in particular, are at risk from more frequent and severe climate and weather-related events that damage property or disrupt trade (Semieniuk et al. Citation2021).
The availability of geolocational data has limited the development of empirical studies to assess the financial sector's exposure to physical risks. Consequently, a commonly agreed-upon methodology for evaluating such exposure is currently lacking (BCBS Citation2021a; Ranger, Mahul, and Monasterolo Citation2022; D'Orazio Citation2023). When assessing transition risk, standard methods involve mapping the drivers of such risks to determine counterparty and portfolio exposures and assess credit risk (Breitenstein, Nguyen, and Walther Citation2021). These exposures can be analyzed at the portfolio, sectoral, or geographic level, depending on the research objectives and data availability. The resulting findings can be leveraged by supervisors for microprudential supervision and inform the development of macroprudential policies (D'Orazio Citation2023b). Existing literature has focused on capturing the carbon intensity of portfolio-specific and sectoral exposures, providing internal climate risk ratings or scores, or estimating the effects of more stringent climate regulation (see Krogstrup and Oman Citation2019; BCBS Citation2021a; Daumas Citation2023, for a review of methods), or considering how to improve conventional risk management tools (see for a discussion Svartzman et al. Citation2020; D'Orazio Citation2021). A seminal contribution to assessing transition risks has been provided by developing a taxonomy of the Climate Policy Relevant Sectors (CPRS) (Battiston et al. Citation2017). Drawing on this approach, other methods such as scenario analysis (Schulten et al. Citation2021), stress testing (Batten, Sowerbutts, and Tanaka Citation2016; Monasterolo Citation2020), climate value-at-risk (Dietz et al. Citation2016), and sensitivity analysis (BCBS Citation2021a) have been proposed.
It is widely acknowledged that climate-related financial risks can be understood through traditional risk categories: credit, liquidity, market, operational, and reputational risk (NGFS Citation2019a; Bolton et al. Citation2020; BCBS Citation2021b). The existing literature focuses on the impacts of climate risk drivers on credit risk, and credit risk quantification efforts are mainly aimed at addressing risks to corporate lending and real estate exposures (see, e.g. Delis, De Greiff, and Ongena Citation2018; Westcott et al. Citation2019; Battiston, Mandel, and Monasterolo Citation2020). This strand of literature has been growing in the past years, thanks to the development of methodologies to explicitly study the channels of transmission (see BCBS Citation2021a, for a review). In particular, academic research has been primarily devoted to advancing instruments to include climate risks in conventional risk management tools adequately (see, e.g. BoE-PRA Citation2019). This requires the set-up of granular and forward-looking measurement methodologies, knowledge of physical or transition risk drivers, and risk management decisions, depending on the availability of relevant data and computational complexity (Krogstrup and Oman Citation2019; Monasterolo Citation2020; Breitenstein, Nguyen, and Walther Citation2021; Chenet, Ryan-Collins, and van Lerven Citation2021). Nevertheless, studies on the diffusion and adoption of climate-related financial policies show that existing prudential frameworks in Europe and internationally still need to implement adequate risk identification and risk management procedures (D'Orazio Citation2022, Citation2023b). Thus, assessing climate-related financial risks is still in its infancy, with no consensus yet on preferred modeling and empirical approaches (Daumas Citation2023).
Despite the need for more credit data at a sufficiently granular level and the absence of a standard methodology, a growing literature studies the exposure of financial systems at the national level. An overview of existing studies is presented in , and a detailed discussion is provided in the following. The review of existing literature shows that the exposure of the German financial system to transition risks still needs to be examined. Our study aims to fill this gap by quantifying such exposure. As detailed in Section 3, we utilize the approaches developed in Battiston et al. (Citation2017) and Faiella and Lavecchia (Citation2020) because they enable us to identify the direct exposure of German banks to climate-vulnerable assets.
Table 1. Overview of studies estimating the exposure of the financial system to climate-related transition risks.
Weyzig et al. (Citation2014) and BoE-PRA (Citation2015) provided a seminal contribution to the study of the impact of transition risks on the financial sector. Weyzig et al. (Citation2014) studied the exposures to firms owning oil, gas, and coal assets of EU pension funds, banks, and insurance companies as of December 2012. They find that the total estimated exposures are roughly €260–330 billion for EU pension funds, €460–480 billion for banks, and €300–400 billion for insurance companies. According to the authors' calculations, the estimated exposures - expressed as an average proportion of total assets -- are approximately 5% of total assets for pension funds, 4% for insurance companies, and 1.4% for banks.
BoE-PRA (Citation2015) studies the impact of both physical and transition risks on the UK insurance sector. It highlights that transition risk has potential relevance to the liability and asset side of an insurance firm's balance sheet, particularly investment portfolios of life insurance firms, given the longer-term tenure of their assets.
Battiston et al. (Citation2017) proposed a methodology to identify the so-called Climate Policy Relevant Sectors (CPRS). The CPRS derive from the re-mapping of the existing classification of economic activities (i.e.NACE Rev. 2) and take into account to what extent economic activities are affected by a disorderly transition to a low-carbon economy by identifying their (in)direct contribution to GHG emissions, their relevance for climate policy implementation and their role in the energy value chain.Footnote1 The classification was developed to determine climate financial risk exposures by calculating climate scenarios or financial risk metrics like the Value-at-Risk. Based on this, the authors find that direct and indirect exposures to CPRS represent a large portion of investors' equity portfolios, especially for investment and pension funds. In particular, the top 50 listed European banks are characterized by large exposures to CPRS.
Schotten et al. (Citation2016) and DNB (Citation2017) have provided an early contribution to the study of the impact of transition risks in the Netherlands, finding that the exposures of financial institutions to energy transition risks could be sizable. More recently, by relying on a granular approach that assigns transition risks to 56 individual NACE industries, Vermeulen et al. (Citation2019) compute vulnerability measures on the CO2-emissions used to generate value-added of a particular industry. They estimate that 13% of the financial assets held by banks at the end of 2017 were directly exposed to carbon-intensive activities. For insurance companies, 5% of assets were exposures to industries with carbon-intensive production processes, most of which were exposures to carbon-intensive activities other than mining and petrochemical. For pension funds, the exposure has been reported to be at 8%.
Faiella and Lavecchia (Citation2020) focus on the Italian financial sector and develop a methodology to estimate its exposure to transition risks. By linking the information on GHG emissions with the distribution of loans, they compute the ‘loan carbon intensity’ and find that approx. 10% of the banks' financial assets at the end of 2018 were directly exposed to carbon-intensive activities. They also adopt the CPRS method and find that the exposure would be 12.9% in that case. Further, they develop an alternative methodology to identify the so-called ‘carbon-critical sectors’ aiming to sort the economic sectors with the highest share of loans and emissions. By adopting this approach, the total exposure of the financial sector amounts to 14.4%.
The study developed in Bellrose, Norman, and Royters (Citation2021) takes a complementary approach to the Australian Prudential Regulation Authority's (APRA's) Climate Vulnerability Assessment (CVA) and incorporates both the direct and indirect channels to provide a more accurate estimate of Australian banks' exposure to the transition risks of climate change. The study highlights that around 20 percent of banks' business loans are to industries with (scope 1) carbon emissions per dollar of output in the top quartile of all industries by emissions. Based on this approach, the banks' current loan portfolios are estimated to be less emissions-intensive than the economy as a whole.
Roncoroni et al. (Citation2021) study the Mexican banking sector by applying the CPRS methodology. Because of the peculiarities of the Mexican economy related to the presence of state-owned large energy firms and the role of informal economy, they find low asset values and distribution patterns across the CPRS.
Similarly, Ritter (Citation2022) adopts the CPRS method to study the exposure of Hungarian banks to climate risks, finding that Hungarian institutions may be exposed to the negative effects of climate change at a higher rate than their counterparts in the European Union.
3. Methodology
3.1. Data
It is crucial to have reliable data on financial firms' exposure to nonfinancial companies to estimate climate-related transition risks adequately. To this aim, we retrieve loan data for the period 2008–2018 from the Deutsche Bundesbank's Quarterly Borrowers Statistic (QBS).Footnote2 The QBS provides information on the granular exposure of German banks to all domestic enterprises and households classified by borrowers, economic sectors (following the WZ 2008 classification, based on NACE Rev. 2), and maturitiesFootnote3.
Transition risk exposures can be computed at the economic sector and aggregate levels by combining loan data with GHG emissions data retrieved from Eurostat. Regarding GHG emissions data, we consider the direct industry-specific GHG emissions (Scope 1 and Scope 2 emissions following the Greenhouse Gas Protocol) between 2008 and 2018 from the Air Emissions Accounts (AEAs) and industry affiliations based on the NACE Rev. 2 classificationFootnote4 The advantage of the AEA's methodology is its applicability to other scales, such as linking the emission data with the National Accounts data on the sectoral level. We can thus use the National Account's gross value-added (GVA) and the GHG emissions data provided by Eurostat to compute industry-specific carbon intensityFootnote5. Data sources and descriptions are provided in .
Table 2. Data description and sources.
Moreover, we implement separate subsample analyzes considering the size group (based on the year-end value of the bank's total assets, see ) and the bank group (see ) of the reporting institutions by relying on Selected Master Data for MFIs (MaMFI)Footnote6 to identify the bank group and the Monthly Balance Sheet Statistics (BISTA) to assess the size group of each institute.Footnote7 An overview of the economic sectors and the bank and size groups included in the analysis are displayed in and .
Table 3. NACE Rev. 2 sectors and divisions linked to loan sectors of the QBS.
Table 4. Number of financial institutes by size (SZ) and bank group (BGRS) at the end of 2018.
To ensure that each subsample consists of at least five individual institutes, we scale the size groups following the classification applied in the ‘Bankenstatistik’Footnote8 (Deutsche Bundesbank Citation2021a). Accordingly, an analysis of transition risk exposure (and potential stability implications) at the level of individual institutes cannot be performed.
3.2. Empirical approach
The analysis proposed in the paper relies on the Climate Policy Relevant Sectors approach developed by Battiston et al. (Citation2017) and the “Loan carbon intensity” (LCI) and ‘Carbon-critical Sectors’ (CCrS) proposed by Faiella and Lavecchia (Citation2020).
The methodology developed by Battiston et al. (Citation2017) takes into account to what extent economic activities are affected by a disorderly transition to a low-carbon economy based on their (in)direct contribution to GHG emissions, their relevance for climate policy implementation, and their role in the energy value chain. Considering the CPRS methodology, we classify economic activities (based on the NACE Rev.2 classification) to be substantially exposed towards transition risks if they are assigned to one of the following five climate policy relevant main sectors: fossil fuels, utilities, energy-intensive, buildings, and transportation.
Faiella and Lavecchia (Citation2020) distinguish between the LCI and the CCrS approaches. The LCI is computed by mapping the GHG emissions of each economic sector s for each time t, defined as , to the distribution of loans of each economic sector s for each time t, denoted as
, so that
(1)
(1) However, the authors explain that the LCI approach described in Equation (Equation1
(1)
(1) ) could yield biased results. Consider, for instance, the case in which a sector is characterized by high emissions and a high volume of loans; the result, in this case, will be a low LCI. Nevertheless, from a financial stability perspective, despite a low LCI score, a sector with these characteristics should be considered highly relevant for assessing transition risks because of both high emissions and high loan exposure. To overcome the possible bias deriving from the LCI measure, Faiella and Lavecchia (Citation2020) propose the implementation of the CCrS approach that consists in a function
that takes two rank variables that provide information on sectors' share of total emissions, namely
) and loan concentration, namely
, thus obtaining a measure of the relevance of each sector in terms of emissions and exposure in each year t, as shown in Equation (Equation2
(2)
(2) ). According to this approach, the carbon critical sectors are those whose simple average mean of both emissions and exposure ranks (Rank AVE) belongs to the first quantile
of the distribution.
(2)
(2) By using both total emissions and carbon intensity, this approach allows us to show the sectors with the highest overall transition risk (as proxied by total emissions) and the sectors with the highest discrepancy between current emission levels and their economic importance (as proxied by carbon intensity). In this way, we identify the sectors that will potentially pose the highest threats to financial stability in a low-carbon transition.
4. Analysis
4.1. Sectoral and aggregate GHG emissions in Germany
Germany is responsible for around 20% of all GHG emissions in the EU and around 2% of the world's CO2 emissions with a total of around 700 million tonnes of carbon dioxide equivalentsFootnote9 (CO2e). As shown in , GHG emissions decreased between 2008 and 2018 in both Germany and the EU-28 at a similar rate. However, in contrast to Germany's proclaimed ambition to position itself as a leading force in climate change mitigation, the decrease in GHG emissions does not significantly exceed the EU average (Bundesfinanzministerium Citation2021).
Figure 1. GHG emissions and carbon intensities for Germany and EU-28, 2008 level = 100)
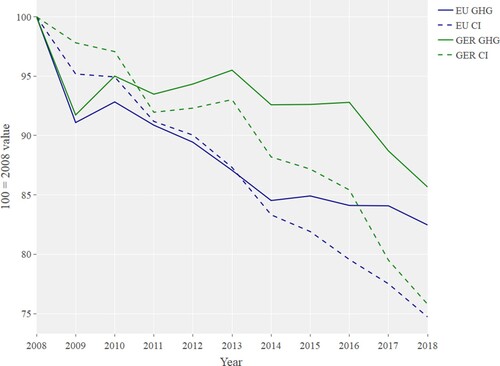
To provide a broader understanding of the evolution of GHG emissions by considering the sectoral composition of the German economy, we compute the carbon intensity, i.e. the ratio of GHG emissions by GVA, as it is a useful indicator for a country or sector's additional amount of CO2e emitted per unit of GVA, expressed in grams of CO2e per €(gCO2e/€). As reported in , while carbon intensity for Germany (the EU-28) drops by about 25% (24%) until 2018, GHG emissions are only decreasing by about 14% (18%) until 2018. Accordingly, the German (EU-28) economy seems to become more emission-efficient, while the overall GHG emissions are not decreasing at the same pace due to steady economic growth. Moreover, to explain the economic sector's contribution to GHG emissions, we calculate the industries-specific share of GHG emissions, their carbon intensity, and their rate of change in the period from 2008 to 2018 for the ten highest emitting sectors; the results are shown in .
Table 5. Emission trends of the 10 highest emitting sectors in Germany in 2018.
GHG emissions in Germany are heavily dominated by the electricity (D) sector, as it accounts for about 40% of total emissions, in line with other European countries (see, e.g. Faiella and Lavecchia Citation2020). The manufacturing (C), transportation (H), and agricultural (A) sectors are also important contributors. Overall, the five most emitting sectors contributed to nearly 68% of total emissions. Besides the manufacture of basic metal (C24) and air transport (H51), each of the highest emitting sectors exhibits decreasing GHG emissions between 2008 and 2018 (see ). The decrease in GHG emissions is steeper for half of the sectors than the German economy's average decrease. While the highest emitting sectors have the greatest potential (or need) to decrease emissions, it could also be interpreted as a sign of ambitious decarbonization efforts from these sectors (Zheng et al. Citation2019).
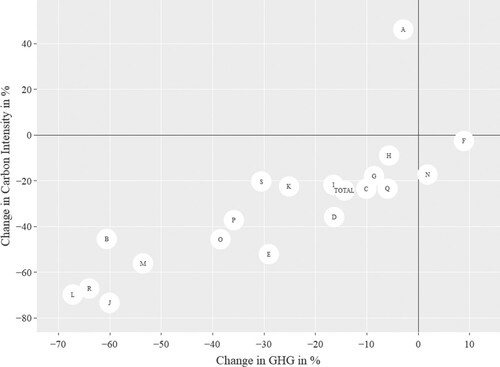
At the aggregate level (NACE Rev. 2 sectors), only the agricultural sector (A) exhibits an increase in carbon intensity, as shown in . With nearly constant GHG emissions, this effect can only be explained by declining economic value-added (i.e. a decrease in GVA), which adds to the assumed decreasing importance of the agricultural sector in modern economies. Both construction (F) and administrative and support service activities (N) show increased GHG emissions between 2008 and 2018 (see ). However, their carbon intensity is stagnant or marginally decreasing, which implies that the increase of their GHG emission does not significantly exceed the increase of their economic importance (as proxied by the GVA).
Figure 2. Development of GHG emissions and carbon intensity (in %, aggregated sectors). Source: Authors elaboration based on Eurostat (Citation2021a) and Eurostat (Citation2021b). Sectors based on the NACE Rev. 2 classification.
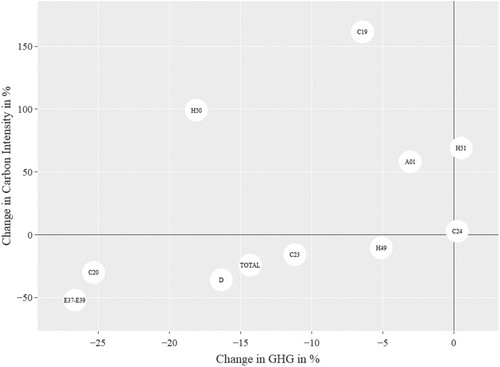
Regarding the carbon intensity at the sub-sector level (NACE Rev. 2 divisions), half of the highest emitting sectors increase between 2008 and 2018. In addition, the rate of increase significantly exceeds the one observed for the aggregate sectors. For instance, the carbon intensity of the Manufacture of coke and refined petroleum product (C19) has more than doubled between 2008 and 2018, while the highest increase in the carbon intensity of the aggregate sectors is 46% (see ). In contrast, the GHG emissions of the ten highest emitting sectors stagnated or decreased between 2008 and 2018. Thus, the increase of carbon intensity for the sectors A01, C19, C24, H50, and H51 can be linked to the decreasing economic importance (i.e. the decreasing GVA).
Figure 3. Development of GHG emissions and carbon intensity (in %, Top 10). Source: Authors elaboration based on Eurostat (Citation2021a, Citation2021b). Sectors based on the NACE Rev. 2 classification.
4.2. Banks' exposure to climate-related transition risk
In this section, we present the results of the implementation of the empirical approaches described in Section 3 to analyze the direct exposure of the German banking sector to transition risks. We start by reporting the carbon intensity of loans and the carbon-critical sectors.Footnote10 Results shown in provide a summary of the LCI for the QBS sectors as of 2018; we also display other core variables such as the loan value (LV), gross value added (GVA), GHG emissions, and their rank for comparison purposes.
Table 6. Loan Carbon Intensity and other core variables computed for the QBS sectors (as of 2018).
When considering the LV, the housing sector displays the highest value with €396.65 bn., i.e. 29.36% of the total LV, followed by the financial sector with 11.39% and the manufacturing sector with 10.61%. As shown in , the LV of the housing sector (181, 183), financial intermediation (170), and the manufacturing sector (130) amount together to more than half of the total LV. Concerning their GHG emissions, these sectors are responsible for around 25%, while the manufacturing sector is responsible for 24.8% alone. The largest emitting sectors like Energy, water, waste (120), Manufacturing (130), and Transportation (160) account for 83.56% of the country's emissions, but only for 23.33% of loans.
Figure 4. Share of loans and LCI (left panel) and Share of loans and GHG emissions (right panel). Source: Research Data and Service Centre (RDSC) Deutsche Bundesbank, dataset: QBS, data period: 01.01.2008–31.12.2018, own elaborations.
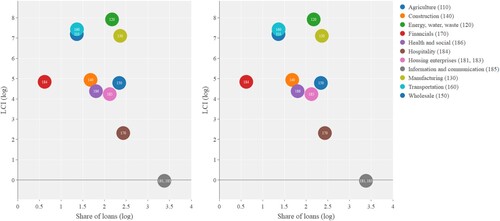
As shown in (column 6), the highest LCI is recorded for the Energy, water, waste sector (120), followed by Transportation (160) and Agriculture (110). These values are aligned with sectors' (high) carbon intensity values. Following the ratio logic of (loan) carbon intensity, the rationale is their high emissions (see, e.g. the difference between the Rank GHG and Rank LV in ) in comparison to their economic and loan value weight. In addition to analyzing current LCI, observing changes in LCI over time is equally important, as they reveal the dynamics of emissions reduction efforts and the financial sector's exposure to a specific economic sector over time. The energy sector (120) provides a primary example of these dynamics. As shown in , it displays a negative change in LCI between 2008 and 2018 because the GHG emissions decreased by 20% while the LV doubled in the same period, in line with the increasing economic importance measured by the increasing GVA.
Figure 5. Changes (in %) of the main variables under scrutiny over the period 2008–2018. Source: Research Data and Service Centre (RDSC) Deutsche Bundesbank, dataset: QBS, data period: 01.01.2008–31.12.2018, own elaborations.
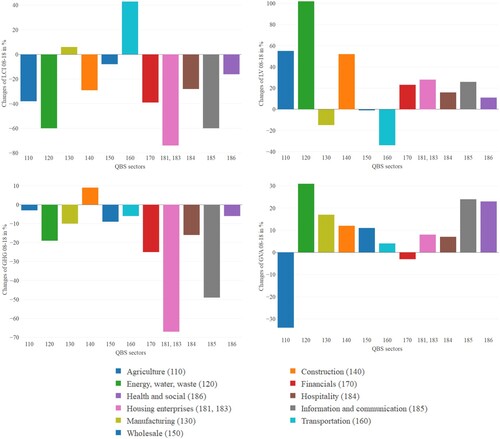
Regarding the agricultural sector (110), the high LCI results from its relatively low loan value compared to its (medium to high) GHG emissions. Still, the overall LCI change over time is negative due to an increased LV and decreased GHG emissions as reported in . In contrast to the increase in LV, which is in line with an overall increase of aggregate LV, the sector's GVA decreased by around 34%. As mentioned, the declining relevance for GVA is due to the less economic importance of the agricultural sector for industrial countries. Despite the negative LCI change over time, transitions risks for the agricultural sector can arise through different transmission channels than the pricing of CO2 emissions, i.e. agricultural policy reforms or consumption changes, and the need to adapt to climate change makes it vulnerable to physical and transition risks (NGFS Citation2019a). Due to its dependency on nature-based ecosystems, the sector can be exposed to severe physical and, therefore, financial risks because of, e.g. land-use change through soil sealing and landscape fragmentation, widespread pollution of terrestrial and aquatic ecosystems, as well as overexploitation of natural resources (Ufz-Umweltforschungszentrum Citation2006; Batten, Sowerbutts, and Tanaka Citation2016; Allen et al. Citation2020; NGFS Citation2021). In addition, the loss of biodiversity can represent a major risk for financial stability (Kedward, Ryan-Collins, and Chenet Citation2020; Crona, Folke, and Galaz Citation2021; Dasgupta Citation2021).
Despite the negative LCI variation over time, transitions risks for the agricultural sector can manifest over different transmission channels. The NGFS (Citation2019a) emphasizes the interdependence of physical and transition risks, which makes the agricultural sector especially vulnerable to political or consumption changes. Due to its dependency on nature-based ecosystems, the sector can be exposed to severe physical risks, e.g.because of land-use change through soil sealing and landscape fragmentation, widespread pollution of terrestrial and aquatic ecosystems, as well as overexploitation of natural resources (Ufz-Umweltforschungszentrum Citation2006; Battiston, Mandel, and Monasterolo Citation2021). Related to this, the loss of biodiversity can represent a major risk for financial stability (Kedward, Ryan-Collins, and Chenet Citation2020; Crona, Folke, and Galaz Citation2021; Dasgupta Citation2021). Since the agricultural sector (110) is mainly dependent on natural capital and its possibility to generate flows of ecosystem services, further losses can pose severe financial risks (Batten, Sowerbutts, and Tanaka Citation2016; Allen et al. Citation2020; NGFS Citation2021).
Transportation (160) and Manufacturing (130) exhibit positive LCI changes over time because their decrease in LV exceeds the decrease in GHG emissions.
The gap between decreasing LV and increasing GVA for the manufacturing sector (130) can be explained by more diversified funding sources. The equity ratio for the German manufacturing sector has steadily increased since 2008 (Deutsche Bundesbank Citation2018), and the debt financing changed due to the increasing importance of bond emissions (Statista Citation2021). Both tendencies contribute to a lower LV. However, we expect the sector's loan demand to increase since it will face deep transformation processes during the next decade, such as digitalization, use of artificial intelligence, automatization, predictive maintenance, and carbon neutrality (Nacchia et al. Citation2021). Moreover, additional massive investments from the private sector are needed to increase its energy efficiency (Agora Energiewende Citation2021). Due to its economic importance, future challenges, and industrial diversity, the evaluation of the positive LCI, in this case, is more difficult.
According to the method discussed in Section 3 and the ranks reported in , the carbon-critical sectors (CCrS) can be identified, showing that Energy, water, waste (120), and Manufacturing (130) are the most exposed to transition risks (see Rank AVE in ). Both sectors are responsible for a considerable amount of GHG emissions (see Rank GHG in ) and are thus significantly affected by future climate policy actions. In addition, the banking sector shows substantial loan exposure to these sectors (see Rank LV in ). Thus, the negative implications of an abrupt change in climate policy on the economic situation and, consequently, companies' creditworthiness from these sectors imply the materialization of credit risks, thus presenting the most relevant transition risk for financial stability. The robustness of these results was further assessed by computing the CCrS by considering the carbon intensity (Rank CI) instead of the total GHG emission, as the respective sector's economic activity might inflate total GHG emission. Our findings do not change, implying that the transition risk potential for Energy, water, waste (120), and Manufacturing (130) can both be deemed substantial when considering their overall GHG emissions and the carbon intensity.
4.3. Transition risks for different banking and size groups
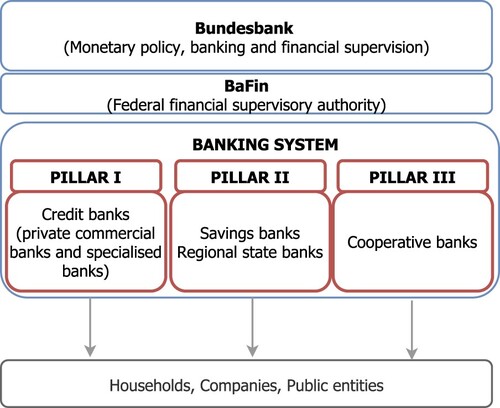
Germany is considered the prototype of a country with a bank-based financial system (Dietrich and Vollmer Citation2012; Memmel and Schertler Citation2012; Behr and Schmidt Citation2015) that consists of three different types of banks, usually also defined as the three banking pillars (see ). Pillar 1 comprises private profit-oriented credit institutions defined exclusively by a private ownership structure. Pillar 2 includes saving banks divided into local and regional banks, i.e. the Landesbanken. Pillar 3 comprises cooperative banks (and their regional institutions) and has the largest number of independent institutions of any bank group (see ).
Figure 6. The German financial system. Source: Authors' elaboration.
Considering the financial system's structure, we analyzed the exposures of the different size (SZ) and bank groups (BGRS) to each QBS sector, as reported in .
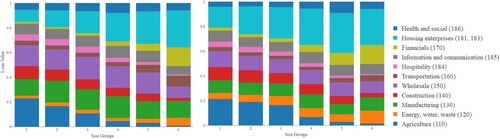
Regarding the size groups, we note that the biggest banks (SZ 6) have a higher share of their loan exposure assigned to sectors: Energy, water, waste (120), Transportation (160), and Financials (170) than any other size group, as shown in . Further, larger banks (SZ 4–6) have a higher share of their loans exposed to the Housing sector (181, 183) than smaller banks (size group 1-3). Since the Energy, water, waste (120) is identified as a CCrS sector, the biggest banks (SZ 6) are characterized by an over-proportional transition risk exposure compared to other size groups. In addition, the share of loans to this sector has increased from 6.43% (2008) to 10.40% (2018) for this size group. Further, the largest banks (SZ 6) also possess the highest share of loan exposure towards the Financial sector (15.25%), making them more vulnerable to potentially destabilizing feedback loops and second-order effects. In contrast, the share of loan exposure to the agricultural sector (110) is consistently higher for smaller banks, resulting in higher financial risks after the materialization of physical risks, which are in particular floods in the case of Germany (Pagliari Citation2021). Concerning the other CCrS sectors, the exposure of the different size groups is equally distributed.
Figure 7. Distribution of loans to QBS sectors per size group as of 2008 and 2018. Source: Research Data and Service Centre (RDSC) Deutsche Bundesbank, datasets: BISTA, QBS, data period: 01.01.2008–31.12.2018, own elaborations.
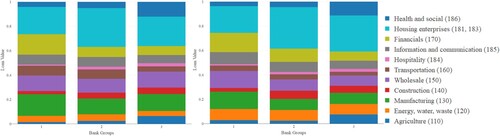
Considering different bank groups as shown in , Housing enterprises (181, 183) account for the highest share of LV across all bank groups, followed by Manufacturing (130) and Wholesale (150). Regarding Manufacturing (130), the share of loans to this sector is considerably higher for private banks (BGRS 1) than for the other two bank groups. No substantial differences between the different bank groups are observed when considering Energy, water, waste (120). However, the share of loans to this sector nearly doubles for all bank groups between 2008 and 2018. From a transition risk perspective, our analysis demonstrates that the saving banks group (BGRS 2) and credit cooperatives (BGRS 3) are slightly less exposed to this kind of risk. Moreover, credit cooperatives show the highest exposure to the agricultural sector, indicating higher exposure to physical risk for this bank group.
Figure 8. Distribution of loans to QBS sectors per bank group as of 2008 and 2018. Source: Research Data and Service Centre (RDSC) Deutsche Bundesbank, datasets: MaMFI, QBS, data period: 01.01.2008–31.12.2018, own elaborations.
Finally, we analyze the exposures of the different size and bank groups to the CPRS sectors on an aggregate level (i.e. without looking at exposures to a single CPRS) in . The rationale for performing an aggregate analysis is related to matching issues between the definition of sectors according to the CPRS approach and the QBS data aggregation; this implies that our analysis on German data cannot distinguish between the loan exposure towards different CPRS. Nevertheless, we can observe differences in the overall level of transition risk exposure. While the exposure towards CPRS is comparable across all size and bank groups at around 25%, private banks (BGRS 1) are slightly more exposed than other bank groups, which is in line with the previous analyzes considering the CCrS. Further, banks from SZ 6 have a higher share of their loan exposure assigned to CPRS than any other size group, which is again in line with the results of our previous analyzes. In addition, there are some outliers regarding specific size and bank group combinations. For instance, the exposure of small Sparkassen and Landesbanken (SZ 1 and BGRS 2) to the CPRS substantially exceeds the exposure of any other size and bank group combination.Footnote11 In contrast, the second biggest group of Pillar 3 banks have only 13% of their loans exposed to CPRS.
Table 7. Distribution of loan exposure to CPRS sectors for different size and bank groups in % as of 2018.
5. Discussion
The proposed empirical analysis indicates that the exposure of the German banking system to climate transition risks is non-negligible. Depending on the estimation method used, we find that the exposure is 19.41% (CCrS), 32.56% (LCI), and 25.17% (CRPS) of the total loan volume, as summarized in , and that certain banks face an amplified risk from a possible transformation in climate policies, technological change, or preference shocks, because of concentration of risks in certain sectors.
Table 8. Quantification of transition risks of the German banking system according to alternative methods.
When comparing the exposure estimates across the different approaches used in our analysis, methods and data requirements should be carefully considered.Footnote12 To estimate the LCI, we aggregate the loan volume of the QBS sectors above the median LCI, implying an overall higher exposure level for the LCI than for the CCrS assessment. The analysis indicates that a higher share of big private banks' portfolios tends to be exposed to CCrS. In particular, when relying on the CCrS method, we find that 8.79% of exposures refer to Energy, water, and waste (120); while all bank groups are affected, large banks are most exposed. The manufacturing sector accounts for 10.61% of exposures, with private banks presenting the most exposed bank group. Resorting to the LCI method, we find that the sector that accounts for the highest exposure is Energy, water, and waste (120), followed by Transportation (160). Regarding the bank and size groups, we find evidence that the highest exposures affect large and private banks in this case.
When applying the CPRS method, we find an overall exposure of 25.17% involving large, private, and small saving banks. The analysis highlights that the energy, transportation, and manufacturing sectors are particularly exposed to transition risks. This finding implies that renewable energy policies, coal and gas exit strategies, and other economic and transportation policies could potentially negatively affect financial stability in Germany if they are introduced too late or without coordination across countries (thus leading to carbon leakage) or if financial investors cannot fully anticipate their impact (Sen and von Schickfus Citation2020; van der Ploeg and Rezai Citation2020; Caldecott et al. Citation2021). Indeed, because the country's emissions targets are far from being met and still are not aligned with the 1.5 target, further policy efforts might be needed for Germany to undertake a low-carbon transition and achieve net-zero emissions (Black et al. Citation2021; Gils, Gardian, and Schmugge Citation2021; Höhne et al. Citation2021). Climate change and the transformation to a carbon-neutral economy currently dominate German political debate and agenda (Giegold Citation2021), and several actions are underway. Consider, among others, the recent German federal constitutional court decision that former Climate Protection Laws are insufficient and need to be more precise about emission mitigation beyond 2030Footnote13 and emissions' targets in specific sectors. Similarly, other institutions such as the World Economic Forum on a global scale or Germany's Federal Environment Agency on a national level emphasize the danger of ecological risks like climate action failure and extreme weather events (Umweltbundesamt Citation2021; WEF Citation2021).
Considering transformations related to the climate policy framework is particularly relevant because a disorderly transition to a low-carbon economy could affect the German banking sector via the exposures highlighted by our investigation, implying the materialization of credit risks and threats to systemic stability. On the one hand, the transition must be ‘timely and orderly’ (NGFS Citation2020a), implying that early and ambitious action to a net-zero CO2-emissions economy is needed. Against this background, it is thus crucial that banks monitor and assess their climate risks adequately and that financial supervisors assess, measure, and manage climate-related financial risks from a systemic perspective (EBA Citation2020; ECB Citation2021). Different methodological approaches have already been implemented to perform scenario analyzes and climate-related stress tests at the country level (Cleary et al. Citation2019; Giuzio et al. Citation2019; NGFS Citation2019a). Current efforts are, however, not sufficient, and Germany, together with several other European countries, still needs to implement appropriate risk identification and risk management procedures (see D'Orazio Citation2021, Citation2022, for a recent review).
For example, the stress test conducted by the Bundesbank and BaFin for small and medium-sized banks (i.e. less significant institutions, LSIs) in 2019 showed that only one-third of the German credit institutions had incorporated climate-related risks into their risk management at least to some degree and two-thirds did not take them into account at allFootnote14 (BaFin Citation2019). Our analysis shows smaller banks like LSI may face relatively lower climate transition risks than larger ones. However, it would still be prudent to adopt a cautious approach towards climate-related prudential regulation for all financial intermediaries to effectively tackle the challenges posed by climate change, as suggested by NGFS (Citation2019b) and Chenet, Ryan-Collins, and van Lerven (Citation2021). This has important policy implications for regulators and policymakers in the financial sector, as we discuss in the next section.
6. Conclusions
In recognition of the potential impact of climate risks on the stability of the German banking sector, our study aimed to examine its exposure to climate-related transition risks and identify vulnerabilities in the event of a low-carbon transition. Our study is the first to evaluate the exposure of the banking sector to transition risks in the German context and quantifies both aggregate and sectoral exposures. Although different evaluation methods prevent an accurate comparative analysis, our findings align with experiences in other countries, indicating moderate but significant exposure. The study highlights that manufacturing, electricity, and transportation sectors record the highest exposures and specific banks, particularly the largest ones, face a heightened risk in the event of a disorderly low-carbon transition.
These findings have important policy implications for financial regulators and policymakers, emphasizing the need for timely and effective action to address climate-related financial risks. In particular, our analysis suggests that taking prompt and effective climate-related financial policies at a macro level is crucial, especially given the potential disruptions and instabilities associated with the manifestation of transition risks, as noted by D'Orazio (Citation2021, Citation2023a). This ‘prudent’ approach is essential, given the uncertainty surrounding the magnitude, timing, and nature of the effects of climate change on financial stability, which are difficult to estimate using standard econometric and integrated assessment models, as highlighted by Beck and Krueger (Citation2016), Diaz and Moore (Citation2017), and Duan et al. (Citation2019). Governments and financial supervisors taking early action can provide significant benefits in reducing the severity and nature of disruptions and risks to the economy and financial markets caused by climate change. This approach is consistent with the guidelines of the ECB (Citation2020) and the recommendations of the Network for Greening the Financial System regarding the risks of inaction regarding climate-related financial measures, as emphasized by NGFS (Citation2019b).
Our findings could be integrated into broader macro stress test exercises to understand the effects of climate and/or green fiscal policies, changes in economic agents' preferences, and technological changes on the financial system's resilience. The results of this exercise could then be used to decide to activate specific supervisory instruments and adequately calibrate them D'Orazio and Popoyan (Citation2019). Schober et al. (Citation2021) have recently provided a first contribution in this direction, considering the NGFS (Citation2020a) scenarios and focusing on the implementation of a climate policy (i.e. an increase of the carbon tax) as a source of transition risk. The results of this exercise are reported in the latest Financial Stability Review, which highlights a moderate effectFootnote15 of transition risks on financial institutions' portfolios (Deutsche Bundesbank Citation2021b).
In our view, besides the long-term work of revising the existing regulatory framework, complementary short and medium-term measures, such as supervisory and disclosure measures and developing a macroprudential approach to addressing climate risk, can be implemented (see D'Orazio Citation2021, for a recent contribution on policy options for G20 countries).
Acknowledgments
The authors are grateful to Ivan Faiella, Franziska Hoffart, Luciano Lavecchia, Irene Monasterolo, Stephan Paul, and Dorothea Schäfer for constructive comments and fruitful discussions on earlier versions of the manuscript. The usual disclaimer applies.
Disclosure statement
No potential conflict of interest was reported by the author(s).
Data disclosure statement
The financial institutes data were obtained during multiple research visits at the Bundesbank (Project-Number: 2021/0016) and are based on the following datasets:
Monthly Balance Sheet Statistics (BISTA), published 2021-04-29, Version 1, DOI: https://doi.org/10.12757/BBk.BISTA.99Q1-20Q4.01.01.
Quarterly Borrowers Statistics (QBS), URL: https://www.bundesbank.de/de/bundesbank/forschung/fdsz/forschungsdaten/vierteljaehrliche-kreditnehmerstatistik-vjkre–604532.
Selected Master Data for MFIs (MaMFI), published 2021-09-30, Version 1, DOI: https://doi.org/10.12757/Bbk.MaMFI.199901-202106.01.01.
Notes
1 Relying on the classification table retrieved from the Center for Financial Networks and Sustainability website, economic activities are identified as negatively affected by transition risks if they are assigned to the CPRS 01–05 (FINEXUS Citation2021).
2 Financial institutes' data was obtained during multiple research visits at the Research Centre of the Deutsche Bundesbank (Project-Number: 2021/0016). For further information, see Beier, Krueger, and Schäfer (Citation2018), Gomolka, Schäfer, and Stahl (Citation2021), Stahl (Citation2021) and the data disclosure agreement. In line with previous studies (see Section 2), we focus on the analysis of loan exposure, as the total exposure of all German banks to corporate bonds (corporate equities) amounted to 60.301 mil. €(€63.361 mil.) at the end of 2018, each representing less than 5% of the analyzed loan exposure (Deutsche Bundesbank Citation2021a).
3 With a response rate of 100% and no minimum thresholds regarding the loan volume, the QBS provides full coverage of the loan activities in the German banking system (Beier, Krueger, and Schäfer Citation2018).
4 There is an ongoing debate on how a countries' emissions should be computed. A first option relies on the so-called territorial principle according to which the emissions are attributed to the products manufactured within a country territory, even if intended for export (Tukker, Wood, and Schmidt Citation2020). Alternatively, they can be calculated according to the consumption principle by adding all the emissions accumulated by consuming goods within a country, including emissions from imports (Peters Citation2008). Considering Germany's comparatively high balance of payment surplus, we believe that the territorial principle is the appropriate approach for our analysis. For a more granular analysis of GHG emissions, considering the whole value chain of produced goods, one should consider the product-level embodied emissions originally developed by Vermeulen et al. (Citation2019). However, the current level of data availability limits the application of this method on a larger scale.
5 Although GHG emission and GVA data are sporadically available up to 2020, there is no or only preliminary data for some sectors. Therefore, we only employ data until 2018 to provide consistency throughout our analyzes.
6 For further information see Stahl (Citation2021) and the data disclosure agreement.
7 For further information see Gomolka, Schäfer, and Stahl (Citation2021) and the data disclosure agreement.
8 However, since only a few institutes exhibit loans' exposures towards some economic sectors, a more aggregated size group differentiation should be applied. In addition, due to the restrictions regarding the minimum number of reporting institutes, the loan exposure to specific size group and bank group combinations can only be assessed for some of our analyzes.
9 CO2 equivalent is a metric measure used to compare the global warming potential of various greenhouse gases such as methane (CH4) or nitrous oxide (N2O) based on their global warming potential. The amounts of other greenhouse gases are converted into the equivalent amount of carbon dioxide that would have the same effect on global warming (over one hundred years).
10 We note that in the analysis in this section, different industry aggregations are applied compared to those used in Section 4.1 because the QBS sectors often consist of or are assigned to multiple NACE Rev. 2 divisions. For a comparison see .
11 We note that for this size and bank group combination only five reporting institutes were considered (see ).
12 Because of matching issues between the QBS data aggregation and Eurostat's emission data, we can only differentiate between 11 economic sectors. Hence, implementing the CCrS methodology identifies only two sectors as carbon critical. Besides the inherent differences between the Italian and German financial systems, this difference related to economic sectors' classification might explain why the exposure estimations for German banks are considerably lower than those found for Italian banks, as described in Faiella and Lavecchia (Citation2020).
13 German lawmakers adopted a crucial reform of the Climate Action Law in summer 2021, introducing more ambitious greenhouse gas reduction targets and details on post-2030 goals. This became necessary after a landmark ruling by the Constitutional Court on 29 April 2021, according to which the law needed to be revised as it needed more details on emissions reduction beyond 2030 (Bundesregierung Citation2021).
14 The report points out that most German LSI (44%) are not taking ecological and climate-related risks into their risk management. The institutes were asked to answer, ‘To what extent do you currently consider ecological and climate-related risks in your risk management?’ (see BaFin Citation2019). Only 1% of the institutes answered that climate risks are taken fairly comprehensively into account, 33% to some extent, and 22% not at all, but planning to take risks into account. Overall, 73% perceive the climate risk to their institution as low, 14% as moderate, and 0.6% as high.
15 This result is in line with the findings of our study, although the two analyzes rely on different data sources.
References
- Agora Energiewende. 2021. Klimaneutrale industrie. Agora Energiewende.
- Allen, T., S. Dees, C.M. Caicedo Graciano, V. Chouard, L. Clerc, A. de Gaye, A. Devulder, et al. 2020. Climate-related scenarios for financial stability assessment: An application to France. Banque de France Working Paper.
- BaFin. 2019. Merkblatt zum Umgang mit Nachhaltigkeitsrisiken. BaFin -- Bundesanstalt für Finanzdienstleistungsaufsicht.
- Batten, S., R. Sowerbutts, and M. Tanaka. 2016. Let's talk about the weather: The impact of climate change on central banks. Technical report, Bank of England.
- Batten, S., R. Sowerbutts, and M. Tanaka. 2020. “Climate change: Macroeconomic impact and implications for monetary policy.” In: Ecological, societal, and technological risks and the financial sector. Palgrave studies in sustainable business in association with future earth, edited by T. Walker, D. Gramlich, M. Bitar, and P. Fardnia. Cham: Palgrave Macmillan. https://doi.org/10.1007/978-3-030-38858-4_2.
- Battiston, S., M. Guth, I. Monasterolo, B. Neudorfer, and W. Pointner. 2020. Austrian banks' exposure to climate-related transition risk. Financial Stability Report 40: 31–44.
- Battiston, S., A. Mandel, and I. Monasterolo. 2020. Financing a net-zero economy -- measuring and adressing climate risk for banks. CERES report.
- Battiston, S., A. Mandel, and I. Monasterolo. 2021. Financing a net-zero economy -- the consequences of physical climate risk for banks. CERES report.
- Battiston, S., A. Mandel, I. Monasterolo, F. Schütze, and G. Visentin. 2017. A climate stress-test of the financial system. Nature Climate Change 7, no. 4: 283–8.
- Battiston, S., and I. Monasterolo. 2019. How could the ecb's monetary policy support the sustainable finance transition? FINEXUS: Center for Financial Networks and Sustainability.
- BCBS. 2021a. Climate-related financial risks – measurement methodologies. Technical report, BCBS -- Basel Committee on Banking Supervision -- Bank for International Settlements.
- BCBS. 2021b. Climate-related risk drivers and their transmission channels. Technical report, BCBS -- Basel Committee on Banking Supervision -- Bank for International Settlements.
- Beck, M., and T. Krueger. 2016. The epistemic, ethical, and political dimensions of uncertainty in integrated assessment modeling. Wiley Interdisciplinary Reviews: Climate Change 7, no. 5: 627–45.
- Behr, P., and R.H. Schmidt. 2015. The german banking system: Characteristics and challenges. Technical report, SAFE White Paper.
- Beier, R., M. Krueger, and M. Schäfer. 2018. Quarterly Borrowers Statistics 03/1999-06/2018. Data Report 2018-04 -- Metadata Version 1, Deutsche Bundesbank Research Data and Service Centre (RDSC).
- Bellrose, K., D. Norman, and M. Royters. 2021. Climate change risks to australian banks— bulletin–september 2021.
- Black, S., R. Chen, A. Mineshima, V. Mylonas, I. Parry, and D. Prihardini. 2021. \aftergroup \futurelet \relax \special {t4ht=}¡/misc-text¿Scaling up climate mitigation policy in germany. Working paper 21/241.
- BoE-PRA. 2015. The impact of climate change on the uk insurance sector a climate change adaptation report by the prudential regulation authority. Technical report, Bank of England -- Prudential Authority Regulation.
- BoE-PRA. 2019. A framework for assessing financial impacts of physical climate change. Technical report, Bank of England -- Prudential Authority Regulation.
- Bolton, P., M. Després, L.A.P. da Silva, F. Samama, and R. Svartzman. 2020. The green swan. BIS books.
- Botzen, W.W., O. Deschenes, and M. Sanders. 2019. The economic impacts of natural disasters: A review of models and empirical studies. Review of Environmental Economics and Policy 13, no. 2: 167–88.
- Boyle, A.D., G. Leggat, L. Morikawa, Y. Pappas, and J.C. Stephens. 2021. Green new deal proposals: Comparing emerging transformational climate policies at multiple scales. Energy Research & Social Science 81: 102259.
- Breitenstein, M., D.K. Nguyen, and T. Walther. 2021. Environmental hazards and risk management in the financial sector: A systematic literature review. Journal of Economic Surveys 35, no. 2: 512–38.
- Bressan, G., I. Monasterolo, and S. Battiston. 2021. Reducing climate transition risk in central banks' asset purchasing programs. Available at SSRN 3770192.
- Bundesfinanzministerium. 2021. Klimaschutz Sofortprogramm 2022 -- Scholz: Deutschland soll vorreiter beim Klimaschutz werden!.
- Bundesregierung. 2021. Generationenvertrag für das Klima. Klimaschutzgesetz 2021.
- Caldecott, B., A. Clark, K. Koskelo, E. Mulholland, and C. Hickey. 2021. Stranded assets: Environmental drivers, societal challenges, and supervisory responses. Annual Review of Environment and Resources46: 417–47.
- Campiglio, E., Y. Dafermos, P. Monnin, J. Ryan-Collins, G. Schotten, and M. Tanaka. 2018. Climate change challenges for central banks and financial regulators. Nature Climate Change 8, no. 6: 462.
- Carney, M. 2015. Breaking the tragedy of the horizon–climate change and financial stability. Speech Given at Lloyd's of London 29: 220–30.
- Chenet, H., J. Ryan-Collins, and F. van Lerven. 2021. Finance, climate-change and radical uncertainty: Towards a precautionary approach to financial policy. Ecological Economics 183: 106957.
- Cleary, P., W. Harding, J. McDaniels, J.-P. Svoronos, and J. Yong. 2019. Turning up the heat-climate risk assessment in the insurance sector.
- Coeuré, B. 2018. Monetary policy and climate change, speech by b. coeuré, member of the executive board of the ecb, at a conference on “scaling up green finance: The role of central banks”. European Central Bank.
- Crona, B., C. Folke, and V. Galaz. 2021. The anthropocene reality of financial risk. One Earth 4, no. 5: 618–28.
- Dasgupta, P. 2021. The economics of biodiversity: The Dasgupta review. London: HM Treasury.
- Daumas, L. 2023. Financial stability, stranded assets and the low-carbon transition–a critical review of the theoretical and applied literatures. Journal of Economic Surveys.
- Delis, M., K. De Greiff, and S. Ongena. 2018. Being stranded on the carbon bubble? climate policy risk and the pricing of bank loans. SFI Research Paper (8–10).
- Deutsche Bundesbank. 2018. Tendenzen in den Finanzierungsstrukturen deutscher nichtfinanzieller Unternehmen im Spiegel der Unternehmensabschlussstatistik. Bundesbank Monatsbericht Juli 2018: 61–73.
- Deutsche Bundesbank. 2021a. Bankenstatistik April 2021 -- Statistische Fachreihe. Deutsche Bundesbank.
- Deutsche Bundesbank. 2021b. Financial Stability Review 2021. Deutsche Bundesbank November 2021.
- Diaz, D., and F. Moore. 2017. Quantifying the economic risks of climate change. Nature Climate Change7, no. 11: 774–82.
- Dietrich, D., and U. Vollmer. 2012. Are universal banks bad for financial stability? germany during the world financial crisis. The Quarterly Review of Economics and Finance 52, no. 2: 123–34.
- Dietz, S., A. Bowen, C. Dixon, and P. Gradwell. 2016. “Climate value at risk” of global financial assets. Nature Climate Change 6, no. 7: 676.
- DNB. 2017. Waterproof? An exploration of climate-related risks for the dutch financial sector. De Nederlandsche Bank, working paper.
- D'Orazio, P. 2021. Towards a post-pandemic policy framework to manage climate-related financial risks and resilience. Climate Policy 21, no. 10: 1368–82.
- D'Orazio, P. 2022. Mapping the emergence and diffusion of climate-related financial policies: Evidence from a cluster analysis on G20 countries. International Economics 169: 135–47.
- D'Orazio, P. 2023a. Are current prudential frameworks up to the challenge of climate risks?. Intereconomics 58, no. 2: 96–101.
- D'Orazio, P. 2023b. Climate change and macro-financial risks: Financial policy responses for an orderly low-carbon transition. Environmental Research: Climate 2, no. 1: 013002.
- D'Orazio, P. 2023. “The politics of climate finance and policy initiatives to promote sustainable finance and address ESG issues.” In Sustainable finance and ESG. Palgrave Macmillan studies in banking and financial institutions, edited by C. Gaganis, F. Pasiouras, M. Tasiou, and C. Zopounidis. Cham: Palgrave Macmillan. https://doi.org/10.1007/978-3-031-24283-0_7.
- D'Orazio, P., and P. Löwenstein. 2022. Mobilising investments in renewable energy in germany: Which role for public investment banks?. Journal of Sustainable Finance & Investment 12, no. 2: 451–74.
- D'Orazio, P., and L. Popoyan. 2019. Fostering green investments and tackling climate-related financial risks: Which role for macroprudential policies?. Ecological Economics 160: 25–37.
- D'Orazio, P., and L. Popoyan. 2022. Realising central banks' climate ambitions through financial stability mandates. Intereconomics 57, no. 2: 103–11.
- D'Orazio, P., and L. Popoyan. 2023. Do monetary policy mandates and financial stability governance structures matter for the adoption of climate-related financial policies?. International Economics 173: 284–95.
- Duan, H., G. Zhang, S. Wang, and Y. Fan. 2019. Robust climate change research: A review on multi-model analysis. Environmental Research Letters 14, no. 3: 033001.
- EBA. 2020. On management and supervision of ESG risks for credit institutions and investment firms (EBA discussion paper). European Banking Authority.
- ECB. 2020. Guide on climate-related and environmental risks. supervisory expectations relating to risk management and disclosure. European Central Bank, November 2020.
- ECB. 2021. ECB economy-wide climate stress test. Occasional Paper Series No. 281, Frankfurt: European Central Bank.
- Eckstein, D., V. Künzel, L. Schäfer, and M. Winges. 2019. Global climate risk index 2020. Bonn: Germanwatch.
- Elderson, F. 2018. From mission to supervision: Putting sustainable prosperity on the agenda of the dutch central bank. lse sustainable finance leadership series.
- European Parliament. 2021. Regulation (eu) 2021/1119 of the european parliament and of the council of 30 June 2021 establishing the framework for achieving climate neutrality and amending regulations (ec) no 401/2009 and (eu) 2018/1999 ('european climate law'). European Parliament Regulation (EC) No 401/2009 and (EU) 2018/1999 ('European Climate Law') PE/27/2021/REV/1.
- Eurostat. 2021a. Air emissions accounts by NACE rev. 2 activity.
- Eurostat. 2021b. National accounts aggregates by industry.
- Faiella, I., and L. Lavecchia. 2020. The carbon content of italian loans. Journal of Sustainable Finance & Investment 12, no.3: 939–957.
- FINEXUS. 2021. Climate policy relevant sectors. https://www.finexus.uzh.ch/en/projects/CPRS.html.
- Giegold, S. 2021. Germany must become an ecological social market economy. The Financial Times, 12 December 2021.
- Gils, H.C., H. Gardian, and J. Schmugge. 2021. Interaction of hydrogen infrastructures with other sector coupling options towards a zero-emission energy system in germany. Renewable Energy 180: 140–56.
- Giuzio, M., D. Krušec, A. Levels, A.S. Melo, K. Mikkonen, and P. Radulova, 2019. Climate change and financial stability. Financial Stability Review 1.
- Gomolka, M., M. Schäfer, and H. Stahl. 2021. Monthly Balance Sheet Statistics (BISTA). Data Report 2021-10 – Metadata Version BISTA-Doc-v3-0, Deutsche Bundesbank Research Data and Service Centre (RDSC).
- Höhne, N., M.J. Gidden, M. den Elzen, F. Hans, C. Fyson, A. Geiges, M.L. Jeffery, et al. 2021. Wave of net zero emission targets opens window to meeting the paris agreement. Nature Climate Change 11, no. 10: 820–22.
- IPCC. 2014. Climate change 2014: Synthesis report. Technical report, Intergovernmental Panel on Climate Change.
- IPCC. 2018. Global warming of 1.5 degrees: Summary for policymakers. Technical report, Intergovernmental Panel on Climate Change.
- IPCC. 2021. Ar6 climate change 2021: The physical science basis. Technical report, Intergovernmental Panel on Climate Change.
- IPCC. 2023. Ar6 synthesis report: Climate change 2023. Technical report, Intergovernmental Panel on Climate Change.
- Kedward, K., J. Ryan-Collins, and H. Chenet. 2020. Managing nature-related financial risks: A precautionary policy approach for central banks and financial supervisors. Available at SSRN 3726637.
- Keles, D., and H. Ü. Yilmaz. 2020. Decarbonisation through coal phase-out in germany and europe–impact on emissions, electricity prices and power production. Energy Policy 141: 111472.
- Kemfert, C., D. Schäfer, and W. Semmler. 2020. Great green transition and finance. Intereconomics55: 181–6.
- Krogstrup, S., and W. Oman. 2019. Macroeconomic and financial policies for climate change mitigation: A review of the literature. Washington, D.C.: International Monetary Fund.
- Lamb, W.F., and J.C. Minx. 2020. The political economy of national climate policy: Architectures of constraint and a typology of countries. Energy Research & Social Science 64: 101429.
- Lane, P. 2019. Climate change and the Irish financial system. Bank of Ireland 1.
- Memmel, C., and A. Schertler. 2012. The dependency of the banks' assets and liabilities: Evidence from germany. European Financial Management 18, no. 4: 602–19.
- Michaelowa, A. 2013. The politics of climate change in germany: Ambition versus lobby power. Wiley Interdisciplinary Reviews: Climate Change 4, no. 4: 315–20.
- Monasterolo, I. 2020. Climate change and the financial system. Annual Review of Resource Economics12: 299–320.
- Nacchia, M., F. Fruggiero, A. Lambiase, and K. Bruton. 2021. A systematic mapping of the advancing use of machine learning techniques for predictive maintenance in the manufacturing sector. Applied Sciences 11, no. 6: 2546.
- NGFS. 2019a. A call for action -- climate change as a source of financial risk, first comprehensive report. Network for Greening the Financial System.
- NGFS. 2019b. A call for actions. climate change as a source of financial risk. Network for Greening the Financial System April 2019.
- NGFS. 2020a. NGFS climate scenarios for central banks and supervisors. Network for Greening the Financial System June 2020.
- NGFS. 2020b. Survey on monetary policy operations and climate change: Key lessons for further analyses. Network for Greening the Financial System.
- NGFS. 2021. Biodiversity and financial stability: Building the case for action. Network for Greening the Financial System.
- OMFIF. 2020. Tackling climate change: The role of banking regulation and supervision.
- Pagliari, M.S. 2021. Lsis' exposures to climate change related risks: An approach to assess physical risks. European Central Bank.
- Peters, G.P. 2008. From production-based to consumption-based national emission inventories. Ecological Economics 65, no. 1: 13–23.
- Polzin, F., and M. Sanders. 2020. How to finance the transition to low-carbon energy in europe?. Energy Policy 147: 111863.
- Ranger, N.A., O. Mahul, and I. Monasterolo. 2022. Assessing financial risks from physical climate shocks. World Bank.
- Reaños, M.A.T. 2021. Floods, flood policies and changes in welfare and inequality: Evidence from germany. Ecological Economics 180: 106879.
- Ritter, R. 2022. Banking sector exposures to climate risks: Overview of transition risks in the hungarian corporate loan portfolio. Financial and Economic Review 21, no. 1: 32–55.
- Roelfsema, M., H.L. van Soest, M. Harmsen, D.P. van Vuuren, C. Bertram, M. den Elzen, N. Höhne, et al. 2020. Taking stock of national climate policies to evaluate implementation of the Paris agreement. Nature Communications 11, no. 1: 1–12.
- Roncoroni, A., S. Battiston, L.O. Escobar-Farfán, and S. Martinez-Jaramillo. 2021. Climate risk and financial stability in the network of banks and investment funds. Journal of Financial Stability 54: 100870.
- Schober, D., T. Etzel, A. Falter, I. Frankovic, C. Gross, A. Kablau, P. Lauscher, et al. 2021. Sensitivitätsanalyse klimabezogener transitionsrisiken des deutschen finanzsektors. Deutsche Bundesbank, Technical paper, 13/2021.
- Schotten, G., S. van Ewijk, M. Regelink, D. Dicou, and J. Kakes. 2016. Time for transition: An exploratory study of the transition to a carbon-neutral economy. Occasional Studies 141214–2 .
- Schulten, A., A. Bertolotti, P. Hayes, and A. Madaan. 2021. Getting physical: Scenario analysis for assessing climate-related risks. In World scientific encyclopedia of climate change: Case studies of climate risk, action, and opportunity volume 3, 211–217. World Scientific.
- Semieniuk, G., E. Campiglio, J.-F. Mercure, U. Volz, and N.R. Edwards. 2021. Low-carbon transition risks for finance. Wiley Interdisciplinary Reviews: Climate Change 12, no. 1: e678.
- Sen, S., and M.-T. von Schickfus. 2020. Climate policy, stranded assets, and investors' expectations. Journal of Environmental Economics and Management 100: 102277.
- Stahl, H. 2021. Selected master data for MFIs (MaMFI). Data Report 2021-17 – Metadata version MaMFI-Doc-v5, Deutsche Bundesbank Research Data and Service Centre (RDSC).
- Statista. 2021. Anzahl der emissionen am institutionellen markt für unternehmensanleihen in deutschland von 2007 bis 2020. Statista.
- Svartzman, R., P. Bolton, M. Despres, L.A. Pereira Da Silva, and F. Samama. 2020. Central banks, financial stability and policy coordination in the age of climate uncertainty: A three-layered analytical and operational framework. Climate Policy 21, no. 4: 563–580.
- Tagliapietra, S., G. Zachmann, O. Edenhofer, J.-M. Glachant, P. Linares, and A. Loeschel. 2019. The european union energy transition: Key priorities for the next five years. Energy Policy 132: 950–4.
- Tukker, A., R. Wood, and S. Schmidt. 2020. Towards accepted procedures for calculating international consumption-based carbon accounts. Climate Policy 20, no. sup1: S90–S106.
- Ufz-Umweltforschungszentrum. 2006. Relevance of millennium ecosystem assessment for germany. Technical report, Ufz-Umweltforschungszentrum.
- Umweltbundesamt. 2021. Klimawirkungs- und risikoanalyse 2021 für Deutschland. Umweltbundesamt.
- van der Ploeg, F., and A. Rezai. 2020. The risk of policy tipping and stranded carbon assets. Journal of Environmental Economics and Management 100: 102258.
- van Soest, H.L., M.G. den Elzen, and D.P. van Vuuren. 2021. Net-zero emission targets for major emitting countries consistent with the Paris agreement. Nature Communications 12, no. 1: 1–9.
- Vermeulen, R., E. Schets, M. Lohuis, B. Kölbl, D.-J. Jansen, and W. Heeringa. 2019. The heat is on: A framework for measuring financial stress under disruptive energy transition scenarios.
- Vogt-Schilb, A., and S. Hallegatte. 2017. Climate policies and nationally determined contributions: Reconciling the needed ambition with the political economy. Wiley Interdisciplinary Reviews: Energy and Environment 6, no. 6: e256.
- WEF. 2021. The global risks report 2021. WEF -- World Economic Forum.
- Weidmann, J. 2020. Combating climate change -- what central banks can and cannot do?. Speech at the European Banking Congress.
- Westcott, M., J. Ward, S. Surminski, P. Sayers, and D.N. Bresch. 2019. Physical risk framework: Understanding the impacts of climate change on real estate lending and investment portfolios. Technical report, ETH Zurich.
- Weyzig, F., B. Kuepper, J.W. Van Gelder, and R. Van Tilburg. 2014. The price of doing too little too late: The impact of the carbon bubble on the eu financial system. Green New Deal Series 11.
- Zheng, X., D. Streimikiene, T. Balezentis, A. Mardani, F. Cavallaro, and H. Liao. 2019. A review of greenhouse gas emission profiles, dynamics, and climate change mitigation efforts across the key climate change players. Journal of Cleaner Production 234: 1113–33.