
 ?Mathematical formulae have been encoded as MathML and are displayed in this HTML version using MathJax in order to improve their display. Uncheck the box to turn MathJax off. This feature requires Javascript. Click on a formula to zoom.
ABSTRACT
Hydrogen and oxygen stable isotope mass ratios (δ2H and δ18O) are conservative tracers that reflect hydrological conditions of watersheds and lakes, information that can be used for water budgets, such as estimating nutrient loading from the catchments and direct and indirect effects of climate change on waterbodies. We measured δ2H and δ18O values and estimated water mass balances over 2 hydrologically differing years in a chain of 10 boreal lakes. During a warm and dry summer, evaporative loss enriched the isotope values at lake surfaces. Thus, in lakes that were thermally stratified during summer, the isotope values differed distinctively between epilimnion and hypolimnion. During the following rainy summer, the within-lake variation of isotope values was much lower with no clear trend, presumably a result of a more unstable water column and faster water throughflow in the lake chain. After autumnal mixing the lake δ18O values were strongly correlated with lake area and proportion of inland waters of the catchment area. The interannual within-lake difference was then ∼1‰, indicating differences in evaporation. Isotope mass balance (IMB) calculations and those based on lake temperature and hydrological measurements in the nearby region yielded similar results for the rainy ice-free period. Presumably, prerequisites of steady-state conditions for IMB were better met in the rainy year than during the previous drier year. For some lakes the results suggested remarkable volumes of groundwater inflow, whose role in boreal lake water budgets deserves more attention in future studies.
Introduction
Stable isotope mass ratios of hydrogen (δ2H) and oxygen (δ18O) and the knowledge of kinetic fractionation against heavier molecules in water reactions are widely applied in hydrological research to estimate water origin, evaporation, and flow through a landscape, starting from precipitation and ending through catchments to rivers and lakes (e.g., Gibson Citation2002, Gibson and Edwards Citation2002, Jonsson et al. Citation2009, Haig et al. Citation2021). Global variation in precipitation and its original isotope mass ratios as well as seasonal variation in the ratio between evaporation to precipitation are strongly reflected in the δ2H and δ18O values in soils and aquatic systems (Kortelainen and Karhu Citation2004, Gibson et al. Citation2008, Jonsson et al. Citation2009). Stable isotope values are also used to model groundwater flow to lakes and rivers (Stets et al. Citation2010, Isokangas et al. Citation2015), but few lake studies have covered time series of δ2H and δ18O values over different seasons and depth profiles, including both epilimnion and hypolimnion. Among those, Halder et al. (Citation2013) applied an isotope approach for studying transport and mixing of River Rhone water in Lake Geneva in Switzerland and France; Perini et al. (Citation2009) studied mixing, stratification, and water origin in 6 lakes in the Italian Alps; and Braig et al. (Citation2010) investigated these phenomena in 3 lakes in southern Germany.
Knowledge on progressive enrichment of heavier isotopes during evaporation in waterbodies has been used to estimate regional water balances, especially in remote areas where direct hydrological measurements are infrequent and/or sparse (e.g., Gibson and Edwards Citation2002, Bennett et al. Citation2008, Fellman et al. Citation2011, Shi et al. Citation2017, Yapiyev et al. Citation2020). The isotope mass balance (IMB) methods are based on the model originally described by Craig and Gordon (Citation1965) and further revised and applied by, for example, Gat et al. (Citation1994), Horita and Wesolowski (Citation1994), Gibson (Citation2002), Bennett et al. (Citation2008), Horita et al. (Citation2008), Gibson and Reid (Citation2014), and Gibson et al. (Citation2016). In addition to measurements of δ2H and δ18O in the waterbodies, respective values for atmospheric moisture are needed, but these are seldom directly measured; usually, the values for rainwater collected from the region or derived from global data sources are used (e.g., Bennett et al. Citation2008, Yapiyev et al. Citation2020). The complexity of calculations and the sensitivity of results with δ2H and δ18O values of ambient air moisture have proved challenging for a wider application of the IMB method. Skrzypek et al. (Citation2015) tested the effects of evaporative loss on δ2H and δ18O enrichment in pan measurements in arid conditions and successfully applied the equations of the previously noted papers in the IMB models, combined in Hydrocalculator software, making the applications more user friendly for people not familiar with isotope chemistry.
We studied δ2H and δ18O values of water in a lake chain consisting of 10 lakes in southern Finland. The study lakes differ in their topographic, morphometric, and landscape properties. All study sites belong to the same large water system, which means that water from all the lakes flows through the lowermost and largest lake in this hydrological pathway. Therefore, we were able to follow how the stable isotope signatures were changing along the pathway from the upstream to downstream lakes. We used both hydrological and limnological measurements in the study lakes and in the nearby region as well as stable isotope ratios for water balance calculations in the lake chain. This study is a part of a project investigating loading, retention, and metabolism of carbon, nitrogen, and phosphorus in the upper reaches of a large boreal water basin, River Kokemäenjoki, running to the Baltic Sea (Valpola and Ojala Citation2006). Because the 2-year study period (2003 and 2004) had extraordinary hydrological conditions, with the lowest groundwater table during the first year and the highest summer flood during the second year since the early 1970s, the hydrological properties of the lakes were especially emphasized. We focused on 3 major questions: (1) how do seasonal and interannual hydrological conditions affect water δ2H and δ18O mass ratio values, (2) how do morphometric properties of the lakes and their position in the landscape affect these ratio values, and (3) do water balance estimates based on physical measurements in the lakes and nearby regions yield similar results to those based on stable water isotopes?
Background information
Study area
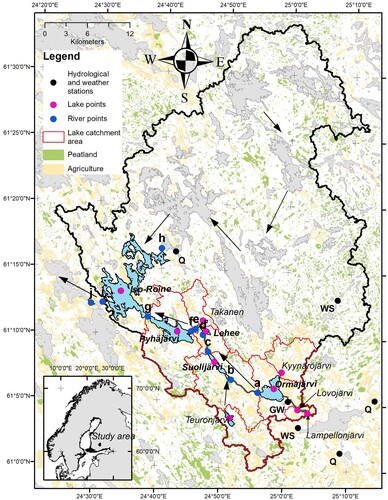
The study lakes form a hydrological network within a catchment area of 1473 km2 in southern Finland. The area is in the boreal zone, situated in the uppermost reaches of the Kokemäenjoki watercourse, the fifth largest drainage system in Finland, and flows to the Baltic Sea (, Supplemental Table S1). The landscape lies on granodiorite and gneiss bedrock, and glacial till is the dominant soil type with podzol soil on top (Valpola and Ojala Citation2006). Locally glaciofluvial soils (granules, sands, and silts) influence hydrology by groundwater formation (Valpola and Ojala Citation2006, Arvola et al. Citation2015). The catchment areas of the lakes are mainly covered by forests (40–71%), which are largely managed by forestry operations (logging, ditching). About 80–90% of peatlands in southern Finland have been ditched during the past 60 years and are included in the forests (Supplemental Table S1; data for catchment area and characteristics obtained by VALUE tool, http://paikkatieto.ymparisto.fi/value/). Agricultural land and urban environments (villages and industrial area) cover 7–35% and 2–21%, respectively, of the catchments of the study lakes while the open wetlands only cover a small proportion (0.1–4.2%).
The study lakes are typical headwater lakes in southern Finland by means of lake size (area 0.05–31.5 km2), morphology (maximum depth 3–73 m), water quality, and human influence. The lakes are connected by rivers and streams within ∼30 km from the inflow to the uppermost lake down to the outflow of the lowermost lake. The elevation difference between the highest and lowest site is 9.9 m at the mean water table. The lowest lake in the lake chain, Lake Iso-Roine, is also interconnected via River Vihavuosi with another branch of several upstream lakes not included in the study. The largest lakes (Ormajärvi, Suolijärvi, Pyhäjärvi, and Iso-Roine) are dimictic, whereas 3 shallow lakes (Lehee, Kyynärö, and Teuronjärvi) are polymictic. Two small headwater lakes, Lampellonjärvi and Lovonjärvi, are meromictic with permanent anoxic hypolimnion (data not shown). No water column data are available for Lake Takanen.
The groundwater sampling site, a local municipal raw water pumping station, is situated by the glaciofluvial sand ridge next to Lake Ormajärvi (), thus representing the local groundwater characteristics.
Figure 1. Catchment of the study area (black line) with subcatchments (red lines) and study lakes (blue) with connecting rivers and their sampling sites (dots). River sites: a = Ormajärvi, outflow; b = Suolijärvi, inflow; c = Suolijärvi, outflow; d = Lehee, inflow; e = Lehee, outflow; f = Pyhäjärvi, inflow; g = Iso-Roine, inflow southern; h = Iso-Roine, inflow northern; i = Iso-Roine, outflow; j = river Alvettulanjoki. WS = weather station, GW = groundwater sampling site, Q = discharge measurement sites. Arrows indicate flow direction.
Climate in the region
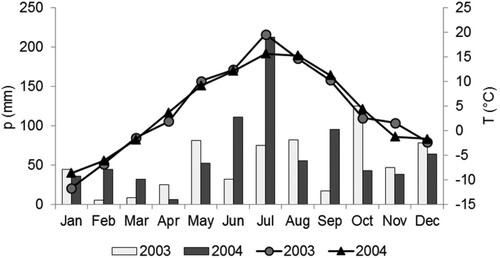
Our study area belongs to the northern temperate climate zone where temperature has a distinct seasonal pattern (Jylhä et al. Citation2014). The long-term (1981–2010) mean annual air temperature from April to October is 4.2 °C and mean monthly temperature typically >0 °C (). Annual precipitation during the same period varied between 500 and 715 mm (average 645 mm). Monthly mean of relative humidity varied between 68% and 93% (measurements from 2002–2010), with lowest values in April and May (all measurements from Lammi Pappila weather station of Finnish Meteorological Institute (FMI, https://www.ilmatieteenlaitos.fi/).
Figure 2. Monthly mean air temperature (T, lines) and precipitation sum (p, columns) during the study period at Lammi Biological Station (called Pappila Meteorological Station in FMI database).
In spring, rapid snowmelt is followed by high inflow to lakes just before ice-out. Larger lakes in the study area are ice-free from April–May to middle November–late January, and small lakes from April to early November–late December, thus ∼1 month shorter than the large lakes. In 2003 and 2004, the observed ice-out and ice-on dates in Lake Pääjärvi, a nearby lake with ice records, were 8 May and 21 December, and 27 April and 13 December, respectively.
Material and methods
Sampling
Five lakes in the chain (Ormajärvi, Suolijärvi, Lehee, Pyhäjärvi, Iso-Roine; Fig. 1, Supplemental Table S1) and river sites between those were sampled 16–17 times in 2003 and 17–18 times in 2004. The lake and river sites were sampled twice a month during the ice-free period (May–Oct), 2–3 times during the late fall before ice cover (Nov–Dec), and 1–4 times during the ice-cover period (Jan–early Apr). In addition, 5 small upstream lakes (Lampellonjärvi, Lovonjärvi, Kyynärö, Teuronjärvi, and Takanen) were sampled once in 2003 (late Oct) and 4 times in 2004 (late Mar, early May, late Aug, late Oct). Lake samples were taken from the deepest point of each lake while river samples were taken at outlets (50–100 m downstream), just before the inlets of next lakes, thus representing incoming and outflowing water quality (sites marked a–j in ). In short rivers, samples were collected from one site only. At each site and sampling, dissolved oxygen (DO) concentration and water temperature were measured manually with a YSI ProODO optical dissolved oxygen probe (ysi.com, Yellow Springs, OH, USA) at 1 m intervals (lakes) and in rivers from the surface.
Lakes were sampled 1 m below the surface (i.e., epilimnion) and 1 m above the bottom (i.e., hypolimnion), whereas rivers were sampled only from the uppermost 0.3 m depth to avoid disturbance with sediment. All water samples were taken by a 2 L tube sampler (Limnos) and collected into 20 mL plastic (HD-PE) or glass liquid scintillation vials, which were filled, closed tightly, and stored in a dark and cool (4 °C) environment until analysed within 3–5 days. In addition, we applied long-term δ18O and δ2H results of precipitation collected at local meteorological stations (Pappila during 1998–2003 and Evo station, ∼20 km northward, during 2004–2010). The samples were collected monthly into 1 L HD-PE bottles with a funnel and paraffin oil layer to prevent evaporation. Groundwater was sampled 3 times (May, Jul, and Sep 2004) at the local municipal raw water pumping station.
Isotope analyses
Water samples of 0.5 mL were equilibrated with CO2 at 25 °C for oxygen isotope analysis and 0.3 mL with H2, Pt as catalyst, at 25 °C for hydrogen isotope analysis. Equilibrated gas was introduced online via an interface (Gas Bench II) to a mass spectrometer (ThermoFinnigan DeltaPlus XL, Thermo Scientific, Bremen, Germany) to measure isotope ratios. Analyses were conducted at Laboratory of Chronology, University of Helsinki, Finland.
The δ18O and δ2H values are expressed as δ notation in per mil relative to Vienna Standard Mean Ocean Water (VSMOW) standard:
(1)
(1) where R is a ratio of 18O/16O or 2H/1H for a sample (sa) and a standard (st), respectively.
The laboratory reference samples were normalized on the VSMOW–SLAP scale (Coplen Citation1988). Errors for the δ18O and δ2H values were ±0.15‰ and ±1‰, respectively. Because the number and accuracy of measurements for δ2H values were lower, the main focus of our results is on changes in δ18O values in the lake chain.
Water balance
We estimated water balance in the study region using (1) data for hydrological variables (precipitation, air and water temperature, relative humidity, and discharge) measured in each lake and at the nearest monitoring sites of the study area, and (2) the IMB method using measured δ18O and δ2H values in the study lakes, their inflows, and precipitation.
Hydrological measurements
Data for daily precipitation were obtained from the open database of FMI (https://en.ilmatieteenlaitos.fi/). We use here data from 4 weather stations located ∼5–40 km from the study lakes. Data for catchment runoff (4 stations), discharge (4 stations), and evaporation (pan measurements at 1 station) measured close to the study region during the study years were taken from Hertta open database of Finnish Environment Institute (https://www.syke.fi/avoindata; ). Discharge from each subcatchment to the study lakes was estimated using daily measurements for 2003 and 2004 from rivers Mustajoki (for the 5 small upstream lakes), Teuronjoki (for Ormajärvi, Suolijärvi, Lehee, and Pyhäjärvi), and Vihavuosi (for Iso-Roine), all situated <30 km from the study sites and having land use characteristics and approximate size similar to those of the study lakes. We assumed that the discharge (Qa; m3 s−1) from a subcatchment (CAa) was relative to its surface area compared to the measured values (Qb; m3 s−1) from the nearby respective subcatchment (CAb; i.e., Mustajoki, Teuronjoki, and Vihavuosi discussed earlier):
(2)
(2)
Table 1. Precipitation (average and SD of 4 meteorological stations: Pirttikoski, Pappila, Iso-Evo, Palomaa) in 2003 and 2004; data from open database of Finnish Meteorological Institute (FMI). Runoff from the catchment (average and SD of 4 small brooks and rivers: Valkea-Kotinen, Löytynoja, Mustajoki, Teuronjoki), discharge (average and SD) in 3 rivers (catchment area in brackets) and evaporation (Jun–Sep) measured at Jokioinen FMI station (pan measurements) during the study years. Hydrological data are from https://www.syke.fi/avoindata, an open database of Finnish Environment Institute. All stations are located at 30–90 km from the lake chain.
The calculated Qa accounts for evaporation for subcatchment CAa in similar proportion to that in the measured discharge (Qb) in the river collecting waters from subcatchment CAb because of their similar characteristics (fields, forests and upstream lakes). Total water inflow (I) to each lake during the ice-free period (May–Oct) was estimated by adding the volume of precipitation (P) on the lake surface during the same period:
(3)
(3)
Evaporation (E; mm) from lake surface was calculated with the bulk aerodynamic method using equation by Järvinen and Huttula (Citation1982):
(4)
(4) where V2 is the wind velocity 2 m above ground (m s−1), e0 is the saturation vapor pressure (mb) at lake surface temperature (1 m) and air humidity, and e2 is the prevailing vapor pressure (mb) at 2 m height. Data for wind velocity, air temperature, and humidity were taken from hourly measurements at Jokioinen meteorological station (∼70–80 km southwest of the study area). Because lake water temperature was not intensively measured in the 5 small upstream lakes, we assumed evaporation in these lakes was of similar magnitude and thus used the obtained mean May–October E values for those estimates.
Isotope mass balance (IMB)
The IMB balance model assumes progressive enrichment of heavier isotopes due to evaporation in the waterbodies downstream of the drainage area, the steady state of the lakes, and the evaporation (E) in a lake equaling or exceeding the inflow (I) from the upstream lakes and rivers (Gibson and Reid Citation2014, Skrzypek et al. Citation2015). Thus, we used data collected in both years in October from all 10 lakes and mean values for the ice-free periods (May–Oct), which included δ18O measured 11 times from 5 lakes in 2003 and 2004 (Ormajärvi, Suolijärvi, Lehee, Pyhäjärvi, Iso-Roine) and 3 times from the small headwater lakes in 2004. We used the isotope values for samples from 1 m depth for IMB calculations, although most lakes were stratified in June–September (Supplemental Fig. S1). We assumed that lakes with the position 1–2 in the landscape (Lampellonjärvi, Lovonjärvi, Kyynärö; ) received mainly groundwater. For the inflow to Ormajärvi, Teuronjärvi, and Takanen (position 3 in the lake chain), we used mean isotope values of those with the position 1–2 in the landscape. For Suolijärvi inflow we used the catchment area weighted isotope values of Ormajärvi and Teuronjärvi. For Lehee inflow we used isotope values for the inflow from the lake’s main inflow, Suolijärvi. For Pyhäjärvi we used inflow values from Lehee, and for Iso-Roine we used catchment area weighted values from Pyhäjärvi and Vihavuosi outflows. We used mean δ18O values of rainwater collected at 2 nearby stations () during May–October in 2003 and 2004 for the values of atmospheric moisture. For a comparison we used δ2H and δ18O values of precipitation collected from Espoo (close to the Baltic Sea, ∼115 km south of the study area) for the respective periods from the database of Global Network of Isotopes in Precipitation (GNIP, International Atomic Energy Agency [IAEA]; https://nucleus.iaea.org/wiser/index.aspx). However, because the δ2H and δ18O values of precipitation in Espoo were significantly more enriched than those measured in Lammi (1.6‰ and 12.1‰, paired t-tests p < 0.01 for both, df = 19), we used the values from Lammi for the IMB estimates. For all calculations we used average air temperature and relative humidity (May–Oct) measured hourly at the nearby Lammi Pappila weather station. Evaporation to inflow ratio (E/I) was calculated with Hydrocalculator software (Skrzypek et al. Citation2015):
(5)
(5) where δL is the δ18O value of the studied lake and δP is the respective value of the lake or inflow river above, δ* is the threshold of limiting isotopic composition, and m is the enrichment slope. The latter 2 parameters were calculated by Hydrocalculator (Supplemental Tables S2, S3). Local evaporation line (LEL) was calculated from the regression slope of δ2H and δ18O values of the intensively studied 5 lakes (1 m) during both ice-free seasons. We also tried step-by-step calculation of E/I using biweekly obtained δ18O values from the 5 lakes, but these yielded unrealistic estimates, presumably because of the uncertainty of ambient air moisture δ18O values based of rain water during the same period (data not shown).
For the warm and dry summer period from June to August 2003 we also applied the non-steady state model:
(6)
(6) where f is the evaporative loss fraction of the lake volume, δLa is the δ18O value on 18 August, and δLj the value on 16 June, and the parameters δ* and m are as in equation 4.
Other limnological parameters
Schmidt stability (S) of the water column (J m−2) in the lakes (Schmidt Citation1928, Idso Citation1973) was calculated with the equation presented by Korhonen (Citation2002):
(7)
(7) integrated from lake surface to bottom (0 to h), where A0 is the lake surface area; A is lake area at the depth z; g is acceleration due to gravity; zg is the depth of geometric gravity point of the lake; ρ0 and ρ are water densities at lake surface and at the depth z, based on temperature profiles; and dz is total depth of the water column.
The hydraulic residence time of each lake was estimated by dividing lake volume by annual surface water inflow (cf. equation 3). For stratified lakes, residence time was also estimated from epilimnetic volume, based on the vertical distribution pattern of water temperature and dissolved oxygen showing the depth layer of the greatest difference of these within 1 m distance.
Results
Hydrological conditions
The study period until late autumn 2003 was exceptionally dry from a drought that began during summer 2002 (precipitation ∼80% of the long-term average). Because of the low precipitation, the groundwater table was exceptionally low during 2003 (data not shown; see https://www.syke.fi/avoindata). During the first study year in 2003, summer (Jun–Aug) mean air temperature at Lammi Biological Station was 15.6 °C and in 2004 was 14.4 °C; maximum air temperature was 30.7 and 27.6 °C, respectively. Correspondingly, in July 2003 mean air temperature was 19.6 °C and relative humidity (Rh) 77.2%, and a year later the values were 15.7 °C and 82.4%. In agreement with the Rh values, June–July precipitation was 3 times higher in 2004 than in 2003 (i.e., 326 and 107 mm; ). In 2003, total precipitation in the study area was 596 mm but during the following year was ∼30% higher (average of 4 FMI stations; ). Respectively, river discharge values were twice as high in 2004 than in 2003. For example, in River Mustajoki, a nearby small river with an online hydrological station, annual average runoff in 2004 was the second highest since the onset of the 1971 measurements. A similar increase in discharge took place in River Vihavuosi, the largest inflow to Lake Iso-Roine (, ).
The differences in the weather and lake morphology affected the stability of water columns of the study lakes (Supplemental Fig. S1, Supplemental Table S4). In 2003, maximum water temperature at 1 m depth varied between 22.4 and 24.5 °C, whereas in 2004 the range was between 19.6 and 20.5 °C. In Lake Lehee, water column stability was low during both years. In other intensive study lakes, water column stability from early June to the end of August was 45–76% lower in 2004 than in 2003.
Seasonal and interannual variation in δ2H and δ18O
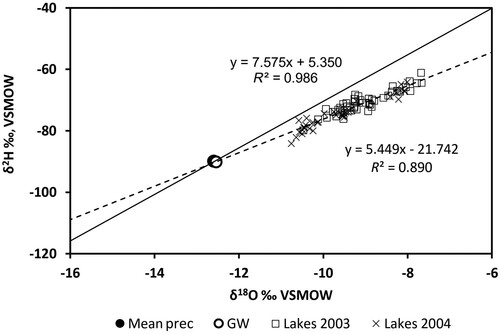
Annual long-term mean stable isotope mass ratios in precipitation, δ2H = −89.8‰ and δ18O = −12.6‰, were close to those measured in groundwater in 2004 (−92.2‰ and −12.5‰, respectively). During the 2 successive years, the δ2H and δ18O isotope values of precipitation followed a similar seasonal pattern, although in 2003 values were slightly lower than in 2004 (, Supplemental Table S5). Seasonally, lower values were recorded in winter than in summer, as seen in the long-term (1981–2010) data. Local meteoric water line (LMWL y = 7.575x + 5.350; c.f. Rozanski et al. Citation1993, Putman et al. Citation2019) is based on the linear relationship between δ2H and δ18O isotope values in this long-term dataset, together with the values for precipitation collected from Espoo during the same period (, Supplemental Fig. S2). The slope of the LEL was 5.45 based on isotope mass ratios of δ2H and δ18O in the 5 intensively studied lakes during both years (Supplemental Fig. S3).
Figure 3. Oxygen isotope ratio (δ18O‰) in precipitation (average with range) collected monthly at Pappila (1998–2003) and Evo (2004–2010) FMI meteorological stations. The distance between stations is 19 km. The values for the study years are marked as open triangles (2003) and black dots (2004).
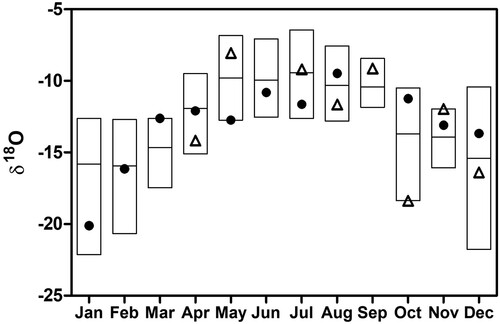
Figure 4. Local meteoric water line (straight line) is based on δ2H and δ18O measurements of precipitation collected monthly at Pappila (1998–2003) and Evo (2004–2010) meteorological stations as well as from Espoo, Finland (GNIP database; Supplemental Fig. S2). Local evaporation line (hatched line) is based on epilimnetic values of intensive study lakes during both study years. Mean δ2H and δ18O values for precipitation (Mean prec) during 1998–2010 and groundwater (GW) measured at one site in 2004 (n = 3) are also shown (overlapping dot and circle). VSMOW = Vienna Standard Mean Ocean Water.
The δ18O and δ2H values in the uppermost headwater lakes were closer to those in precipitation and groundwater than values from lakes lower in the chain (Supplemental Table S5). Except for Lake Suolijärvi, the δ18O and δ2H values gradually enriched during both study years along the lake chain. The most enriched δ18O and δ2H values were measured at the Alvettulanjoki River sampling site (), which also received water from the Hauhonselkä catchment area (1585 km2). At this site, δ18O was 2.4–3.1‰ and δ2H 13.8–19.9‰ more enriched than those in the epilimnion of the lakes with the position 1–2 in the chain.
In the lakes, seasonal variation in the isotope values was greater in 2003 than in 2004 (, Supplemental Table S5). In 2003, the epilimnetic δ18O values in the 5 intensively studied lakes started to increase during the summer season and resulted in a clear deviation (0.5–1‰) relative to those in the hypolimnion. The only exception was the polymictic and shallow Lake Lehee, where the whole water column was homogeneous. The enrichment of the δ18O values in the epilimnion was linear from early June to late August. In summer 2004, the epilimnetic isotope values did not increase in the study lakes except in Lake Suolijärvi, where the values slightly increased, separating them from the hypolimnion. At the time of complete autumnal mixing, the difference in isotope values between the epilimnion and hypolimnion vanished in all lakes.
Figure 5. Time series of the δ18O values (‰) at 1 m depth and 1 m above bottom of 5 study lakes from March 2003 to November 2004. Circled dots denote samples taken under ice.
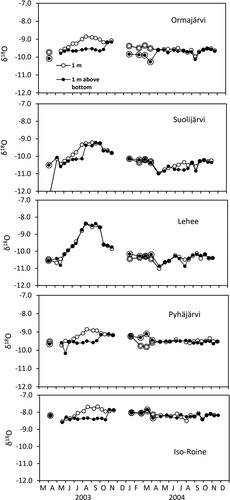
In winter, beneath the ice cover, the δ18O isotope values in Ormajärvi 0.3–0.5‰ were lower close the bottom than at 1 m depth (both years), whereas in Pyhäjärvi more enriched values were found close the bottom during winter 2004. In the other intensive study lakes, no clear difference was found between the 2 layers during winter. The only exception was a low value (12.4‰) measured on 4 April 2003 in Lake Suolijärvi when snowmelt and rainwater accumulated on the ice surface, presumably contaminating the water sampled from 1 m depth.
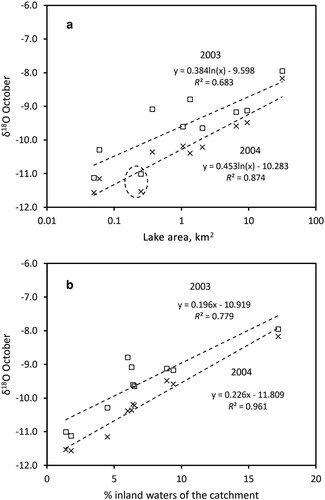
The epilimnetic δ18O values measured in October during both study years were strongly correlated with lake area, proportion of inland waters in the catchment area and total cumulative catchment area, and lake position in the landscape, all intercorrelated variables (, Supplemental Table S6). During both study years, the δ18O enrichment in the lake chain followed the same pattern, but during the wet year (2004) the values were ∼1‰ lower, and the intercept of the regression lines of the 2 years is significantly different (ANCOVA, t = 4.044, p < 0.001, df = 19).
Figure 6. δ18O values (‰) of epilimnetic waters in all 10 study lakes in October 2003 and 2004, related to (a) lake area and (b) proportion of inland waters of the catchment, including the lake itself. The intercepts of the regression lines differ significantly (ANCOVA, p < 0.05). The circled values in (a) refer to Lake Kyynärö, which is presumably more influenced by groundwaters than the other lakes.
Water balance
The interannual differences in precipitation and temperature were reflected in water balances of the study lakes (). During the 2004 rainy year, the water inflow to the lakes was >2 times higher than during the previous year. Evaporation (E) from lake surfaces during May–October 2003, calculated with bulk aerodynamic method, varied between 2.6 and 3.0 mm d−1 (sum 505–544 mm), ∼30% higher than precipitation during the same period (). The average lake evaporation was 24% higher in 2003 than during the open-water season of the following year (2.2–2.4 mm d−1) when precipitation exceeded evaporation. A similar interannual difference was observed at Jokioinen, where the Finnish Meteorological Institute conducts pan measurements (; data only for Jun–Sep). The estimated theoretical residence time of the study lakes was highly variable, ranging from ∼0.08 yr in Lake Lehee in 2003 to 10 yr in Lake Ormajärvi (Supplemental Table S6). When considering only epilimnetic volume in thermally stratified lakes, the residence times were much shorter (1.9–3.6 yr) than the theoretical estimates. During the 2004 rainy year, the residence times were about one-third lower than during the previous year and had similar between-lake variation.
Table 2. Lake area (LA), catchment area (CA), position in the landscape (Po), and inflow (I) estimated on catchment area-related inflow measurements of respective size catchments (equations 2–3), evaporation from lake surface (E) based on bulk aerodynamic calculations (equation 4) from May to October in 2003 and 2004. Whole lake evaporation estimates for the 5 small upstream lakes* used average E estimates (2.8 and 2.3 mm d−1 for 2003 and 2004, respectively) of the 5 intensively studied lakes. mm = 0.001 m3 m−2, nd = no data.
During May–October 2003, the ratio of evaporation to surface waterflow (E/I), estimated with bulk aerodynamic calculations and catchment area ratios, varied between 0.03 and 0.43 in the study lakes, whereas the IMB estimates varied between 0 and 0.16, and even negative estimates were obtained for lakes Suolijärvi and Iso-Roine (). For the respective period in 2004, the E/I estimates with the different methods were much closer and correlated with each other (Supplemental Fig. S4), varying between 0.01 and 0.16. The IMB estimates based on mean May–October δ18O values were close or identical to those based only on October values. The E/I estimates adjusted with LEL were ∼1–7% lower than those without the adjustment.
Table 3. Evaporation to inflow ratio estimates for the lakes during open water seasons (May–Oct 2003 and 2004) based on bulk aerodynamic (B) calculations and catchment area (CA) related inflow (). Respective isotope mass balance results estimated using δ18O values of the samples taken in October and mean values at 1 m depth during May–October, calculated with Hydrocalculator without and with local evaporation line (LEL) adjustment (see equation 5 and Skrzypek et al. Citation2015).
During the dry and warm period from 16 June to 18 October, the δ18O values at 1 m depth in the 5 intensively studied lakes increased linearly (Supplemental Fig. S5). The slopes of the regression lines for this period were similar in the 3 largest lakes, indicating a 0.009‰ daily increase, whereas a greater enrichment occurred in the smaller lakes Lehee and Suolijärvi (0.024‰ and 0.014‰, respectively). The evaporative loss from these lakes was estimated to vary 2–16% (fraction 0.02–0.16) of the lake average volume (). For the large lakes (Ormajärvi, Pyhäjärvi, and Iso-Roine), the difference between the estimates based on bulk aearodynamical calculation and average volume and those with IMB non-steady state method was 1–2%, but for the smallest lake (Lehee) the difference was 5–7%.
Table 4. Evaporated fraction of water volume (f) in 5 lakes from 16 June to 18 August 2003 (Supplemental Fig. S5) estimated with different methods: (1) evaporation loss (E) estimated by bulk aerodynamic calculations (equation 4) and divided by lake average volumes (E/mean volume); (2) Lake Iso-Roine water level change-based estimate is also given (Water-level based) (data from Hertta database, https://www.syke.fi/avoindata, no data (nd) available for the other lakes); (3) isotope mass balance method (IMB no LEL adj) (IMB, see equation 6 in methods), and (4) with local evaporation line (LEL) adjustment (IMB LEL adj) (see Skrzypek et al. Citation2015).
Discussion
Our study was conducted in a boreal landscape characterized by a high number of small- and medium-sized lakes (cf. Verpoorter et al. Citation2014) connected by streams and rivers to larger lakes downstream. Our results showed a rather high between-lake and within-lake variability of δ2H and δ18O values in a small geographical area. In the small headwater lakes, δ2H and δ18O values are closer to those in rain and groundwater, whereas in downstream lakes the enrichment of heavier isotopes occurs because of evaporation both at the lake surface and in the catchment (cf. Gibson and Edwards Citation2002, Gibson and Reid Citation2014). This finding is clearly seen in the epilimnetic δ18O values of the 10 study lakes measured in October after autumnal mixing, which were strongly related to lake surface area and proportion of inland waters of the catchment and showed ∼1‰ interannual difference between the dry and wet year ().
In addition to precipitation and runoff, hydraulic residence time of water both at the drainage basin and lake scale plays an important role for seasonal and interannual differences in isotope signatures of the lakes (Haig et al. Citation2021). Jonsson et al. (Citation2009) showed that in small (area <1 km2) sub-Arctic lakes, seasonal variation in the isotopic composition of water can be clearly observed in lakes with short residence times (<6 months), whereas lakes with a longer residence time retain an isotopic signal closer to that of annual mean precipitation. Similarly, in our study lakes the greatest seasonal variation in δ2H and δ18O values occurred in the 2 smaller lakes (Lehee and Suolijärvi, area 1 and 2 km2, respectively), with residence times <6 months. However, the impact of evaporation for seasonal isotopic variation was evident also in our largest lakes (area 6.5–31.5 km2) with longer residence times in summer 2003, when evaporation exceeded precipitation. In boreal lakes, the role of evaporation is more distinct than that observed in sub-Arctic lakes, in which the seasonal variation in δ2H and δ18O of lake waters is mainly influenced by winter precipitation (spring thaw) and summer precipitation (Jonsson et al. Citation2009). The evaporation estimates with bulk aerodynamic method in our study lakes (405–544 mm during May–Oct) were close to those obtained by Hyvärinen et al. (Citation1995) and Stenberg (Citation2007) for Lake Pääjärvi, a deep mesotrophic lake close to our study area (see review by Strachan et al. Citation2016 for comparison).
Although we did not have direct hydrological measurements in the lake chain, we could indirectly estimate water balances using discharge, precipitation, relative humidity, and temperature measurements in the nearby region and using IMB calculations. Ideally, IMB estimates are based on data of δ2H and δ18O values of all water sources and their progressive enrichment in steady state conditions due to evaporation downstream the landscape (Gibson et al. Citation2010, Gibson and Reid Citation2014). However, data for all water sources are not always available, and steady-state conditions do not always prevail, causing uncertainties in the results, especially during the warm and rather dry ice-free period (May–Oct) 2003, showing variable E/I estimates for the lakes. The IMB steady-state model produced unrealistic negative estimates for 2 lakes, although both evaporation at the lake surfaces and at least minor inflow occurred. During the warm and dry period when the lakes were strongly stratified from mid-June to mid-August 2003, however, the IMB nonsteady state model yielded similar results for the fraction evaporated volume of water from 5 lakes, especially the large lakes (Ormajärvi, Pyhäjärvi, Iso-Roine), compared with those obtained by using bulk aerodynamic evaporation estimation and water-level decrease (Iso-Roine) versus lake volume. Because the exact initial water volume in the lakes in June is not known and assumed as an average volume, the obtained results with different methods surprisingly support each other.
During the 2004 ice-free season, when evaporation was lower and precipitation higher than during the previous year, the E/I estimates based on bulk aerodynamic E and CA based inflow calculations and the ratio obtained by IMB steady-state method were closer each other; these independent results were strongly correlated. Interestingly, the IMB results using mean 1 m values for May–October and those sampled after water column mixing in October were similar and strongly correlated. Thus, in future water balance studies, sampling only in autumn (c.f. Bennett et al. Citation2008) may save effort and resources, although more detailed information, such as linear evaporative loss during June–August 2003, is then missed.
The IMB approach has proved useful for water balance estimations, especially in remote areas where direct hydrological measurements are infrequent or sparse, or even unavailable (e.g., Gibson and Edwards Citation2002, Bennett et al. Citation2008, Shi et al. Citation2017, Yapiyev et al. Citation2020). The greatest uncertainties in IMB estimates are in the highly sensitive calculations for isotopic values of ambient atmospheric moisture (Skrzypek et al. Citation2015). For this, we used average values (May–Oct) of δ2H and δ18O of precipitation in the study area. The observed strong seasonal variation in these values is a typical feature in northern Europe (Kortelainen and Karhu Citation2004, Gourcy et al. Citation2005, Jonsson et al. Citation2009), and therefore the E/I estimates based on stepwise interpolation of data collected every 2 weeks produced unrealistic estimates (data not shown). Bennett et al. (Citation2008) proposed an adjustment factor to better estimate the isotope signature of ambient air moisture based on local precipitation and LEL, which Skrzypek et al. (Citation2015) included in the Hydrocalculator software. In our study lakes, the E/I ratios calculated without this adjustment were closer to those obtained by bulk aerodynamic E- and CA-based E/I ratio, but we are unable to evaluate which values are closer to reality. The LEL slope in the study lakes (5.45) is typical of the lakes in a seasonal climate (Gibson et al. Citation2008).
Groundwater δ2H and δ18O values at our study area varied between −82.3–99.9‰ and 11.6–13.4‰, respectively, in line with those observed in southern Finland (Kortelainen and Karhu Citation2004). During winter, the effect of groundwater inflow is visible in many lakes, as indicated by holes in the ice near the shoreline (LA, pers. observ.). In Lake Pyhäjärvi, the lower δ18O values at 1 m depth than close to the bottom in winter may indicate groundwater inflow. Midwinter under ice δ18O values in Lake Ormajärvi also were lower close to the bottom than at the surface, suggesting warmer groundwater flow into the lake. In addition, higher evaporation to surface water inflow ratio (E/I) in Lake Ormajärvi than in the 2 large lakes (Pyhäjärvi and Iso-Roine), which had similar daily enrichment (0.009‰) of the δ18O values during the dry period in 2003, suggests that, especially in Lake Ormajärvi, our water budget estimates did not include all water inputs, although long residence time presumably influenced the results. Lake Kyynärö (outliers in a) with low δ18O values locates at the subcatchment of Lake Ormajärvi, and in both lakes groundwater presumably originates from the nearby esker. In addition, the higher isotope values in Lake Ormajärvi than in the next downstream lake (Suolijärvi) suggest additional groundwater inflow into this lake. In a boreal esker landscape (Rokua, northern Finland, area 90 km2) with more intensive measurements of δ2H and δ18O in groundwater, streams, and lakes, Isokangas et al. (Citation2015) estimated the proportion of groundwater in the total water inflow to the lakes to vary between 39% and 98%. However, the application of the same method in our boreal lake chain in a much larger and complex drainage area did not yield realistic estimates, presumably because our measurements were from the deepest points of the lakes, and many groundwater release areas are unknown. Water in seepage lakes fed by groundwater is typically clear and oligotrophic, but groundwater flow from peatland areas can also contribute to nutrient and organic carbon loading to lakes and rivers (Ala-aho et al. Citation2013, Palviainen et al. Citation2021). In our study area, the importance of groundwater flow in the whole water mass transport is presumably much lower than in Rokua esker area (c.f. Arvola et al. Citation2015).
In conclusion, the knowledge of water origin and mass transport are crucial for management operations in lakes and their catchments. Because of intensifying land use and climate change with warmer winters and shortening ice-cover period (cf. Veijalainen et al. Citation2012, Ahopelto et al. Citation2019), water protection by reducing external loading from the watershed (e.g., from agriculture and forestry) is crucial. Hydrological conditions and pathways play significant roles for loading, transport, and retention of key elements (carbon, nitrogen, and phosphorus) and their metabolic processing in different subsystems within a drainage basin. Measurements of water stable isotope values provide tools for these estimates, but the results are not always unambiguous and sensitive for air moisture data. Our study suggests that, in addition to surface water runoff measurements, more geohydrological studies should be conducted to estimate groundwater flow to lakes. The data for this study were collected during years when the lakes were ice-covered and when summer drought and heavy precipitation periods differed from long-term average conditions. Thus, these results can provide valuable background reference information for future studies in warming climate and a shortening ice-cover period in the boreal landscape.
Supplemental Material - Figure S1
Download JPEG Image (916.1 KB)
Supplemental Material - Figure S2
Download JPEG Image (902.4 KB)
Supplemental Material - Figure S3
Download JPEG Image (1,000.1 KB)
Supplemental Material - Figure S4
Download JPEG Image (869.6 KB)
Supplemental Material - Figure S5
Download JPEG Image (862.8 KB)
Supplemental Material - Table S1
Download MS Word (16.7 KB)Supplemental Material - Table S2
Download MS Word (15.9 KB)Supplemental Material - Table S3
Download MS Word (15.9 KB)Supplemental Material - Table S4
Download MS Word (13.3 KB)Supplemental Material - Table S5
Download MS Word (22.2 KB)Supplemental Material - Table S6
Download MS Word (14.3 KB)Acknowledgements
We thank Riitta Ilola and Jaakko Vainionpää, the laboratory technicians, and other staff members who helped us in the field and laboratory of Lammi Biologial Station, as well as the Chronology laboratory, University of Helsinki, for the facilities and support.
Disclosure statement
The authors declare that they have no known competing financial interests or personal relationships that could have appeared to influence the work reported in this paper.
Additional information
Funding
References
- Ahopelto L, Veijalainen N, Guillaume JHA, Keskinen M, Marttunen M, Varis O. 2019. Can there be water scarcity with abundance of water? Analyzing water stress during a severe drought in Finland. Sustainability. 11(6):1548.
- Ala-aho P, Rossi PM, Kløve B. 2013. Interaction of esker groundwater with headwater lakes and streams. J Hydrol. 500:144–156.
- Arvola L, Einola E, Järvinen M. 2015. Landscape properties and precipitation as determinants for high summer nitrogen load from boreal catchments. Landsc Ecol. 30:429–442.
- Bennett KE, Gibson JJ, McEachern PM. 2008. Water-yield estimates for critical loadings assessment: comparisons of gauging methods versus an isotopic approach. Can J Fish Aquat Sci. 65:83–99.
- Braig E, Welzl G, Stichler W, Raeder U, Melzer A. 2010. Entrainment, annual circulation and groundwater inflow in a chain of lakes as inferred by stable 18O isotopic signatures in the water column. J Limnol. 69(2):278–286.
- Coplen TB. 1988. Normalization of oxygen and hydrogen isotope data. Chem Geol. 72:293–297.
- Craig H, Gordon LI. 1965. Deuterium and oxygen 18 variations in the ocean and the marine atmosphere. In: Ongiorgi E, editor. Stable isotopes in oceanographic studies and paleotemperatures. Pisa (Italy): Laboratorio di Geologia Nucleare; p. 9–130.
- Fellman JB, Dogramaci S, Skrzypek G, Dodson W, Grierson PF. 2011. Hydrologic control of dissolved organic matter biogeochemistry in pools of a subtropical dryland river. Water Resour Res. 47:W06501.
- Gat JR, Bowser CJ, Kendall C. 1994. The contribution of evaporation from the Great Lakes to the continental atmosphere: estimate based on stable isotope data. Geophys Res Lett. 21:557–560.
- Gibson JJ. 2002. Short-term evaporation and water budget comparisons in shallow Arctic lakes using non-steady isotope mass balance. J Hydrol. 264:242–261.
- Gibson JJ, Birks SJ, Edwards WD. 2008. Global prediction of δA and δ2H-δ18O evaporation slopes for lakes and soil water accounting for seasonality. Global Biogeochem Cycles. 22:GB2031.
- Gibson JJ, Birks JS, Jeffries DS, Kumar S, Scott KA, Aherne J, Shaw DP. 2010. Site-specific estimates of water yield applied in regional acid sensitivity surveys across western Canada. J Limnol. 69:67–76.
- Gibson JJ, Birks SJ, Yi Y. 2016. Stable isotope mass balance of lakes: a contemporary perspective. Quat Sci Rev. 131:316–328.
- Gibson JJ, Edwards TWD. 2002. Regional water balance trends and evaporation–transpiration partitioning from a stable isotope survey of lakes in northern Canada. Global Biogeochem Cycles. 16(2):1026.
- Gibson JJ, Reid R. 2014. Water balance along a chain of tundra lakes: a 20-year isotopic perspective. J Hydrol. 519:2148–2164.
- Gourcy LL, Gröning M, Aggarwal P. 2005. Stable oxygen and hydrogen isotopes in precipitation. In: Aggarwal PA, Gat JR, Froehlich KFO, editors. Isotopes in the water cycle: past, present and future of a developing science. Dordrecht (Netherlands): Springer; p. 39–51.
- Haig HA, Hayes NM, Simpson GL, Yi Y, Wissel B, Hodder KR, Leavitt RR. 2021. Effects of seasonal and interannual variability in water isotoopes (δ2H, δ18O) on estimates of water balance in a chain of seven prairie lakes. J Hydrol X 100069.
- Halder J, Decrouy L, Vennemann TW. 2013. Mixing of Rhône River water in Lake Geneva (Switzerland–France) inferred from stable hydrogen and oxygen isotope profiles. J Hydrol. 477:152–164.
- Horita J, Rozanski K, Cohen S. 2008. Isotope effects in the evaporation of water: a status report of the Craig–Gordon model. Isot Environ Health Stud. 44:23–49.
- Horita J, Wesolowski DJ. 1994. Liquid-vapor fractionation of oxygen and hydrogen isotopes of water from the freezing to the critical temperature. Geochim Cosmochim Acta. 58:3425–3437.
- Hyvärinen V, Solantie R, Aitamurto A, Drebs A. 1995. Suomen vesitase 1961-1990 valuma-alueittain [Water balance in Finnish drainage basins during 1961–1990]. Vesi- ja ympäristöhallinnon julkaisuja – sarja A, 220. Helsinki, Vesi- ja ympäristöhallitus. [Publications of Water and Environment — series A 220]; p. 1–68. Finnish.
- Idso SB. 1973. On the concept of lake stability. Limnol Oceanogr. 18:681–683.
- Isokangas E, Rozanski K, Rossi PM, Ronkanen A-K, Kløve B. 2015. Quantifying groundwater dependence of a sub-polar lake cluster in Finland using an isotope mass balance approach. Hydrol Earth Syst Sci. 19:1247–1262.
- Järvinen J, Huttula T. 1982. Estimation of lake evaporation by using different aerodynamical equations. Geophysica. 19:87–99.
- Jonsson CE, Leng MJ, Rosqvist GC, Seibert J, Arrowsmith C. 2009. Stable oxygen and hydrogen isotopes in sub-Arctic lake waters from northern Sweden. J Hydrol. 376:143–151.
- Jylhä K, Laapas M, Ruosteenoja K, Arvola L, Drebs A, Kersalo J, Saku S, Gregow H, Hannula H-R, Pirinen P. 2014. Climate variability and trends in the Valkea-Kotinen region, southern Finland: comparisons between the past, current and projected climate. Boreal Env Res. 19:4–30.
- Korhonen J. 2002. Suomen vesistöjen lämpötilaolot 1900-luvulla [Water temperature conditions of lakes and rivers in Finland during the 20th century]. Suomen ympäristö 566, luonto ja luonnonvarat, Suomen ympäristökeskus, Helsinki, [The Finnish Environment 566]; p. 1–116. Finnish.
- Kortelainen NM, Karhu JA. 2004. Regional and seasonal trends in the oxygen and hydrogen isotope ratios of Finnish groundwaters: a key for mean annual precipitation. J Hydrol. 285:143–157.
- Palviainen M, Peltomaa E, Laurén A, Kinnunen N, Ojala A, Berninger F, Zhu X, Pumpanen J. 2021. Water quality and the biodegradability of dissolved organic carbon in drained boreal peatland under different forest harvesting intensities. Stoten 806.
- Perini M, Gamin F, Corradini F, Obertegger U, Flaim G. 2009. Use of δ18O in the interpretation of hydrological dynamics in lakes. J Limnol. 68:174–182.
- Putman AL, Fiorella RP, Bowen GJ, Cai Z. 2019. A global perspective on local meteoric water lines: meta-analytic insight into fundamental controls and practical constrains. Water Resources Res. 55(3):6896.
- Rozanski K, Araguás-Araguás L, Gonfiantini R. 1993. Isotopic patterns in modern global precipitation. In: Swart PK, Lohmann KC, Mckenzie J, Savin S, editors. Climate change in continental isotopic records. Washington (DC): American Geophysical Union. Geophysical Monograph Series. Vol 78; p. 1–36.
- Schmidt W. 1928. Über temperatur- und stabilitätsverhältnisse von seen [Temperature and stability conditions of lakes]. Geogr Ann. 10:531–540.
- Shi X, Pu T, He Y, Qi C, Zhang G, Xia D. 2017. Variability of stable isotope in lake water and its hydrological processes identification in Mt. Yulong region. Water. 9:711.
- Skrzypek G, Mydłowski A, Dogramaci S, Hedley P, Gibson JJ, Grierson PF. 2015. Estimation of evaporative loss based on the stable isotope composition of water using Hydrocalculator. J Hydrol. 523:781–789.
- Stenberg L. 2007. Lammin Pääjärven ja Lahden Vesijärven vesitase: maankäytön vaikutus valuntaan ja haihduntaan [Water balance of Lake Pääjärvi and Lake Vesijärvi: the impacts of land use on inflow and evaporation]. Civil and Environmental Engineering, Technical University of Helsinki. 85 p. Finnish.
- Stets EG, Winter TC, Rosenberry DO, Striegl RG. 2010. Quantification of surface water and groundwater flows to open- and closed-basin lakes in a headwaters watershed using a descriptive oxygen stable isotope model. Water Resour Res. 46:W03515.
- Strachan IB, Tremblay A, Pelletier L, Tardif S, Turpin C, Nugent KA. 2016. Does the creation of a boreal hydroelectric reservoir result in a net change in evaporation? J Hydrol. 540:886–899.
- Valpola SE, Ojala AEK. 2006. Post-glacial sedimentation rate and patterns in six lakes of the Kokemäenjoki upper watercourse, Finland. Boreal Env Res. 11:195–211.
- Veijalainen N, Korhonen J, Vehviläinen B, Koivusalo H. 2012. Modelling and statistical analysis of catchment water balance and discharge in Finland in 1951–2099 using transient climate scenarios. J Water Climate Change. 3(1):55–78.
- Verpoorter C, Kutser T, Seekell DA, Tranvik LJ. 2014. A global inventory of lakes based on high-resolution satellite imagery. Geophys Res Lett. 41:6396–6402.
- Yapiyev V, Skrzypek G, Verhoef A, Macdonald D, Sagintayev Z. 2020. Between boreal Siberia and arid Central Asia – stable isotope hydrology and water budget of Burabay National Nature Park ecotone (Northern Kazakhstan). J Hydrol: Reg Stud. 27:100644.