
 ?Mathematical formulae have been encoded as MathML and are displayed in this HTML version using MathJax in order to improve their display. Uncheck the box to turn MathJax off. This feature requires Javascript. Click on a formula to zoom.
ABSTRACT
To determine the diversity and connectivity of infections in Northwestern and Southwestern Cameroon, 232 Plasmodium falciparum infections, collected in 2018 from the Ndop Health District (NHD) in the western savannah highlands in the Northwest and the Limbe Health District (LHD) in the coastal lowland forests in the Southwest of Cameroon were genotyped for nine neutral microsatellite markers. Overall infection complexity and genetic diversity was significantly (p < 0.05) lower in NHD than LHD, (Mean MOI = 2.45 vs. 2.97; Fws = 0.42 vs. 0.47; Mean He = 0.84 vs. 0.89, respectively). Multi-locus linkage disequilibrium was generally low but significantly higher in the NHD than LHD population (mean ISA= 0.376 vs 0.093). Consequently, highly related pairs of isolates were observed in NHD (mean IBS = 0.086) compared to those from the LHD (mean IBS = 0.059). Infections from the two regions were mostly unrelated (mean IBS = 0.059), though the overall genetic differentiation across the geographical range was low. Indices of differentiation between the populations were however significant (overall pairwise Fst = 0.048, Jost’s D = 0.133, p < 0.01). Despite the high human migration across the 270km separating the study sites, these results suggest significant restrictions to gene flow against contiguous geospatial transmission of malaria in west Cameroon. Clonal infections in the highland sites could be driven by lower levels of malaria prevalence and seasonal transmission. How these differences in genetic diversity and complexity affect responses to interventions such as drugs will require further investigations from broader community sampling.
1. Introduction
Cameroon is amongst the 10 countries with the highest burden of Plasmodium falciparum malaria in the world [Citation1] with about 60% of all-cause mortality in children under 5 years old being attributed to malaria in 2018 [Citation2]. Although P. falciparum malaria is endemic throughout Cameroon, the country has different geographic and epidemiologic strata that influence distribution of mosquito vectors and transmission intensity [Citation2–4]. Differences in altitude affect malaria transmission [Citation5], with the highlands being mostly hypoendemic as the climate disfavors the development and reproductive fitness of Anopheles mosquitoes [Citation6]. For example, the western highlands of the North West region (NWR) are characterized by a cooler temperate climate that is associated with seasonal malaria transmission while the coastal lowland areas of the South West region (SWR) are characterized by a humid climate associated with high perennial transmission [Citation2,Citation4]. Endemicity differences particularly influence mosquito susceptibility and transmission potential for different malaria parasite genotypes. This may affect the use of interventions such as drugs and insecticides, which in turn could result in differences between parasite populations and the effectiveness of interventions.
The NWR and SWR attract migration from different parts of the country and from other countries including neighboring Nigeria, most especially traders. These regions are highly connected by various transportation networks, probably facilitating the sharing of infections. The SWR especially attracts tourist who come to experience its Atlantic coastal beaches, zoos and mount Cameroon sites. However, the role of human migration and its outcome on parasite population genetic structure and gene flow patterns remains unknown. Additionally, annual rainfall, temperature, topology and vegetation are particularly different between the highland grass field areas of the NWR and the coastal equatorial forest areas of the SWR [Citation4]. It is not known if similar parasite genotypes indeed circulate across this geographical range. A few studies have examined the multiplicity of infection and/or allelic diversity of P. falciparum parasites from the South West by genotyping P. falciparum merozoite surface proteins (MSP1 and MSP2), and glutamine rich protein (GLURP) [Citation7–10]. These studies reported significant differences in genetic diversity driven by altitude even for sites separated by only a few kilometers [Citation8,Citation10].
Indices of genetic diversity and differentiation such as multiplicity of infection (MOI), expected heterozygosity (He) and pairwise relatedness are important predictive markers of intensity of transmission [Citation11], connectivity between parasite populations and for assessing the impact of control interventions. Their measurement can be done by PCR-based genotyping of polymorphic repeats in merozoite surface proteins (MSP1 and MSP2) and glutamate rich protein (GLURP) [Citation12–14]. However, the use of MSP1, MSP2 and GLURP for such a purpose is heavily criticized since these genes are under strong immune selection and may potentially result into a distorted view of population structure and transmission patterns [Citation15]. Other PCR-based genotyping of non-antigenic markers such as neutral microsatellites [Citation15,Citation16] and single nucleotide polymorphisms (SNPs) [Citation17] are now favored for malaria genomic surveillance, necessary to accelerate targeted intervention approaches to break transmission and reduce malaria burden across Africa. With the deployment of SNP genotyping technologies still limited, microsatellite genotyping remains reliable [Citation18] and accessible across the continent. Thus, regions like Cameroon with large areas of hypoendemic malaria transmission, should be applying these approaches to monitor populations and interventions toward local malaria elimination. Here we compared the genetic complexity, differentiation, and gene flow patterns of P. falciparum parasites from western highland grass field in NWR and coastal equatorial forest in the SWR of Cameroon.
2. Material and methods
2.1. Ethical consideration
The University of Buea Faculty of Health Sciences Institutional Review Board and the Delegation of Public Health in the NWR and SWR of Cameroon gave ethical and administrative clearance to conduct this study. Study participants were asked to provide a written informed consent (for adults) or a written informed assent for children between 12 and 17 years, before they were enrolled for any study procedures.
2.2. Description of study sites and population
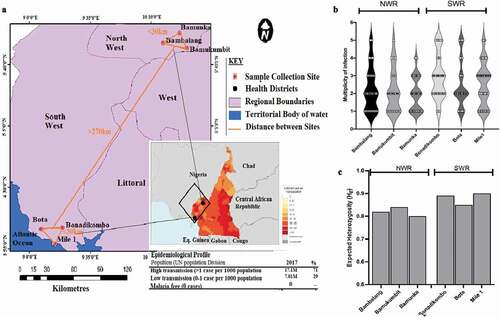
Volunteers with confirmed malaria infections were recruited in the rainy season (March to June) of 2018. These were individuals attending local hospitals and health centers at three sites (Bamunka, Bambalang and Bamukumbit) in the Ndop Health District (NHD) of the NWR and three sites (Bonadikombo, Mile 1 and Bota) in the Limbe Health District (LHD) of the SWR of Cameroon (). Venous blood samples were collected from each infected individual. The NHD is located at a high altitude (~1200 m above sea level) and malaria transmission is seasonal; while the LHD is located at a low altitude (<10 m above sea level) and malaria transmission is intense and perennial (www.mara.org.za). The two districts are separated by a physical distance of about 275 km (). The NHD is characterized by highland grass field vegetation with a cooler temperate climate and average annual rainfall estimated at 1800 mm/year. The LHD on the other hand is characterized by a succession of vegetation, including mangrove, deep equatorial evergreen forest. The climate is warmer than in NHD, with varying annual rainfall that could be up to 4000 mm/year. Recent entomological investigations reported parasite inoculation rates varying from 4.9 to 11 infective bites/person/year in the NHD of the NWR and 14.1 to 100 infective bites/person/year recorded during the rainy season in the coastal LHD of the SWR [Citation19,Citation20]. The dominant malaria parasite species in both the NHD and LHD is P. falciparum transmitted mostly by the Anopheles gambiae s.l [Citation21]. However, A. ziemanni has been reported in NHD; it is an outdoor and indoor biting vector that can sustain malaria transmission [Citation20].
Figure 1. Sampled populations from Limbe Health District (LHD) of the South West Region (SWR) and Ndop Health District (NHD) of the North West Region of Western Cameroon. (a) A zoomed-out map of collection sites from the NHD (Bambalang, Bamukumbit and Bamunka) and LHD (Mile 1, Bota and Bonadikombo). The insert shows the infection density (transmission intensity) from WHO, 2018 malaria report. Each red dot depicts a local hospital used for patient sampling. (b) Distribution of complexity of infection measured by MOI. (c) Distribution of diversity of infection measured by Nei expected heterozygosity index (He) between individual collection sites.
2.3. Microsatellite genotyping
Plasmodium falciparum positive blood samples were confirmed by the variable gene acidic terminal sequences qPCR assay (varATS) [Citation22]. A two-round semi-nested PCR with fluorescent-end-labeled primers of nine neutral microsatellite loci [Citation15,Citation16] was used to genotype each infection. The loci included Polyα (Chr4), TA81(Chr5), PfPk2 (Chr12), ARAII (Chr11), TA87 (Chr6), PfG377 (Chr12), TA40 (Chr10), TA60 (Chr13) and TA109 (Chr6). The second round PCR for each target locus included an internal primer end-labeled with one of the following specific fluorochromes: FAM, HEX PET and VIC. Amplicons of each locus and isolate were then pooled together with GeneScan™ 500 LIZ internal size standard (Applied Biosystems, Foster City, CA) for capillary electrophoresis on an ABI SeqStudio genetic analyzer.
2.4. Alleles scoring from capillary electropherograms
GeneMarker v2.6.3 software (Softgenetics, State College, U.S.A.) was used with the default settings for animal fragment analysis to view peak heights and for sizing fragments from the electropherograms. All peaks with a fluorescence intensity between 100 and 1000 units were called. The fragment with the highest peak corresponded to the major allele while peaks with at least 30% the height of the major allele were considered minor alleles. Allele sizes were normalized against the 3D7 and HB3 control electropherograms to take into account variations in capillary electrophoresis runs [Citation23]. Geneious Prime 2019 software was used to construct fragment size bins for scoring fragments into allelotypes based on the repeat motif length and for determining the number of alleles per locus. A full list of the major alleles scored at all nine microsatellite loci for each of the 232 P. falciparum infections containing either single or multiple genotypes from Cameroon is presented in Additional file: Table S1.
2.5. Within host and population diversity
The complexity within each individual sample was expressed as the multiplicity of infection (MOI), the variant of inbreeding coefficient (Fws) and the standardized multi-locus heterozygosity (sMLH). MOI for a sample was determined as the second highest number of alleles for any locus, as reported previously [Citation24]. Mean MOI for a given population at a locus was calculated by averaging the total MOI for all samples at that locus. A sample was considered monoclonal when only a single allele (fragment peak) was scored for each of the nine microsatellite loci [Citation25]. The Fws index expresses the probability that any random pair of infections carry different alleles at a specific locus. It was calculated for each infection as follows, Fws, where Hw is the infection heterozygosity across all loci and Hs is the heterozygosity of the population from which the infection was sampled. sMLH was calculated from individual (i) multi-locus heterozygosity (MLHi), which is the proportion of loci with more than one allele among the nine microsatellites genotyped:
). The sMLHi for any isolate was determined by dividing MLHi by the average MLH of all other individuals for the set of loci successfully genotyped:
, where n is the number of all other individuals for the specific population.
A haploid dataset comprising only the dominant alleles (major electropherogram peaks) was used to report all further population genetic analysis as previously reported [Citation23,Citation26]. The population level genetic diversity was estimated from the Nei unbiased expected heterozygosity (He) and Linkage disequilibrium (LD) following 1000 permutations using the poppr package in R [Citation27]. Poppr derives the He for each population as, , where n is the number of samples genotyped and Pi is the frequency of any ith allele at a locus for the specific population. He has a potential range from 0 (no allele diversity) to 1 (all sampled alleles are different). Multi-locus LD was calculated within populations as the standard index of association (ISA) [Citation28], to determine if similar multi-locus haplotypes were detected in populations. ISA = (1/n – 1 ((VD/(VE) – 1), where n is the number of loci for which two individuals differ, VE and VD are the expected and observed variance respectively. Values range from 0 (no loci in LD) to 1 (all loci in LD). The Monte Carlo method was used to test for statistical significance.
2.6. Population genetic differentiation, structure and pairwise infection relatedness
Differentiation between malaria parasite populations from different health districts was evaluated using a number of pairwise summary statistics which measure differences in the distribution of within and between population allele frequencies. These included fixation indices (FST) [Citation29,Citation30] and the more recent Jost’s D [Citation31] estimated from Hierfstat [Citation32] and R-mmod [Citation33] packages in R respectively. These indices are close to 0 when there is no genetic differentiation and 1 when two populations are substantially distinct.
To confirm signatures of genetic differentiation with genetic structure, samples from the different collections sites of each health district were evaluated for genetic clustering and inter-relatedness. A distance matrix was constructed and applied to discriminant analysis of principal components (DAPC) using the Adegenet package in R [Citation34]. The likely number of genetic clusters (k) were estimated using entropy analysis of principal components. The first two components accounting for the most variance were plotted to visualize clusters. In addition, the ancestry coefficients for each sample were derived from the SNMF R-package [Citation35] and then clustered and displayed as bar plots using Pophelper R-package [Citation36].
The genetic relatedness between pairs of infections was estimated from a variant of identity by state (IBS) metric computed using a custom R code. The variant of IBS was based on allele sharing incorporating all alleles detected across all nine isolates for each pair of isolates, while correcting for missingness. The overall pairwise infection relatedness for both clonal and complex infections was determined as, , where n is the number of loci genotyped, Si is the total number of shared alleles at locus i between samples X and Y. Xi is the number of alleles in sample X at locus i and Yi is the number of alleles in sample Y at locus i. This was determined for 27,770 pairs of isolates with analyzable genotypes from all sites. IBS values ranged from 0 to 1 and we considered highly related pairs of infection as those with an IBS>0.5, analogous to 50% of shared alleles between the pair of isolates analyzed. Mean IBS was calculated for all pairs of infections from the same and different sites for further visualization as heatmaps.
2.7. Statistical analysis
The association between population diversity indices (MOI, Fws, MLH and He) with demographic variables including gender, age group (less than 5 years and greater than 5 years), parasite density and study site was tested via univariate unconditional logistic regression analysis using GraphPad Prism v8.3. Kruskal-Wallis test and Wilcoxon signed rank test were used to test for statistical significance (at α = 0.05) of differences between population means. The Mentel’s rand test was used to investigate the association between genetic differentiation and geographic distance between sites with significance at α = 0.05.
3. Results
3.1. Clinical and demographic characteristics of study participants
Parasite gDNA was extracted from 289 dried blood spots (DBS) collected from 135 (46.7%) individuals in the three sites of the NHD and from 154 (53.3%) individuals in the three sites of the LHD (). VarATS qPCR confirmed P. falciparum parasites infections in 92% (266/289) of the samples, including 124/135 (91.8%) from NHD and 142/154 (92.2%) from LHD (). Of the 266 P. falciparum positive samples, 232 were successfully genotyped (amplified and fragment scored at > 6 microsatellite loci), 126 were from LHD sites and 106 from NHD sites. A slightly higher proportion of females compared to males was sampled (54% vs. 46%) and the age of the study participants ranged from 1.8 to 14 years in NHD and from 2.6 to 16 years in LHD. No significant difference (p = 0.231 and p = 0.083) was detected for age and sex distribution between the health districts (). The median parasite density was slightly higher but not statistically different for infections from the LHD (median (%) ± SD of parasitemia 6.3 ± 0.11) compared to those from NHD (median (%) ± SD of parasitemia 5.9 ± 0.23). All 232 samples were then taken forward for population genetic analysis.
Table 1. Clinical and demographic characteristics of clinical isolates.
Table 2. Multi-locus linkage disequilibrium of P. falciparum infections from western highlands in the North West region and coastal lowland areas in the South West region of Cameroon.
3.2. Within-host complexity of infections
Most infections were complex (204/232, 80.5%; mean MOI = 2.72), and slightly more multiclonal infections in LHD (83.5%) than NHD (77.1%). The frequency of infections with two genotypes was similar (p = 0.23) between health districts (). However, infections with over three genotypes were more frequent in LHD. Bambalang in NHD and Mile1 in LHD had the highest proportion of infections with MOI>3 (), resulting in a significantly higher mean MOI in LHD (2.92 vs. 2.45, p = 0.019) than NHD (Additional file: Table S2). Further estimation of within host complexity of infection by Fws and standardized multilocus heterozygosity (sMLH) revealed a similar pattern as MOI. Individual infections were more complex in LHD (mean Fws = 0.47, mean sMLH = 1.18) than NHD (mean Fws = 0.42, mean sMLH = 1.12) (Additional file: Figure S3.A and S3.B). The sMLH and Fws were also strongly correlated (goodness of fit R2 = 0.81) (Additional file: Figure S1.C), indicating that either index will be sufficient measure of within-host diversity. Univariate logistic regression analysis of indices of infection complexity (MOI, Fws and sMLH) against population demographic groups revealed no significant (p > 0.05) effect from gender, age and parasite density, although there was a trend of declining parasitemia with decreasing sMLH (Additional file: Figure S1.D)
3.3. Genetic diversity of P. falciparum infections
Plasmodium falciparum infections from both geo-ecological regions were highly polymorphic across all loci. However, allelic richness and heterozygosity were significantly lower for populations from NHD of NWR than those from LHD of SWR (p = 0.008 by Kruskal-Wallis test) ( and Table S2). Allelic richness (Na) ranged from 6 (low) for locus TA109 in Bamunka (NWR) to 21 (high) for locus polyα in Mile 1 (SWR) (Table S2). The high allelic richness was corroborated by high levels of genetic diversity (mean He = 0.87 ± 0.03), mean He ranged from 0.80 for Bamunka to 0.91 for Mile1 () and Table S2), reflecting significant P. falciparum malaria transmission in both regions. The per population allele frequency distribution patterns reflected the differences in diversity for the 2 regions (Additional file: Figure S2). Except for TA60, all other loci had at least one private allele. Polyα, Pk2 and TA81 had up to five private alleles, most of these were detected in samples from Mile1 in SWR (Additional file: Figure S3).
Multilocus LD varied between sites but was generally low (mean ISA = 0.163). This was significant (p < 0.02) for all sites except for Bonadikombo (). ISA was lowest (0.03) in Bonadikombo and highest (0.36) in Bamunka (most significant). LD from sites in NHD were significantly higher (mean ISA = 0.376) than in LHD (mean ISA = 0.093) (). Identical multilocus haplotypes were only detected in the three sites in the NHD, predominantly from Bamunka, where 0.26% (221/85,078) of infections were highly related (IBS ≥ 0.5) ().
Table 3. Pairwise Fst (bottom- half) and Jost’s D (top- half) between P. falciparum infections from western highlands in the North West region and coastal lowlands in the South West region of Cameroon.
3.4. Population structure
Discriminant analysis of principal components with pairwise Nei’s genetic distance matrix between infections did not completely cluster isolates from NHD and LHD into distinct subpopulations. Moreover, a scatterplot of linear discriminant axes 1 and 2 reveals low levels of separation of populations by geo-ecological origins (). Axis 1 accounted for the highest variance between regions. Ancestry analysis revealed most isolates as admixed, most likely originating from two major ancestral populations () based on membership coefficients and k-mean. With k = 2, most parasites had their origin assigned to two major clusters (dark blue or red), with much admixture in the intra-regional populations ( upper panel). Analysis at k = 3 assigned the P. falciparum infections to an additional minor cluster (light blue), predominant in the isolates from Bambalang in NHD ( lower panel).
Figure 2. Population structures and Ancestral origin of P. falciparum infections from two contrasting geo-ecological sites of Cameroon. (a) Scatter plot of discriminant analysis of principal components (DAPC) showing genetic clusters of P. falciparum infections (color-coded by collection site within the two regions) from collection sites. (b) Population clustering based on ancestral origin showing ancestry coefficients and optimum k means (k = 2 and k = 3). k = 2 produced two major population clusters (dark blue and red) while k = 3 produced the two major population clusters of microsatellite haplotypes and a common cluster (light blue). Black borders separate individual populations.
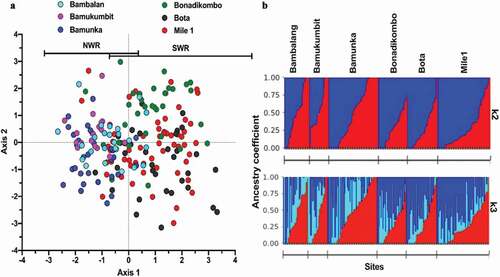
Figure 3. Genetic Relatedness of P. falciparum Infections from western highland areas and coastal lowland areas in Cameroon. (a) Average pairwise population differentiation with genetic and spatial distance between populations. (b) Distribution of p-values from simulated pairwise genetic distance versus physical distance relationships, showing significant correlation. (c) Pairwise Identity by state (IBS) between isolates within and between sites with threshold for relatedness, IBS > 0.5 demarcated by the gray line shown.
Pairwise indices of genetic differentiation between NHD and LHD was low (Fst = 0.023 and Jost’s D = 0.183) but significant (p < 0.01). Values were not significant between populations from sites within the same region but significant between populations from different regions (). Genetic differentiation increased with geographic distance and showed a significant positive correlation (p = 0.045) following the Mantel’s rand test (). The most distant populations were Bamukumbit and Bota (separated by a physical distance of > 270 km) with an Fst value of 0.197 and Jost’s D of 0.442 ().
3.5. Pairwise genetic similarity of P. falciparum infections
Pairwise similarity determined by IBS (a proxy to relatedness) between 27,770 isolate pairs showed generally low levels of relatedness, with an overall average IBS of 0.063. The most related infection pairs were found within populations in NHD (mean IBS = 0.086) while the least related pairs were within the LHD, with an average relatedness of 0.056 (). Relatedness was significantly higher in NHD, where 47 pairs of infections had IBS > 0.5. No pair of isolates from LHD or between LHD and NHD had an IBS > 0.5. The most related isolates were observed in Bamunka in NHD, where infections were least complex while the Mile1 isolates were the least related.
4. Discussions
With malaria elimination on the global agenda, tracking the parasite’s diversity, migratory routes and infection patterns is essential for customizing the implementation of interventions [malERA: Citation37]. This also reduces cost and could increase effectiveness of interventions by targeting the most needed populations. Such an approach will be of relevance to a country like Cameroon, where rich geo-ecological variability affect the distribution of mosquito vectors and consequently result in heterogeneity of malaria transmission dynamics [Citation2–4]. This study used nine neutral microsatellite markers to show differences in genetic complexity and restrictions to unlimited gene flow between P. falciparum isolates from two health districts in different geo-ecological and malaria transmission zones of Cameroon.
Overall, this study showed high parasite genetic diversity with high malaria transmission as genetic diversity of infections were relatively higher in the high transmission sites of the LHD at the Atlantic coast [Citation25]. The mean level of heterozygosity across sites was similar to those reported for several other high transmission sites across Africa: Kenya, He = 0.81–0.84 [Citation38,Citation39], Tanzania, He = 0.83 [Citation40], Senegal and Guinea, He = 0.84–0.89 [Citation23] and Nigeria (He = 0.79) [Citation41]. Differences in transmission intensities, climate and vectors species could be contributing to the small but significant difference in genetic diversity of malaria parasite infections between the NHD and LHD sites, which in turn that could be affecting responses to interventions.
We combined several indices (MOI, sMLH and Fws) to evaluate the level of complexity within infections. These indices were highly correlated, with the most significant correlation being between sMLH and Fws. The variant of the inbreeding coefficient (Fws) used here was based on the frequency of alleles per individual compared to that within the source population, therefore allowing for comparison between populations [Citation42]. In line with previous data, relatively more complex infections were observed from the higher transmission LHD sites, though polyclonal infections were common in all sites. Heterogeneity in infection complexity seen for sites within each health district could be due to discontinuity in spatial malaria transmission especially in NHD, where sites were on average separated by ~10 km. This could also be driven by low transmission in the NHD. The highest number of monoclonal infections were detected in the cosmopolitan semi-urban sites of Bamunka in NHD. With better infrastructure, transmission is low in the town and most infections may have resulted from local outbreaks from small reservoir. This is contrary to importation due to urban migration which results in diverse parasites [Citation43]. The differences in diversity between the health districts was also observed from linkage disequilibrium. The index of association between loci was low as expected for most malaria endemic population in Africa, but it significantly deviated from random allelic association. This significant LD suggest some level of inbreeding arising from self-fertilization or because of high genetic relatedness among isolates, especially in the low transmission sites in NHD (IBS = 0.086, mean ISA = 0.376). LD has been inversely associated with intensity of malaria transmission [Citation23,Citation25]. In areas of high transmission, LD is rapidly broken down due to increased proportion of mixed genotypes, leading to cross-fertilization and meiotic recombination. On the other hand, where transmission is low, the frequency of mixed genotypes decreases, leading to self-fertilization and increased LD and genetic relatedness. Relatedness between pairs of isolates from different health districts was weak, an indication that there is break in connectivity and mixing. There were also lower levels of pairwise relatedness between the LHD coastal cosmopolitan sites, probably a reflection of high rates of transmission and recombination or importation of diverse parasites from neighboring rural areas. The sites in LHD were within 7 km from each other, within the town of Limbe, a popular local tourism destination that could fuel diversity of infection due to importation.
Analysis of differentiation and population structure further suggested limitations to geneflow between health districts. Overall, measures of genetic differentiation between populations from the two regions was significant. Therefore, the human movements between the two regions does not adequately allow for gene flow and harmonization of allele frequencies between the populations. The NHD and LHD sites are separated by over 270 km and because of geo-ecological barriers such as mountains, rivers, and forest; they do not represent a continuous transmission zone. The distribution of vector populations are also different [Citation20,Citation21]. With a maximal flight distance of An. gambiae of approximately 10 km, it is unlikely that the same mosquito vector population could be transmitting parasites between the two regions. This lack of contiguous spatial geneflow was corroborated by moderate genetic clustering of parasites based on geo-ecological origin. This low-level north-south population substructure could affect interventions, as emerging adaptive loci could easily propagate in the absence of recombination. From a similar microsatellite set, malaria parasite populations in Africa had been described as panmictic, with no structure [Citation25]. However, this might be changing as a recent analysis of SNPs across multiple African populations showed clear subpopulations across the East to West axis [Citation44]. An expansion of such analysis using the North to South axis as implemented here could show population structures that would be relevant for strategizing malaria elimination.
5. Conclusion
P. falciparum infections are still highly diverse and complex along the North West and South West geo-ecological range of Cameroon, nonetheless higher in the Coastal lowland areas in SWR. There is sufficient restriction to geneflow along the North-South axis resulting into significant differentiation and substructure that could affect responses to common interventions. Nevertheless, this study is limited by the number of samples collected per site, all of which were recruited from individuals with clinical malaria and high parasite densities. Further deep sampling of more populations along this North-South axis, including asymptomatic infections, will refine the boundaries of gene flow and inform the Cameroon National Malaria Control Programme (NMCP) on local approaches to tackle malaria elimination.
List of abbreviations
| ACT | = | Artemisinin Combination Therapy |
| CMN | = | Cameroon |
| DAPC | = | Discriminant analysis of principal components |
| DBS | = | Dry Blood Spot |
| gDNA | = | Genomic DNA |
| GLURP | = | Glutamate Rich Protein |
| FAM | = | Fluorescein dye |
| HEX | = | Hexa-chloro fluorescent dye |
| LHD | = | Limbe health district |
| MSP | = | Merozoite surface protein |
| NHD | = | Ndop health district |
| NMCP | = | National Malaria Control Program |
| NWR | = | North West Region |
| PCA | = | Principal Component Analysis |
| PCR | = | Polymerase chain reaction |
| PCoA | = | Principal Coordinate Analysis |
| PET | = | PET-fluorescien dye |
| SNP | = | Single nucleotide polymorphism |
| SWR | = | South West Region |
| varATS | = | Variable gene acidic terminal sequence |
Authors’ contributions
NIA, AAN and ADN conceived and designed the experiments; NIA carried out the experiment and produced the first draft of the manuscript; NIA, NIM and AAN performed data analysis; EO and UD read and revised the manuscript. All authors read and approved the final copy of the manuscript.
Acknowledgments
The authors thank the malaria patients for donating blood and the staff of the health facilities at the Ndop and Limbe Health districts of Cameroon who assisted in patient recruitment. We thank Fatou Joof and the MPB team at MRC Unit the Gambia at LSHTM for helpful discussions and advice with data analysis.
Disclosure statement
The authors declare no competing interests.
Additional information
Funding
References
- World Health Organization. World malaria report 2020: 20 years of global progress and challenges. World Health Organization; 2020. License: CC BY-NC-SA 3.0. https://apps.who.int/iris/handle/10665/337660
- Antonio-Nkondjio C, Ndo C, Njiokou F, et al. Review of malaria situation in Cameroon: technical viewpoint on challenges and prospects for disease elimination. Parasit Vectors. 2019;12:501.
- Kwenti TE, Kwenti TDB, Njunda LA, et al. Identification of the Plasmodium species in clinical samples from children residing in five epidemiological strata of malaria in Cameroon. Trop Med Health. 2017;45. DOI:10.1186/s41182-017-0058-5
- Massoda Tonye SG, Kouambeng C, Wounang R, et al. Challenges of DHS and MIS to capture the entire pattern of malaria parasite risk and intervention effects in countries with different ecological zones: the case of Cameroon. Malar J. 2018;17:156.
- Drakeley CJ, Carneiro I, Reyburn H, et al. Altitude-dependent and -independent variations in Plasmodium falciparum prevalence in northeastern Tanzania. J Infect Dis. 2005;191:1589–1598.
- Saugeon C, Baldet T, Akogbeto M, et al. [Will climate and demography have a major impact on malaria in sub-Saharan Africa in the next 20 years?]. Med Tropicale: Revue du Corps de Sante Colonial. 2009;69:203–207.
- Anong DN, Nkuo-Akenji T, Fru-Cho J, et al. Genetic diversity of Plasmodium falciparum in Bolifamba, on the slopes of Mount Cameroon: influence of MSP1 allelic variants on symptomatic malaria and anaemia. Ann Trop Med Parasitol. 2010;104:25–33.
- Apinjoh TO, Tata RB, Anchang-Kimbi JK, et al. Plasmodium falciparum merozoite surface protein 1 block 2 gene polymorphism in field isolates along the slope of mount Cameroon: a cross – sectional study. BMC Infect Dis. 2015;15:309.
- Metoh TN, Chen J-H, Fon-Gah P, et al. Genetic diversity of Plasmodium falciparum and genetic profile in children affected by uncomplicated malaria in Cameroon. Malar J. 2020;19:115.
- Wanji S, Kengne-Ouafo AJ, Eyong EEJ, et al. Genetic diversity of Plasmodium falciparum merozoite surface protein-1 block 2 in sites of contrasting altitudes and malaria endemicities in the Mount Cameroon region. Am J Trop Med Hyg. 2012;86:764–774.
- Arnot D. Unstable malaria in Sudan: the influence of the dry season. Clone multiplicity of Plasmodium falciparum infections in individuals exposed to variable levels of disease transmission. Trans R Soc Trop Med Hyg. 1998;92:580–585.
- Abderrazak SB, Oury B, Lal AA, et al. Plasmodium falciparum: population genetic analysis by multilocus enzyme electrophoresis and other molecular markers. Exp Parasitol. 1999;92:232–238.
- Holder AA. The precursor to major merozoite surface antigens: structure and role in immunity. Progr Aller. 1988;41:72–97.
- Viriyakosol S, Siripoon N, Petcharapirat C, et al. Genotyping of Plasmodium falciparum isolates by the polymerase chain reaction and potential uses in epidemiological studies. Bull World Health Organ. 1995;73:85–95.
- Anderson TJ, Su XZ, Bockarie M, et al. Twelve microsatellite markers for characterization of Plasmodium falciparum from finger-prick blood samples. Parasitology. 1999;119(Pt 2):113–125.
- Su XZ, Wellems TE. Plasmodium falciparum: assignment of microsatellite markers to chromosomes by PFG-PCR. Exp Parasitol. 1999;91:367–369.
- Daniels R, Volkman SK, Milner DA, et al. A general SNP-based molecular barcode for Plasmodium falciparum identification and tracking. Malar J. 2008;7:223.
- Liu Y, Tessema SK, Murphy M, et al. Confirmation of the absence of local transmission and geographic assignment of imported falciparum malaria cases to China using microsatellite panel. Malar J. 2020;19(1):244.
- Amvongo-Adjia N, Wirsiy EL, Riveron JM, et al. Bionomics and vectorial role of anophelines in wetlands along the volcanic chain of Cameroon. Parasit Vectors. 2018;11:471.
- Tabue RN, Nem T, Atangana J, et al. Anopheles ziemanni a locally important malaria vector in Ndop health district, north west region of Cameroon. Parasit Vectors. 2014;7:262.
- Antonio-Nkondjio C, Kerah CH, Simard F, et al. Complexity of the malaria vectorial system in Cameroon: contribution of secondary vectors to malaria transmission. J Med Entomol. 2006;43(6):1215–1221.
- Hofmann N, Mwingira F, Shekalaghe S, et al. Ultra-sensitive detection of plasmodium falciparum by amplification of multi-copy subtelomeric targets. PLoS Med. 2015;12(3):e1001788.
- Mobegi VA, Loua KM, Ahouidi AD, et al. Population genetic structure of Plasmodium falciparum across a region of diverse endemicity in West Africa. Malar J. 2012;11:223.
- Tessema SK, Raman J, Duffy CW, et al. Applying next-generation sequencing to track falciparum malaria in sub-Saharan Africa. Malar J. 2019;18:268.
- Anderson TJ, Haubold B, Williams JT, et al. Microsatellite markers reveal a spectrum of population structures in the malaria parasite Plasmodium falciparum. Mol Biol Evol. 2000;17:1467–1482.
- Khaireh BA, Assefa A, Guessod HH, et al. Population genetics analysis during the elimination process of Plasmodium falciparum in Djibouti. Malar J. 2013;12:201.
- Kamvar ZN, Tabima JF, Grünwald NJ. Poppr: an R package for genetic analysis of populations with clonal, partially clonal, and/or sexual reproduction. PeerJ. PeerJ Inc. 2014;2:e281. .
- Brown AHD, Feldman MW, Nevo E. Multilocus Structure of Natural Populations of HORDEUM SPONTANEUM. Genetics. 1980;96:523–536.
- Weir BS, Cockerham CC. Estimating f-statistics for the analysis of population structure. Evolution. 1984;38:1358–1370.
- Wright S. Genetical structure of populations. Nature. 1950;166:247–249.
- Jost L. GST and its relatives do not measure differentiation. Mol Ecol. 2008;17:4015–4026.
- Goudet J. hierfstat, a package for r to compute and test hierarchical F-statistics. Mole Ecol Notes. 2005;5:184–186.
- Winter DJ. mmod: an R library for the calculation of population differentiation statistics. Mol Ecol Resour. 2012;12:1158–1160.
- Jombart T. adegenet: a R package for the multivariate analysis of genetic markers. Bioinformatics. 2008;24:1403–1405.
- Frichot E, Mathieu F, Trouillon T, et al. Fast and efficient estimation of individual ancestry coefficients. Genetics. 2014;196:973–983.
- Francis RM. pophelper: an R package and web app to analyse and visualize population structure. Mol Ecol Resour. 2017;17:27–32.
- Rabinovich RN, Drakeley C, Djimde AA, et al. malERA: an updated research agenda for malaria elimination and eradication. PLoS Med. 2017;14(11):e1002456.
- Mulenge FM, Hunja CW, Magiri E, et al. Genetic diversity and population structure of plasmodium falciparum in Lake Victoria Islands, a region of intense transmission. Am J Trop Med Hyg. 2016;95:1077–1085.
- Touray AO, Mobegi VA, Wamunyokoli F, et al. Diversity and multiplicity of P. falciparum infections among asymptomatic school children in Mbita, Western Kenya. Sci Rep. Nature Publishing Group. 2020;10:5924. .
- Babiker HA, Lines J, Hill WG, et al. Population structure of Plasmodium falciparum in villages with different malaria endemicity in east Africa. Am J Trop Med Hyg. 1997;56:141–147.
- Oyebola MK, Idowu ET, Nyang H, et al. Microsatellite markers reveal low levels of population sub-structuring of Plasmodium falciparum in southwestern Nigeria. Malar J. 2014;13:493.
- Roh ME, Tessema SK, Murphy M, et al. High genetic diversity of plasmodium falciparum in the low-transmission setting of the Kingdom of Eswatini. J Infect Dis. 2019;220:1346–1354.
- Klinkenberg D, Fraser C, Heesterbeek H. The effectiveness of contact tracing in emerging epidemics. PLoS ONE. 2006;1:e12.
- Amambua-Ngwa A, Amenga-Etego L, Kamau E, et al. Major subpopulations of plasmodium falciparum in sub-Saharan Africa. Science. 2019;365:813–816.