
 ?Mathematical formulae have been encoded as MathML and are displayed in this HTML version using MathJax in order to improve their display. Uncheck the box to turn MathJax off. This feature requires Javascript. Click on a formula to zoom.
Abstract
This work investigates the influence of the hexamethylenetetramine (hexa) content on the rheological features, pyrolysis reactions, mass-loss kinetics and char yield for two phenolic resins, each with different novolak-hexa mixtures from 0 wt.-% to 15 wt.-%. Curing and viscosity of resins was studied using a rheometer. Pyrolysis, evolved gases and char yield were investigated with TG-FTIR-GC/MS. The obtained results show that the curing of resins shifts to lower temperatures whereas the viscosity and the residual carbon amount both increase with increasing hexa-contents. The presented data suggests a hexa-induced microgel formation for phenolic resins. Models for viscosity and char yield were developed and present a valuable tool to tailor the resin-hardener mixture for the desired application, enable a more efficient processing technology and contribute to a deeper understanding of the pyrolysis of novolak resins.
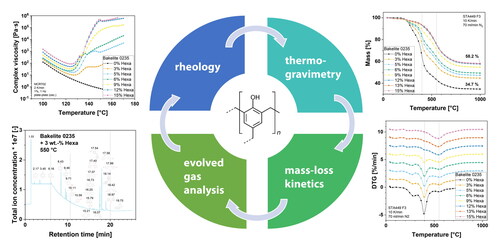
Graphical Abstract
1. Introduction
Although invented more than 100 years ago phenolic resins are still vitally important and the high interest remains greatly unchanged up to this day [Citation1]. Applications of phenolic resins can be found in various fields and industries such as carbon precursor for ceramic matrix composites [Citation2–8], heat ablation materials for reentry vehicles [Citation9–16], binding materials for foundry sands and refractories [Citation17–21], base material for brake-pads [Citation5,Citation22–24] or electrical components [Citation25–27]. Each of the beforementioned applications has different main requirements on the used phenolic resin such as high carbon yield, high thermal stability, low release of hazardous volatile organic compounds (VOC) or low melt viscosity. Many of these properties are dependent on the formulation and cure state of the resin.
Novolak type phenolic resins are produced in acidic-conditions with a phenol (p) to formaldehyde (f) ratio p/f > 1.0 which results in a non self-curable thermoplastic resin. In order to achieve a full cure, these pre-cured resins are then mixed with a formaldehyde donor which acts as a hardener for the resin [Citation28]. The most commonly used hardener for novolak resins is hexamethylenetetramine (hexa). The curing reaction of novolak resins with hexamethylenetetramine is complex and remained not completely understood for a long time.
Intensive studies by Solomon et al. led to a deeper understanding of the curing reactions of novolak resins with hexa [Citation29–38]. The development of model compounds and cross polarization/magic angle spinning nuclear magnetic resonance (CP/MAS NMR) spectroscopy proved that curing of novolaks with hexa is a multi-step reaction. The initial step of the curing reaction is the formation of benzoxazine intermediate structures by the reaction of hexamethylenetetramine with the phenol compounds. The initial hexa amount alters the curing rate and final chemical structure of the fully cross-linked resin. It was proven that throughout the curing reaction various different functional groups such as imine, amide, imide, ether and others may be formed [Citation31]. Furthermore, lower initial hexa contents showed a higher reactivity and lowered the temperature required to form methylene linkages to crosslink the resin. Another finding was, that ammonia gas may be trapped inside the cross-linked resin structure during the reaction of hexa with novolak and that the amount of nitrogen atoms built in the cured resin increases with rising amounts of initial hexa [Citation31].
The role of proposed initial curing intermediate structures can also be interpreted as highly cross-linked microgel islands in the still ungelled novolak melt. It is commonly assumed that the reason for the curing inhomogeneity and the formation of different morphological structures in novolak resins depends on the initial hexa content. The formation of these microgels inside phenolic resins was also investigated with techniques such as rheometry and differential scanning calorimetry [Citation39,Citation40]. Furthermore, small angle X-ray spectroscopy (SAXS) was used to study these microgel islands in more detail [Citation41]. Similarly, curing inhomogenity effects are also known from other thermoset polymers such as epoxy resins [Citation42,Citation43].
An illustration of the principle of a microgel formation during curing of a thermoset polymer is shown in . For the rheological properties of phenolic resins, it is known that ungelled molten novolak resins are Newtonian liquids and that hexa contents as low as 1.10 wt.-% may lead to a gelation of the resin [Citation44]. With increasing hexa contents, parameters such as viscosity, curing reaction rate, and molecular weight of the resin increase [Citation44–46]. The curing time and curing temperature alter the curing reaction [Citation47–49] as well. Secondly, the dependency of the curing reaction of the phenolic resin on the temperature can be described by a classical Arrhenius law equation [Citation39]. For transient temperature viscosity measurements, the viscosity of the molten novolak resin first decreases with increasing temperatures due to a higher mobility of monomers and oligomers in the melt. The propagating curing reaction with the buildup of longer polymer chains lead to the formation of a gel network and ultimately a sharp increase of the viscosity of the resin [Citation39,Citation45,Citation47,Citation50].
Figure 1. Microgel formation in thermoset polymers during curing, adapted from Vidil et al. [Citation43]. The large orange circles indicate the microgel islands in the phenolic resin melt.
![Figure 1. Microgel formation in thermoset polymers during curing, adapted from Vidil et al. [Citation43]. The large orange circles indicate the microgel islands in the phenolic resin melt.](/cms/asset/a323dd55-1e1e-48ff-97ed-7ea217e1a804/yadm_a_2187687_f0001_c.jpg)
Many different aspects of the pyrolytic behavior of phenolic resins to produce carbonaceous materials are documented. Expectable char yields for hexa-cured novolak resins lie in the range of 58% [Citation17] to 65% [Citation51] depending on resin type, cure- and pyrolysis conditions. It is well understood that higher sol fractions and linear chain structures in the resin lead to reduced char yields during pyrolysis [Citation9]. On the other hand, increased cross-linking due to higher hexa contents results in elevated char yields [Citation52,Citation53]. Maximum char yields were obtained with resins containing 10 wt.-% to 15 wt.-% hexa [Citation52].
The main pyrolysis of novolak resins starts at ca. 400 °C and is completed at 700 °C - 800 °C [Citation9,Citation22,Citation51–53]. Raman studies conducted by Ko et al. show the appearance of first carbon structures at 500 °C and the complete disappearance of resin structures at 600 °C [Citation54]. Newer molecular dynamic simulations conducted by Harpale et al. indicate the beginning of pyrolysis at temperatures as low as 220 °C by the formation of water from OH-functional groups and pyrolysis reactions appear to follow an Arrhenius law for the activation energy [Citation55].
Detailed studies of the pyrolysis gases of phenolic resins were conducted by Bouajila et al. [Citation56,Citation57] and were later also confirmed by other researchers [Citation18,Citation22]. Below 100 °C the pyrolysis is characterized by the release of water vapor, ammonia and phenol monomers, which are entrapped in the resin structure during curing [Citation56]. Between 100 °C and 350 °C water vapor and CO2 is released due to post-curing reactions [Citation57]. During the main pyrolysis step, various substances are emitted which include low molecular weight gases such as water vapor, CO, CO2, CH4 and aromatic compounds such as xylene, toluene, phenol and methylated phenols and substances consisting of 2 to 3 phenol rings connected by various different functional groups [Citation18,Citation22,Citation56]. A comprehensive gas-chromatography/mass spectroscopy (GC-MS) analysis of evolved gases can be found in reference [Citation18].
Although many different aspects of phenolic resins were thoroughly studied leading to a deeper understanding of the processing, curing and pyrolysis of novolak resins, most of the conducted studies were focused on one aspect of production and pyrolysis of novolak resins only. The usage of self-synthesized resins and different curing and pyrolysis conditions lead to difficulties in comparing results. Especially the interconnection of different physical and thermal properties such as viscosity, reactivity, thermal stability, mass loss kinetics and pyrolysis reactions was not reported in a complete conductive study yet. Therefore, the objective of this paper lies on the interaction between hexa content, viscosity, curing kinetics, char yield, pyrolysis reactions, pyrolysis kinetics and the release of VOCs by using rheometry, thermogravimetric analysis (TGA) and coupled evolved gas analysis (EGA) with Fourier transformed infra-red spectroscopy (FTIR) and gas-chromatography coupled with mass spectrometry (GC/MS).
2. Materials and experimental
2.1. Resins
Bakelite® PF 0235 DP 02 and Bakelite® PF 6109 FP derivates (supplied by Bakelite Synthetics, Germany) were used as the two model phenolic resins – hereinafter referred to in simplified form as Bakelite 0235 and Bakelite 6109. Bakelite 0235 is a thermoplastic low-molecular weight novolak powder resin without hexa, whereas Bakelite 6109 derivates are based on a low-molecular weight novolak resin, which was mixed with hexamethylenetetramine with varying hexa-contents between 3 wt.-% to 12 wt.-% before it was milled into a powder. Bakelite 0235 mixtures were self-prepared, whereas Bakelite 6109 derivates were kindly provided by Bakelite Synthetics.
Bakelite 0235 was mixed with hexamethylenetetramine powder (supplied by Bakelite Synthetics, Germany) in a 3D shaker mixer (Turbula T2c, Willy A. Bachhofen, Switzerland) using a 1000 mL mixing cup at a speed of 15 rpm. 5 ceramic milling balls ( 25,4 mm, 2,65 g/cm3) were added to prevent agglomeration of powders and enhance the homogeneity of resin-hardener mixtures. The batch size for each mixture was 100 g of resin with the respective amount of hexa. Homogenous mixtures of resin and hardener were achieved after a mixing time of 20 min. Mixing homogeneity was crosschecked with viscosity measurements. For thermogravimetric measurements, all resins were cured at 170 °C for 1 h with a heating rate of 2 K/min in a convection oven. After curing, the resulting resins were milled into fine powders using a vibrating cup mill (Pulverisette 9, Fritsch GmbH, Germany) and a milling time of 60 s. The coarse fraction of particles after the milling step was removed and discarded using a sieve (200 mesh).
2.2. Thermogravimetry and evolved gas analysis (EGA)
For the investigation of carbon residue, mass loss kinetics and evolved pyrolysis gases, a TG-FTIR-GC/MS combination (TG: Netzsch STA449 F3 Jupiter, FTIR: Bruker Alpha II, GC: Agilent 7890B, MS: Jeol JMS Q1500) was used. Thermogravimetric measurements were carried out with a heating rate of 10 K/min in flowing nitrogen (70 mL/min, gas quality 5.0, Riessner Gase, Germany) atmosphere. The data acquisition rate was 100 points per minute and differentiated thermogravimetry (DTG) curves were smoothened using the proprietary Netzsch Proteus software and a smoothing factor of 9. The sample mass for each measurement was between 10 mg to 15 mg of powder in alumina crucibles without a lid. To investigate the composition of evolved gases during pyrolysis, FTIR measurements were carried out quasi-continuously during the pyrolysis of the samples in the thermobalance by direct coupling between the TG and FTIR instrument at the headspace of the balance. Furthermore, GC-MS measurements were performed at specified temperatures as single injections into the GC-column to obtain more detailed information on the pyrolysis gas composition. GC-injection temperatures of 400 °C and 550 °C were based on the analysis of mass loss rate measurements carried out beforehand. Transfer lines and coupling pieces between the thermobalance and GC were heated to 300 °C to prevent the condensation of pyrolysis products. The used GC column type was an Agilent HP5 (length: 30 m, 0.32 mm, film thickness: 0.25 µm). A total column flow of 16.50 mL/min was set using high purity helium (gas quality 5.0, Riessner Gase, Germany) as purging gas. During the measurement, the GC column was heated from 35 °C to 300 °C with a heating rate of 15 K/min and held 5 min at 300 °C. Contamination or degradation of the column was regularly checked between the GC/MS-measurements. Mass spectrometry was performed for m/z ratios from 10 to 500. The MS intensity was calibrated to 1.000.000 counts for m/z of 219 using a perfluorotributylamine (PFTBA) standard. The resulting mass chromatograms were analyzed with the proprietary ‘Escrime’ software to identify chemical substances via a database search.
2.3. Rheometry
The rheological characterization of resins was performed using an AntonPaar MCR 702 rheometer with a Peltier heated plate and hood (P-PTD 200 + H-PTD 200) and disposable parallel plate geometries ( 25.00 mm). 1.5 g of resin-hexa mixture was used for each measurement. Measurements were carried out in oscillation mode with a frequency of 1 Hz and a deformation amplitude of 1%. Two different heating rates (2 K/min and 10 K/min) up to a final temperature of 170 °C were used to investigate the influence of the heating rate on the reactivity of the resins. Prior to the rheological characterization all resins were dried until constant mass in a desiccator. The powder resins were preheated at 100 °C for 5 min to achieve a homogenous melting and stable temperature. A trimming of the samples was carried out at a gap distance of 1.050 mm and the starting measurement gap was set to 1.000 mm. Homogenous pore-free filling of the measurement gap was crosschecked by melting resins and solidifying the melt by cooling without curing the resin. No indication for an inhomogeneous filling of the measurement gap was found. Furthermore, care was taken to keep preheating and trimming times as short and constant as possible to minimize the influence of curing reactions prior to actual measurements. The stability of the resins for the selected preheating temperatures and times was checked with isothermal measurements. Due to normal force controlled measurements and foaming of the resins when reaching the gel point, the measurement gap distance changed during measurements. This effect will be explained in more detail in the results section.
3. Results and discussion
3.1. Viscosity and reactivity of resins
and illustrate the viscosity profile versus temperature for all investigated hexa-resin-systems. What can clearly be seen, is the dependency of viscosity on the temperature for all investigated materials. For Bakelite 0235 without hexa addition, the complex viscosity of the resin gradually decreases as the temperature rises. No indications for curing reactions which would result in an increase of viscosity can be seen in the investigated temperature range. On the other hand, all materials containing hexa as hardener show a different viscosity behavior. First, the complex viscosity decreases as the temperature rises until reaching a minimum point. The temperature at which the minimum viscosity can be observed depends on the hexa content. Higher hexa contents shifted the point of minimum viscosity to lower temperatures. This is an indication for an earlier buildup of a gel network structure. The higher amount of hexa in the resin also led to a smaller median distance between the microgel structures which resulted in a facilitated buildup of a network structure. With a further increase in temperature, the viscosity raised steeply. This indicated a propagating curing reaction with the buildup of a gel network. At temperatures between 125 °C to 140 °C, mixtures with a hexa content more than 3 wt.-% exhibited a buckle in the viscosity curve. In this temperature range extensive foaming of the resins took place due to the emission of gaseous products due to the polycondensation reaction and the simultaneous sharp increase of viscosity as a result of the gel network formation.
Figure 2. Complex viscosity of Bakelite 0235 mixtures from 100 °C to 170 °C.
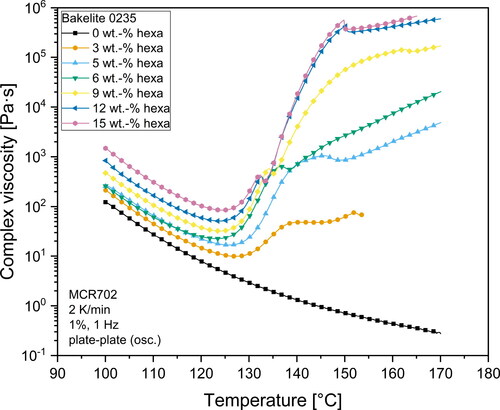
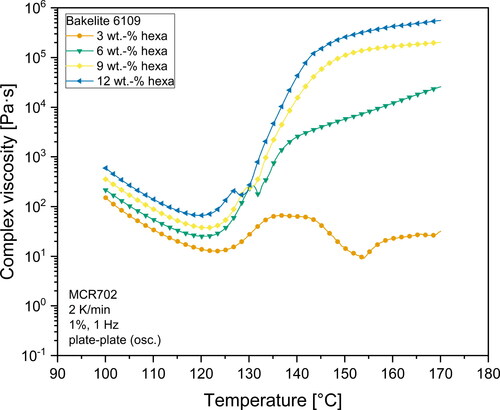
Figure 3. Complex viscosity of Bakelite 6109 mixtures from 100 °C to 170 °C.
Due to a set normal force of 0 N for the rheometer measurements, the gap distance increased to compensate for the foam formation. The change of the gap distance during measurements is illustrated in and . The buckle visible in and is the result of the quick change in gap distance. Due to the formation of a foam in the measurement gap and the overall high variation in gap distance, the values of complex viscosity after the change of gap distance should be handled with utmost care and should only be interpreted qualitatively. Exact values of the viscosity after foaming cannot be obtained due to the inhomogeneous filling of the measurement gap and unknown deformation profile of the sample in the measurement gap. Despite these limitations, it can be seen that all investigated mixtures with hexa contents of more than 3 wt.-% show a steady increase in complex viscosity with increasing hexa contents even after the gel-formation. This behavior likely represents an aggravated deformability of novolak-hexa mixtures. The nearly identical viscosity curve shape of Bakelite 0235 samples with 12 wt.-% and 15 wt.-% hexa after the foam formation as illustrated in points to the formation of a similar polymer structure of these two different samples. The same slope of the curve of the complex viscosity after foaming also means that the curing reaction had propagated with similar reaction kinetics.
Figure 4. Gap distance evolution of Bakelite 0235 mixtures from 100 °C to 170 °C.
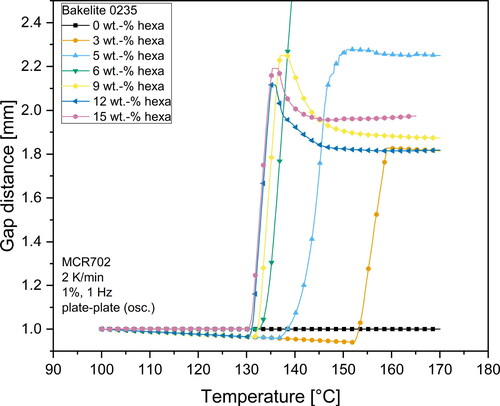
Figure 5. Gap distance evolution of Bakelite 6109 mixtures from 100 °C to 170 °C.
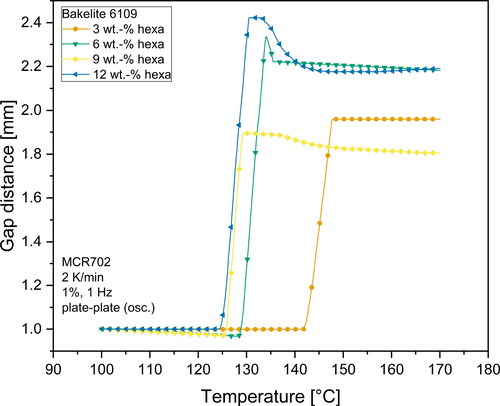
As already mentioned before, the gap distance measurements can be used to detect the foaming onset temperature of samples. Foaming was visible as an increasing gap distance. and illustrate the gap distance variations during the rheometer measurements. All mixtures containing hexa as hardener exhibited a constant or very slight decrease (< 0.050 mm) in gap distance until reaching a distinct temperature at which the gap distance very quickly increased to values of typically > 1.800 mm.
The slight decrease may be attributed to a slightly under-filled measurement gap due to trimming of samples prior to starting the analysis and a slight flowing of resin out of the measurement gap due to reduced viscosity with increasing temperature. Together with normal force controlled experiments this led to a decrease of the measurement gap. The effects of this slight decrease are negligible for the deformation profile and were nevertheless considered when calculating the complex viscosity.
The temperature at which the measurement gap rapidly increased was strongly dependent on the hexa content of the mixtures. In general, higher hexa contents led to a lower foaming temperature. This can be explained by the mechanism of the curing reaction and the solution of hexa inside the phenolic resin melt. An increased amount of hexa resulted in more microgels inside the melt. Due to an increased amount of microgels, the distance between these highly cross-linked microgel regions was decreased. The smaller distance facilitated the buildup of a complete gel network, which caused the decreased foaming temperature. However, and also show that this drop in foaming temperature is not connected to the hexa content in a linear way. Mixtures with contents of more than 9 wt.-% hexa showed nearly identical temperatures at which the gap distance increased. It can be likely attributed to a saturation limit for the nucleation effect of microgels in the melt, which then resulted in nearly identical start temperatures for the foam formation. Consequently, it is very likely that mixtures with high hexa content (> 9 wt.-%) resulted in vastly cross-linked polymers with a similar structure. When comparing the two different base resins, one can also see that foaming of Bakelite 6109 starts at overall lower temperatures compared to Bakelite 0235 mixtures. This may be attributed to a higher reactivity of Bakelite 6109 compared to Bakelite 0235. Several factors such as different polymer chain architecture with higher amounts of reactive ortho-terminated phenol compounds or a higher starting molecular weight of the base resin are known to increase the reactivity of resins [Citation30,Citation58]. Direct chemical investigations on the reactivity of different resins however are beyond the scope of the presented investigations.
As stated previously, the amount of hexa as well as the heating rate used in the rheometer influence the measured minimum of the complex viscosity. These effects are shown in where the minimum of complex viscosity is plotted as a function of the hexa content for the two investigated heating rates. The individual datasets were fitted with high accuracy (R2 > 0,995) using an exponential function. The graphs in clearly show that the minimum of complex viscosity values measured during the rheometer experiments were exponentially connected to the hexa content. This finding may be associated with the curing reaction, which can also be described using an Arrhenius equation for the activation energy of curing [Citation39]. The results presented in are expected to help finding a suitable hexa amount for the desired application process or vice versa. High heating rates of 10 K/min during the experiments led to significantly lower minimal viscosities and reduced the influence of higher hexa contents of the different base resins. On the other hand, high heating rates also led to drastically shortened times up until foaming started, which is illustrated in .
Figure 6. Influence of hexa content on the minimal complex viscosity for Bakelite 0235 and Bakelite 6109.
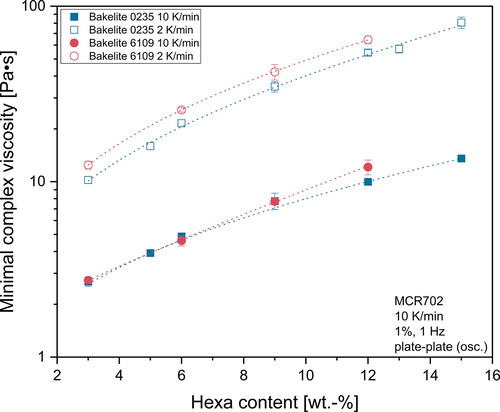
Figure 7. Influence of heating rate on curing behavior of Bakelite 0235 mixtures from 100 °C to 170 °C.
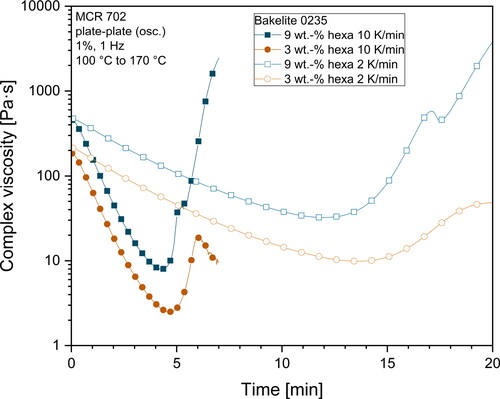
When the rheometer experiments were conducted with higher heating rates of 10 K/min instead of 2 K/min overall lower minimum complex viscosities were obtained as displayed in . However, the time until the viscosity rose is drastically reduced, which also means there is a smaller processing time window available for the production of samples. The minimal viscosity as well as the time up until gelation was reached are important parameters to find suitable resins for desired production processes and may be tailored by the variation of hexa contents and heating rates simultaneously.
3.2. Thermogravimetry—pyrolysis kinetics and carbon residue
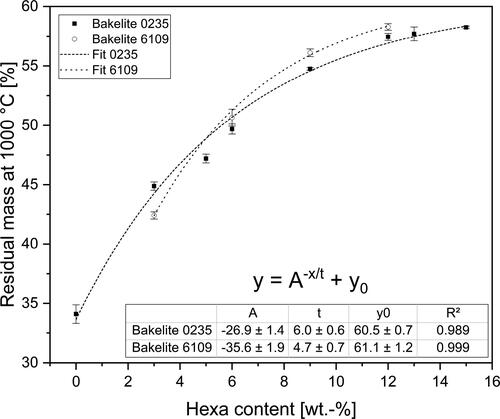
illustrates the mass loss and residual carbon amount at 1000 °C for Bakelite 0235 mixtures. As expected, higher hexa contents led to elevated thermal stability and an enlarged carbon residue after pyrolysis due to an increased degree of crosslinking of the polymer. Hexa contents of more than 12 wt.-% led to only insignificant increases in residual carbon amount and to virtually identical pyrolysis mass loss behavior. This is another indication that the polymer structure of mixtures with hexa contents 12 wt.-% was similar as already seen for the reactivity data of rheometer measurements shown in and . Concerning the general mass loss behavior of the investigated mixtures, two characteristic main mass loss steps with infliction points at about 400 °C and 550 °C were visible. For resins with hexa contents less than 9 wt.-% the main step was at 400 °C whereas for mixtures with higher hexa contents the main step was located at 550 °C. The shift of the main pyrolysis step may be attributed to the higher thermal stability of resins with higher hexa content due to a higher degree of crosslinking of the polymer chains.
Figure 8. TG mass loss curves for Bakelite 0235 mixtures up to 1000 °C.
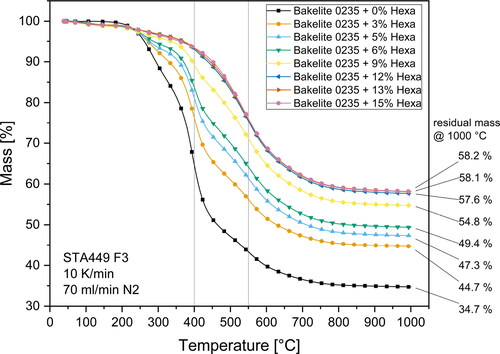
The residual carbon amount was fitted with high accuracy (R2 > 0.989) with an exponential decay function. The fitting function curve, datapoints, fitting function and fitting parameters are illustrated in . Exact carbon residue values are provided as supplementary material.
Figure 9. Asymptotical fit of residual carbon amount of Bakelite 0235 and Bakelite 6109 at 1000 °C.
Apart from overall mass loss and carbon residue, the mass loss kinetics also play an important role in industrial processing as they may determine the required time to produce carbon products via pyrolysis. Therefore, time derivative thermogravimetric (DTG) curves were derived from the TG curves to further investigate the mass loss kinetics. shows the DTG curves for the Bakelite 0235 derived resins.
Figure 10. DTG mass loss curves for Bakelite 0235 mixtures up to 1000 °C.
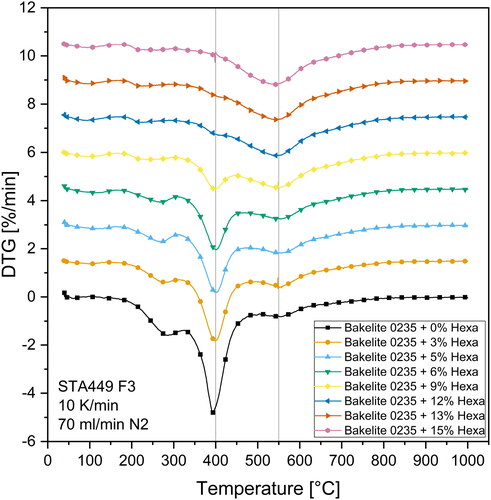
In total four kinetically important mass loss steps were identified in . The mass loss peaks are located at 100 °C, 270 °C and 400 °C and 550 °C, whereas increasing the hexa contents gradually shifted the major mass loss kinetics towards higher temperatures. Mixtures with hexa contents 12 wt.-% only showed one broad mass loss step between 450 °C and 650 °C peaking at 550 °C. Again, this underlines the elevated thermal stability of resins with higher hexa contents and the absence of a distinct mass loss step at 400 °C indicates a change in polymer structure compared to resins with low hexa contents. Further investigations on the position and chemical nature of each mass loss step are given in the upfollowing chapter by performing advanced evolved gas analysis.
3.3. Evolved gas analysis
In the detailed DTG curve for Bakelite 0235 + 3 wt.-% hexa is given.
Figure 11. DTG curve for Bakelite 0235 mixture with 3 wt.-% hexa up to 1000 °C. Four kinetically important mass loss steps were detected at 100 °C, 270 °C and 400 °C and 550 °C.
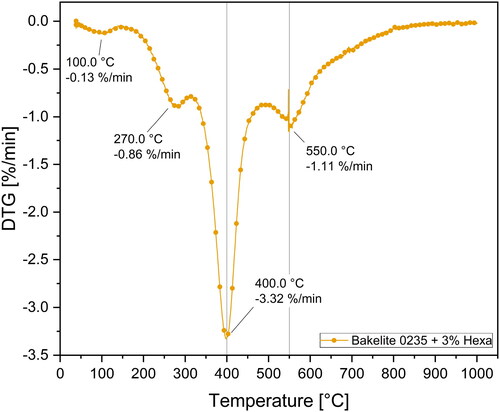
The four mass loss steps at 100 °C, 270 °C and 400 °C and 550 °C presented in are also clearly visible in with the peak at 400 °C being the kinetically most important step attaining −3.32%/min. Continuous FTIR-analysis of the evolved gases during TG measurements was conducted and four FTIR spectra at each of the beforementioned temperatures were exported to analyze the pyrolysis gases at these pyrolysis steps which are plotted in .
Figure 12. FTIR spectra of pyrolysis gas emitted by Bakelite 0235 mixture with 3 wt.-% hexa at 100 °C, 270 °C and 400 °C and 550 °C.
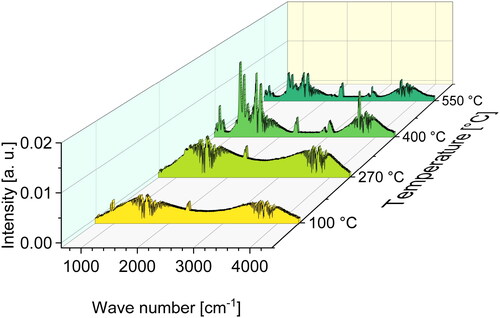
The presented FTIR spectrum for 100 °C shows clear indications for the release of three substances NH3, H2O and CO2. Taking into account the low temperature and the overall low mass loss at 100 °C for Bakelite 0235 + 3 wt.-% hexa presented in , the release of this substances is likely based on a desorption process. NH3, H2O and CO2 may be absorbed by the phenolic resin during curing or after curing due to humidity take-up while being stored in the autosampler of the TG device. Especially the release of NH3 can be linked to the reaction of hexamethylenetetramine with uncured resin leading to the release of ammonia gas [Citation56]. Due to the formation of a foam structure during curing and the solidification of the resin, the ammonia gas is trapped inside the cured resin structure and released during heating due to diffusion out of the resin.
The FTIR-spectrum shows that for a temperature of 270 °C only two substances were released: H2O and CO2. Taking into account the overall mass loss of −4.16% from 100 °C to 270 °C and the start of this mass loss at about 170 °C illustrated in the cause of mass loss is likely based on a post curing reaction. The start of post curing at temperatures close to the curing temperature of the resins (170 °C) is another indication for this assertion. During post curing further methylene bridges are formed and water vapor and CO2 gas are emitted, which was also reported by other authors [Citation57].
Concerning the spectra at temperatures of 400 °C and 550 °C carbon monoxide (CO) and various aromatic compounds in addition to CO2 and water vapor are released. The exact nature of the released organic compounds cannot be identified using FTIR. However, due to the complex mixture of different compounds leading to various overlapping peaks and ambiguous spectra, organic compounds were identified using GC-MS analysis. The resulting total ion current chromatograms (TICC) are illustrated in .
Figure 13. Total ion current chromatogram (TICC) for Bakelite 0235 mixtures at 400 °C and 550 °C.
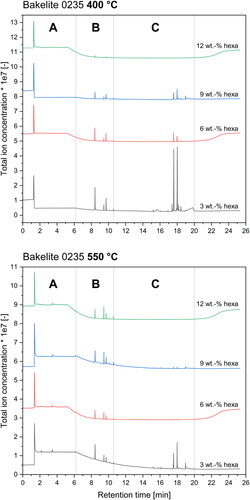
As already mentioned for the FTIR analysis, a complex mixture of various organic compounds is released during the pyrolysis of phenolic resin, which is also clearly visible by the amount of peaks visible in the TICC diagrams in . Independent of resin type or investigated temperature, the TICC diagrams can be divided into 3 retention time zones: zone A from 0 min to 6.2 min, zone B from 6.2 min to 10.6 min and zone C from 10.6 min to 20.0 min. Moreover with an increasing hexa amount the evident peaks on the left hand side of for a temperature of 400 °C gradually diminish until nearly no peaks are detectable any more. This again underlines the increased thermal stability of resin mixtures containing high amounts of hexa, as no substances are released at this temperature.
For a temperature of 550 °C all resins show a slight release of substances with a retention time between 0 min to 6.2 min and a significant release of compounds between 6.2 min to 10.6 min. For mixtures with low to medium hexa contents (≤ 9 wt.-%) peaks at retention times between 10.6 min to 20.0 min were detected. The identical release of substances at 550 °C and retention times of 6.2 min to 10.6 min indicates the same pyrolysis reactions for all investigated mixtures independent from the resin type or hexa content. Mixtures with hexa contents of less than 12 wt.-% show a significant substance release with a retention time between 10.6 min to 20.0 min independent from resin type. This clearly implies the presence of a second decomposition reaction compared to resins with high hexa contents. To further investigate the chemical nature of the decomposition, the mass spectra for each peak visible in the TICC diagrams () were examined. Ultimately a chemical substance was assigned for each individual mass spectrum using a database search. shows a modified TICC diagram with structural formulas assigned to each visible peak for Bakelite 0235 + 3 wt.-% hexa.
Figure 14. Total ion current chromatogram (TICC) for Bakelite 0235 + 3 wt.-% hexa at temperatures of 400 °C and 550 °C. Chemical substances were assigned to each peak by comparing measured mass spectra to chemical database spectra.
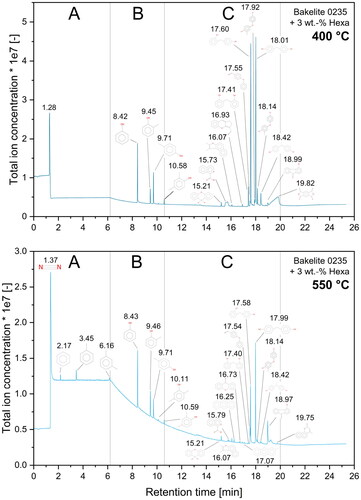
By assigning chemical compounds to the peaks visible in the TICC diagrams, the beforementioned time zones of retention time can also be interpreted in a chemical way. hence shows the following:
Zone A: gases (nitrogen, carbon dioxide, hydrogen; not specifiable with used column type) and simple aromatics (benzole, toluole, xylole)
Zone B: monomer compounds
(phenol, methylphenols, di-methylphenols)
Zone C: dimer & trimer structures, phenols cross-linked by methylene & ether bridges or other compounds containing a minimum of two phenolic rings
The first peak visible in at a retention time of about 1.28 min to 1.37 min is the injection peak into the GC column and can likely be assigned to various low-molecular weight gases such as nitrogen, carbon dioxide and hydrogen. Exact gas composition however cannot be specified with the used column type. After the injection peak, the release of benzole, toluole and xylole is visible for all investigated mixtures indicating the breakup of side groups of the polymeric structure.
The second retention time zone () from 6.2 min to 10.6 min is characterized by the release of monomeric substances such as phenols, methylphenols and dimethylphenols. The emission of these substances indicates the breakup of the polymeric backbone structure. Moreover, the release of these phenolic compounds for all investigated materials likely identifies this as the main pyrolysis mechanism. Mixtures with hexa contents below 12 wt.-% already emit this chemical species at temperatures as low as 350 °C, whereas high hexa containing mixtures only show considerable emission of these substances at temperatures higher than 450 °C suggesting a stronger polymeric backbone structure of the resin resulting in overall increased thermal stability.
All mixtures with hexa contents 9 wt.-% also showed released phenolic compounds cross-linked by methylene and ether bridges or other compounds mainly consisting of two phenolic rings in the chemical structure with retention times between 10.6 min to 20.0 min (). The release of these larger molecules is likely linked to a substructure in the polymeric backbone which decomposes by releasing dimer- or trimer-compounds. Emissions of dimer and trimer structures also implies a non-complete cross-linking, resulting in the release of small cross-linked substances (dimers and trimers). These cross-linked compounds are connected to a more stable highly cross-linked superstructure.
This particular pyrolysis behavior seems to be linked to the hexa induced microgel formation during curing of novolak resins proposed by previous studies [Citation31,Citation39–41]. A schematic illustration of the microgel induced polymer structure evolution in novolak resins is given in .
Figure 15. Schematic illustration of hexa induced microgel formation in novolak resins.
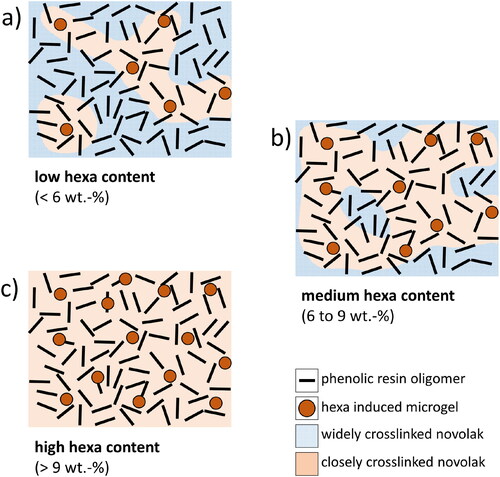
Novolak cured with low amounts of hexa () shows one major decomposition peak at 400 °C and a minor decomposition peak at 550 °C. The pyrolysis gases released by such resins have a complex composition with the emissions of monomeric as well as high amounts of dimer- and trimer phenol-compounds. Resins containing low to medium amounts of hexa () exhibit two distinct decomposition peaks at 400 °C and 550 °C. They also release monomeric as well as dimer- and trimer phenol-compounds. Resins cured with high amounts of hexa (), on the other hand, are characterized by only one decomposition peak located at 550 °C with the emission of monomeric substances. Both, the higher decomposition temperature as well as the release of monomeric substances may probably be linked to the formation of a chemically more stable compound compared to low-hexa containing resins. It is therefore likely that the peak at 400 °C can be attributed to the decomposition of a less densely cross-linked structure whereas the peak at 550 °C may be assigned to the pyrolysis of a densely cross-linked resin or highly-cross-linked microgel structure inside a less densely cross-linked resin. The emission of dimer and trimer phenol compounds for resins with low hexa contents at a temperature of 550 °C may be based on less densely cross-linked islands inside a highly cross-linked resin superstructure.
3.4. Interconnections between processing parameters and pyrolysis behavior
In order to identify possible interconnections between the complex viscosity as important processing parameter and the char yield of resins as vital criterion for producing carbon materials via pyrolysis, the values of complex viscosity were plotted over the char yield. This is illustrated in .
Figure 16. Minimal complex viscosity plotted over char yield for different hexa contents; A linear fit for hexa contents 9 wt.-% and an exponential fit for hexa contents
9 wt.-% was used to fit the data for Bakelite 0235 derived resins.
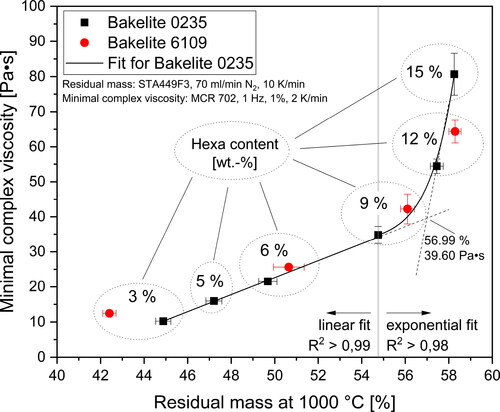
As already shown in and both viscosity and char yield increase with increasing amounts of hexa, which is also visible in . However, implies that the interconnection between minimal complex viscosity and char yield is not linear or exponential but rather characterized by two regions. For low to medium hexa contents ( 9 wt.-%) viscosity and char yield are connected linearly whereas for high hexa contents (
9 wt.-%) the minimum of complex viscosity rises exponentially compared to the char yield. This behavior has also been investigated for the rheometer measurements conducted with a heating rate of 10 K/min. The graph for these measurements are given as supplementary material to this manuscript.
The existence of two distinct regions illustrated in may also be connected to the curing inhomogeneities of polymers proposed in the literature [Citation39–43]. The presence of individual hexa induced microgel islands in the molten resin prior to the curing reactions seems very likely. The resulting polymer structure after curing is then characterized by widely and closely cross-linked regions as illustrated in . When the hexa content is varied, the amount of hexa induced microgels in the polymer melt also changes proportionally together with the ratio of closely to widely cross-linked regions and ultimately also the resulting char yield. However, when high hexa contents ( 9 wt.-%) are present and the hexa content is further increased, the minimal viscosity rapidly increases due to a facilitated curing of the resin based on the lowered distance between microgels in the polymer melt. The structure of resins cured with high amounts of hexa, on the other hand, is in all probability very similar which then results in equal char yields (), similar mass loss kinetics () and comparable pyrolysis gas composition ().
To proof this proposed hypothesis further analytical methods such as CP/MAS NMR and transmission electron microscopy on cured resins as well as the resulting carbons may prove beneficial. Further TG and rheometer experiments in the transition region from medium to high hexa contents proposed as intersection of the onsets of the fit functions in may also give a deeper insight into the structure of hexa cured novolak resins. This however is beyond the scope of the current investigations and may be addressed in the future.
4 Conclusions
Various chemical and physical properties of phenolic resins can be tailored by the variation of the amount of hexamethylenetetramine. Interconnections between polymer structure, viscosity, reactivity, pyrolysis kinetics, carbon residue, pyrolysis reactions and evolved gases and the amount of hexamethylenetetramine in the resin were analyzed. The pyrolytic behavior, emitted gases and char yield are likely linked to the formation of a highly cross-linked hexa induced microgel structure in the resin during curing. An illustration on how this microgel formation may depend on the hexa content is given in .
The materials presented in are characterized by the following properties:
low hexa content (< 6 wt.-%)
low viscosity
foaming at T > 130 °C
mainly widely cross-linked
main pyrolysis step at 400 °C
high emission of connected phenol species
char yield < 50%
medium hexa content (6 wt.-% to 9 wt.-%)
medium viscosity
foaming at T < 130 °C
widely + closely cross-linked regions
pyrolysis steps at 400 °C and 550 °C
medium emission of connected phenol species
char yield 55% to 56%
high hexa content (> 9 wt.-%)
high viscosity
foaming at T < 130 °C
closely cross-linked
main pyrolysis step at 550 °C
no emission of connected phenol species
char yield
58%
All in all, the results of this study led to a deeper understanding of curing and pyrolysis of phenolic resins by interconnecting rheometry data, mass loss behavior and evolved gas analysis. The presented models and functions offer the possibility to predict and tailor properties of phenolic resins for various applications and provide a theoretic basis for future resin development. Furthermore, the presented models for the viscosity and char yield of resins offer the possibility to enhance processing and properties of phenolic resin derived carbons in a targeted way.
Supplemental Material
Download Zip (2.3 MB)Acknowledgment
Special thanks goes to Bakelite Synthetics (Germany) for providing the phenolic resins and hexamethylenetetramine.
Disclosure statement
No potential competing interest was reported by the authors.
Data availability statement
The authors confirm that the data supporting the findings of this study are available within the article and its supplementary materials.
Additional information
Funding
References
- Baekeland LH. Method of indurating fibrous cellular material. US 949671, 1910.
- Krenkel W. Cost effective processing of CMC composites by melt infiltration (LSI-process). In 25th annual conference on composites, advanced ceramics, materials, and structures: a: ceramic engineering and science proceedings, p. 443–454. John Wiley & Sons, Ltd. Westerville, Ohio, 2008.
- Nestler D, Nier N, Roder K, et al. Development and characterization of phenolic resin moulding materials for the production of new short fibre-reinforced c/c-sic composites. Mater Sci Forum. 2015;825–826:215–223.
- Li Y, Xiao P, Li Z, et al. Strength evolution of cyclic loaded LSI-based c/c-sic composites. Ceram Int. 2016;42(13):14505–14510.
- Langhof N, Rabenstein M, Rosenlöcher J, et al. Full-ceramic brake systems for high performance friction applications. J Eur Ceram Soc. 2016;36(15):3823–3832.
- Todt A, Roder K, Nier N, et al. Influence of hardener content and curing parameters on the microstructure and mechanical properties of porous c/c composites. Key Eng Mater. 2017;742:246–252.
- Stiller J, Nestler D, Päßler E, et al. Modification of the thermoset injection moulding process for shaping to increase the fibre length in c/c-sic ceramics produced by the LSI process. Key Eng Mater. 2019;809:153–160.
- Süß F, Schneider T, Frieß M, et al. Combination of pip and lsi processes for sic/sic ceramic matrix composites. Open Ceramics. 2021;5:100056.
- Miles BH, Parker JA, Sonnabend LF, et al. The effects of molecular structure on the thermochemical properties of phenolics and related polymers, 1967.
- Pulci G, Tirillò J, Marra F, et al. Carbon–phenolic ablative materials for re-entry space vehicles: manufacturing and properties. Compos A: Appl Sci Manuf. 2010;41(10):1483–1490.
- Helber B, Turchi A, Scoggins JB, et al. Experimental investigation of ablation and pyrolysis processes of carbon-phenolic ablators in atmospheric entry plasmas. Int J Heat Mass Transf. 2016;100:810–824.
- Vignoles GL, Turchi A, Bianchi D, et al. Ablative and catalytic behavior of carbon-based porous thermal protection materials in nitrogen plasmas. Carbon. 2018;134:376–390.
- Liu Z, Hao A, Zhang S, et al. Lightweight carbon nanotube surface thermal shielding for carbon fiber/bismaleimide composites. Carbon. 2019;153:320–329.
- Cheng H, Fan Z, Hong C, et al. Lightweight multiscale hybrid carbon-quartz fiber fabric reinforced phenolic-silica aerogel nanocomposite for high temperature thermal protection. Compos A: Appl Sci Manuf. 2021;143:106313.
- Wang H, Quan X, Yin L, et al. Lightweight quartz fiber fabric reinforced phenolic aerogel with surface densified and graded structure for high temperature thermal protection. Compos A: Appl Sci Manuf. 2022;159:107022.
- Maria Caporale A, Airoldi A, Natali M, et al. Thermomechanical response of out-of-autoclave infused carbon-phenolic laminates for rocket engine applications subjected to surface ablation. Compos A: Appl Sci Manuf. 2022;159:107035.
- Aneziris CG, Borzov D, Ulbricht J, et al. Phenolic resins with carbo-resin additions for improved MGO-C refractories. Key Eng Mater. 2004;264-268:1767–1770.
- Dungan RS, Reeves JB. Pyrolysis of foundry sand resins: a determination of organic products by mass spectrometry. J Environ Sci Health A Tox Hazard Subst Environ Eng. 2005;40(8):1557–1567.
- Luz AP, Salomão R, Bitencourt CS, et al. Thermosetting resins for carbon-containing refractories: theoretical basis and novel insights. Open Ceramics. 2020;3:100025.
- Chen Z, Yan W, Schafföner S, et al. A novel approach to lightweight alumina–carbon refractories for flow control of molten steel. J Amer Ceram Soc. 2020;103(8):4713–4724.
- Chen Z, Yan W, Schafföner S, et al. Enhanced mechanical properties of lightweight al 2 o 3 –c refractories reinforced by combined one–dimensional ceramic phases. Int J Appl Ceram Technol. 2022;19(3):1613–1625.
- Křistková M, Filip P, Weiss Z, et al. Influence of metals on the phenol–formaldehyde resin degradation in friction composites. Polym Degrad Stab. 2004;84(1):49–60.
- Menapace C, Leonardi M, Secchi M, et al. Thermal behavior of a phenolic resin for brake pad manufacturing. J Therm Anal Calorim. 2019;137(3):759–766.
- Casamassa E, Gautier G, Sin A, et al. Granular and platelet titanate as promising brake pads ingredients. Open Ceramics. 2021;6:100128.
- Zhang Z, Song M, Hao J, et al. Visible light laser-induced graphene from phenolic resin: a new approach for directly writing graphene-based electrochemical devices on various substrates. Carbon. 2018;127:287–296.
- Xu H, Yin X, Li M, et al. Mesoporous carbon hollow microspheres with red blood cell like morphology for efficient microwave absorption at elevated temperature. Carbon. 2018;132:343–351.
- Krüner B, Schreiber A, Tolosa A, et al. Nitrogen-containing novolac-derived carbon beads as electrode material for supercapacitors. Carbon. 2018;132:220–231.
- Arno Gardziella, Louis A. Pilato, Andre Knop, editor. Phenolic resins: chemistry, applications, standardization, safety and ecology, 2nd ed. Berlin, Heidelberg: Springer, , 2000.
- Looney MG, Solomon DH. The chemistry of novolac resins. i. a review on the use of models. Aust J Chem. 1995;48(2):323.
- Dargaville TR, de Bruyn PJ, Lim ASC, et al. Chemistry of novolac resins. II. Reaction of model phenols with hexamethylenetetramine. J Polym Sci A, Polym Chem. 1997;35(8):1389–1398.
- Zhang X, Looney MG, Solomon DH, et al. The chemistry of novolac resins: 3. 13c and 15n n.m.r. studies of curing with hexamethylenetetramine. Polymer. 1997;38(23):5835–5848.
- de Bruyn PJ, Foo LM, Lim AS, et al. The chemistry of novolac resins. Part 4. The strategic synthesis of model compounds. Tetrahedron. 1997;53(40):13915–13932.
- Zhang X, Potter AC, Solomon DH. The chemistry of novolac resins—v. Reactions of benzoxazine intermediates. Polymer. 1998;39(2):399–404.
- Zhang X, Solomon DH. The chemistry of novolac resins – VI. Reactions between benzoxazine intermediates and model phenols. Polymer. 1998;39(2):405–412.
- Zhang X, Potter AC, Solomon DH. The chemistry of novolac resins: part 7. reactions of Para-hydroxybenzylamine intermediates. Polymer. 1998;39(10):1957–1966.
- Zhang X, Potter AC, Solomon DH. The chemistry of novolac resins: part 8. reactions of Para-hydroxybenzylamines with model phenols. Polymer. 1998;39(10):1967–1975.
- Zhang X, Solomon DH. The chemistry of novolac resins: 9. Reaction pathways studied via model systems of ortho-hydroxybenzylamine intermediates and phenols. Polymer. 1998;39(24):6153–6162.
- Lim ASC, Solomon DH, Zhang X. Chemistry of novolac resins. x. Polymerization studies of hmta and strategically synthesized model compounds. J Polym Sci A, Polym Chem. 1999;37(9):1347–1355.
- Peng W, Riedl B. Thermosetting resins. J Chem Educ. 1995;72(7):587.
- de Medeiros ES, Agnelli JAM, Joseph K, et al. Curing behavior of a novolac-type phenolic resin analyzed by differential scanning calorimetry. J Appl Polym Sci. 2003;90(6):1678–1682.
- Izumi A, Nakao T, Shibayama M. Gelation and cross-link inhomogeneity of phenolic resins studied by 13c-nmr spectroscopy and small-angle x-ray scattering. Soft Matter. 2013;9(16):4188.
- Odagiri N, Shirasu K, Kawagoe Y, et al. Amine/epoxy stoichiometric ratio dependence of cross-linked structure and ductility in amine–cured epoxy thermosetting resins. J Appl Polym Sci. 2021;138(23):50542.
- Vidil T, Tournilhac F, Musso S, et al. Control of reactions and network structures of epoxy thermosets. Prog Polym Sci. 2016;62:126–179.
- Guzzetti AJ, Dienes GJ, Alfrey T. Rheological properties of phenolic resins. Effect of reaction with hexamethylenetetramine on properties of a phenol-formaldehyde novolak. J Colloid Sci. 1950;5(3):202–217.
- Drumm MF, Dodge CWH, Nielsen LE. Cross linking of a phenol-formaldehyde novolac – determiantion by dynamic-mechanical measurements. Indust Eng Chem. 1956;48(1):76–81.
- Raghav Rao MP, Urmode TD, Shinde VS. Synthesis, characterization and cure behavior of phenol-crotonaldehyde-resorcinol resins. Mater Res Express. 2019;6(11):115329.
- Trammell MP. Rheology analysis of thermosetting resin candidates for use in fuel compacting, 2012.
- Simitzis J. Correlation between the production parameters and the mechanical-properties of novolac resins reinforced with carbon-fibers. Die Angewandte Makromolekulare Cheinie. 1989;165(2624):21–34.
- Romanoski GR, Lach K, Monaghan K, et al. An investigation of the rheological behavior of phenolic resins considered for production of carbon bonded carbon fiber insulation. In Nuclear and emerging technologies for space. American Nuclear Society Topical Meeting. Richland, WA, February 25–28 2019.
- Shaghaghi S, Beheshty MH, Rahimi H. Preparation and rheological characterization of phenolic/glass prepregs. Iran Polym J. 2011;20(12):969–977.
- Ko T-H, Kuo W-S, Chang Y-H. Microstructural changes of phenolic resin during pyrolysis. J Appl Polym Sci. 2001;81(5):1084–1089.
- O’Connor D, Blum FD. Thermal stability of substituted phenol-formaldehyde resins. J Appl Polym Sci. 1987;33(6):1933–1941.
- Zhang X, Solomon DH. Carbonization reactions in novolac resins, hexamethylenetetramine, and furfuryl alcohol mixtures. Chem Mater. 1999;11(2):384–391.
- Ko T-H, Kuo W-S, Chang Y-H. Raman study of the microstructure changes of phenolic resin during pyrolysis. Polym Compos. 2000;21(5):745–750.
- Harpale A, Sawant S, Kumar R, et al. Ablative thermal protection systems: pyrolysis modeling by scale-bridging molecular dynamics. Carbon. 2018;130:315–324.
- Bouajila J, Raffin G, Waton H, et al. Phenolic resins (iii) – solid state structures and thermal properties of cross-linked phenolic resins. Polym Polym Compos. 2003;11(4):263–276.
- Bouajila J, Raffin G, Alamercery S, et al. Phenolic resins (iv). thermal degradation of crosslinked resins in controlled atmospheres. Polym Polym Compos. 2003;11(5):345–357.
- Bouajila J, Raffin G, Waton H, et al. Phenolic resins (ii) – influence of the chemical structure of high molecular weight molecules on the mechanisms of cross-linking and on the final structure of the resins. Polym Polym Compos. 2003;11(4):233–262.