
 ?Mathematical formulae have been encoded as MathML and are displayed in this HTML version using MathJax in order to improve their display. Uncheck the box to turn MathJax off. This feature requires Javascript. Click on a formula to zoom.
Abstract
Semi-finished thermoplastic foam panels can be transformed into structural foams—a sandwich-like structure with high-density skins—through thermoforming. This transformation enables the production of mono material sandwich panels, which allow a significant increase in bending properties without increasing the part weight. This study describes the effect of process parameters on skin formation in thermoplastic structural foams manufactured in a two-step isochoric and isothermal hot press process. Process data recorded during foam manufacturing was analyzed and compared to foam behavior in quasi-static isothermal compression tests performed at different levels of temperature and crosshead speeds. The effect of skin-core structure on bending properties is compared to theoretical models from the established literature. It was found that a rule of linear mixture that considers the relative skin thickness allows adequate prediction of both bending modulus and strength. Preferable process design—especially combinations of tool temperature and maximum compaction speed—is described based on the comparison of measured and predicted performance.
Graphical Abstract

Introduction
Structural foams have a sandwich-like structure with high-density skins on the surface and a low-density foam core. They consist of a single material, unlike conventional sandwich material for structural applications, that foams are made from fiber-reinforced skins and honeycomb cores. The low-density cellular structure within the foam core allows increased part stiffness at equal weight compared to solid material. These structural foams can be produced to meet different requirements by injection molding, extrusion, or casting processes [Citation1]. Recyclability and a circular economy with a minimal downgrade in material properties can be achieved by foams made with thermoplastic polymers. The mono-material approach of thermoplastic structural foams facilitates recycling of process scrap—such as off-cuts during production—through direct reuse as feed material. Part recycling at the product end-of-life can be achieved in a similar manner [Citation2, Citation3].
A previous study [Citation4] focused on presenting a novel process to transform thermoplastic foams into structural foams. It discussed the differences in skin formation between open-cell polyetherimide (PEI) and closed-cell polyether-sulfone (PES) foams. The investigation revealed that skin formation occurs differently in open- and closed-cell foams due to material distribution within the cellular structure. It was demonstrated that skin formation in closed-cell foams can be predicted quite well with a linear model based on the applied compaction and the relative density of the foam. It was possible to describe that the bending properties changed but it was not possible to reliably connect this change to the alteration in the foam structure.
This study focuses on the influence of process parameters such as temperature, pressure, and compaction speed during skin production on the change in foam structure of structural closed-cell foams produced with Divinycell F50 (PES) foams. Data recorded during structural foam manufacturing will be analyzed and compared to the results of quasi-static and isothermal compression tests. The results of three-point bending tests will be compared to models from the literature. A preferred process design will be described based on these comparisons.
State of the art
Production of polymer foams
The development of sandwich panels for application in aircraft in 1919 led to an investigation of different core materials. Honeycomb cores were developed as an alternative to balsa wood cores. They were followed by polyvinyl chloride (PVC) rigid foams, developed in the 1930s and 1940s. Polyurethane foams developed in the 1950s were presented as a cheaper alternative to PVC but were still more expensive than balsa wood cores. The production of polystyrene-based polymer foams was investigated starting in the late 1940s. A novel process for the production of ‘Styropor’ polystyrene foams was presented by BASF in 1952. Process variants were presented by DOW and Koppers in the USA to produce XPS using extrusion processes [Citation1]. These types of foams are known as EPS in Europe or XPS in the US and are well-established materials today. High-density polystyrene (PS) foams can be used as structural core materials for the construction of wind turbine blades. However, the larger share of applications for PS foams aims at insulation purposes and protection from impact damage [Citation2]. Similar approaches and processes based on polymer beads as a base material have been adapted to produce polyethylene (EPE) and polypropylene (EPP) bead foams [Citation2, Citation5].
Thermoplastic rigid foam for application in structural sandwich cores emerged with polyethylene terephthalate (PET) ‘strand’ foam being introduced in the year 2000. This foam combines several advantages, such as production with efficient extrusion processes, thermoformability, as the ability to be recycled by thermal melt processing. Foaming processes have been successfully developed to produce thermoplastic foams from high-performance polymers such as PEI and PES. These foams present many advantages for aerospace applications, e.g. thermoformability, high-temperature resilience, excellent fire, smoke, and toxicity properties. Both foams can be produced by extrusion processes enabling efficient large volume production of semi-finished foam panels with different configurations of foam density and foam thickness. PEI foams are described as having low moisture absorption and radar transparency, but they also have a low percentage of closed cells. PES foams have closed cells that reduce moisture uptake over time considerably. Another important property of PES foam is its high service temperature, which allows it to retain mechanical properties at 200 °C for an extended period of time [Citation2].
Variants of PES bead foams have also been developed to facilitate manufacturing of these foams for different applications [Citation6].
The progress in process development and increase in efficiency through extrusion processes presents thermoplastic foams as an attractive engineering material with competitive properties. The most prominent disadvantage of thermoplastic foams is their comparatively low mechanical properties, which are directly connected to their reduced density.
Thermoforming of thermoplastic foams
The structure of thermoplastic foams and their generation during foaming processes are influenced by different mechanisms that involve competing parameters. Therefore, efficient foam production must be performed within tight windows with narrow tolerances for each parameter, which become even tighter when considering mass production with economic restrictions [Citation7]. Therefore, it might be of advantage to pursue a strategy of decoupling mechanisms (that occur during the production of thermoplastic foams and parts) for presenting processes that allow a larger variety in produced parts and may become economically more viable.
Part production based on thermoplastic foams can be achieved with different processes and process chains. Elevating the surface quality is a major objective for the production of injection-molded parts [Citation8]. Therefore, some process variants combine the thermoforming of a decorative cover layer with injection molding (in-mold decoration) [Citation9]. A dense polymer skin can also be produced within the foam by using in-mold-skinning processes. Other process chains decouple the foam manufacturing and add a subsequent thermoforming step to change the geometry of the foam and create a dense polymer skin or add a cover layer. Different versions of stamp-forming processes can be applied to change the overall geometry of flat foam parts by using a hot press tool. These processes can apply a cover layer or produce a skin from the polymer foam itself [Citation5].
The recyclability of such composite sandwich panels can be increased when the foam core and the reinforced cover layer are made from the same polymer. This approach increases the viability of thermoplastic foams for applications that have not been previously accessible [Citation3].
A previous study [Citation4] showed that it is possible to use a variation of the stamp-forming approach—a hot press process—to transform thermoplastic foams with a homogeneous density distribution into structural foams by locally increasing the foam density—preferably up to the polymer density. This approach creates a sandwich structure with a low-density foam core between two polymer skins of higher density. This study further investigates this approach and presents a model to identify process parameters for optimized bending properties.
Compressive behavior of thermoplastic foams
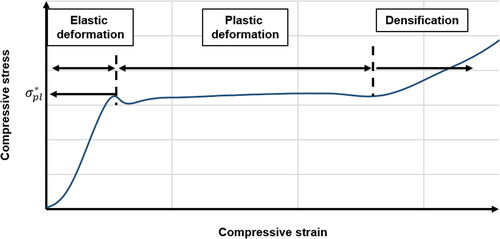
shows a characteristic stress-strain curve for the compressive behavior of thermoplastic foams. The stress–strain-curves can generally be divided into three distinct areas: elastic and plastic deformation, and a final stage called densification. Linear elastic deformation in closed-cell foams is dominated by cell face stretching. The compressive modulus, Ecomp, can be calculated as the gradient in this area. The transition between elastic and plastic deformation can be determined by identifying the compressive strength a local stress maximum. Cell walls collapse progressively during plastic deformation, the stress-strain-curves display a plateau. The final stage during compression is called densification and can be described as the result of opposing cell walls being crushed together.
Figure 1. Characteristic compressive stress–strain-curve.
Properties of thermoplastic polymers
The structure in thermoplastic polymers (TP) can be either semi-crystalline or amorphous. The most important difference in the context of part manufacturing is the choice of process temperature. Semi-crystalline TP display a glass transition temperature (Tg) as well as a melting temperature (Tm). Process temperatures for part manufacturing should be chosen at least 50 K above Tm [Citation10].
Amorphous TP, like PES, also displays a glass transition temperature. However, they do not have a distinct melting point. Their Tg is significantly higher when compared to semi-crystalline TP, typically at similar levels compared to the melting point. The mechanical properties of TP highly depend on the temperature the part is exposed to. Preferable process temperatures for amorphous TP should be at least 100 K above Tg [Citation10].
The glass transition of amorphous thermoplastic polymers—the change between the glassy and rubbery state—is rather an extended area of temperatures than a singular point and defined regarding volume or heat capacity within this temperature range. However, the determined Tg may vary based on the method—e.g. differential scanning calorimetry or dilatometric measurements. Some mechanical performance is still available when the temperature increases beyond the onset of glass transition. The entanglement of molecule chains of the amorphous polymer starts to soften within the entropy-elastic rubbery state, before the polymer enters a viscous state with high mobility of the molecules [Citation11–14].
shows a qualitative change in Young’s modulus of semi-crystalline and amorphous TP, compared to the property at room temperature (RT). Some semi-crystalline TP, such as polypropylene (PP) or polyethylene (PE) display glass transition temperature below RT, whereas technical TP such as polyamide 6 (PA6) can have a Tg up to 80 °C, or high performance Polyetheretherketone (PEEK) with a Tg of 145 °C. The curve for semi-crystalline TP depicted in represents the case of PP or PE. The mechanical properties of the part decrease with increasing temperature, especially approaching Tm or Tg. The Young’s modulus of semi-crystalline TP drops to near zero, when temperatures reach Tm. The material starts to flow beyond this point. The Young’s modulus in amorphous TP also displays a significant drop-off when the temperature approaches Tg—a viscous state is entered and a low residual stiffness is shown [Citation10, Citation11].
Figure 2. Young’s modulus for semi-crystalline (sc) and amorphous (a) thermoplastic polymers, based on [Citation11].
![Figure 2. Young’s modulus for semi-crystalline (sc) and amorphous (a) thermoplastic polymers, based on [Citation11].](/cms/asset/d7df0af5-6387-47fb-a81d-0f0b2b74ca8f/yadm_a_2269021_f0002_c.jpg)
At a glance, the Young’s modulus of thermoplastic polymers decreases when the material is heated, especially when the characteristic temperatures Tg or Tm are approached. The main advantage of thermoplastic polymers is their thermoformability. This behavior can be exploited together with the excellent insulation properties of cellular materials for locally changing the structure and geometry of a thermoplastic foam and for preserving the structure in the colder areas of the part.
Theoretical models for structural foam properties
Production of polymer skins through compaction
A previous study [Citation4] considered a theoretical model to relate the compaction applied to a thermoplastic foam to the theoretical polymer skin thickness. It was found that for closed-cell foams, a quasi-linear model could be used to predict skin formation. A schematic for skin production from uniform-density foams is shown in . This model uses the most prominent property of a cellular material, the relative foam density φ, EquationEq. (1)(1)
(1) :
(1)
(1)
Figure 3. Schematic drawing of the cross section of uniform density foam (left) and structural foam (right).
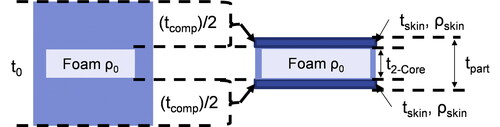
The model incorporates this relative density to predict the produced polymer skin, that is generated when the polymer density is achieved.
The model was proposed for the production of structural foams with symmetrical polymer skins. Therefore, equal compaction in a two-step process was assumed, and skin thicknesses can be calculated with EquationEq. (2)(2)
(2) . A variant of this equation has also been recommended in ref. [Citation5].
(2)
(2)
The sum of the individual skin thicknesses could be set in relation to the part thickness to calculate the relative skin thickness
EquationEq. (3)
(3)
(3) . The density of the foam core remains the initial density.
(3)
(3)
Established models for the prediction of bending properties in structural foams
The description of bending properties and the prediction for structural foams is subject of many studies [Citation15–23].
One of the most widely applied approaches is an empirical description of the relationship between the relative bending properties and the relative foam density EquationEq. (4)
(4)
(4) :
(4)
(4)
The exponent n can be calculated for any given foam if both relative properties are known, EquationEq. (5)(5)
(5) :
(5)
(5)
The established literature presents values in the range of 1 < n < 2 for the exponent n for different mechanical properties [Citation16, Citation17, Citation21, Citation24–27].
While this approach allows an assessment of the overall efficiency of material exploitation, it does not allow considering the influence of the actual foam structure, which is crucial to reliably predict the bending properties.
Since the cross-section of a structural foam resembles that of a sandwich beam, early approaches tried to use variations of Steiner’s theorem for predicting bending properties, EquationEq. (6)(6)
(6) . The presented approach assumes that the width is equal for skin layers and sandwich core. For this reason, the width will be neglected in the following equation:
(6)
(6)
Hobbs compared the effect of density profiles calculated with five different I-beam models on the bending properties of structural foams and compared theoretical and measured deflection curves for three-point bending. A selection of the equivalent cross-section proposed by Hobbs is displayed in . The selected models represent the most commonly used approaches in the established literature. He described that the I-Beam model A, based on Steiner’s theorem EquationEq. (6)(6)
(6) , significantly overestimates the measured values.
Figure 4. Selection of equivalent cross section models presented by Hobbs [Citation15].
![Figure 4. Selection of equivalent cross section models presented by Hobbs [Citation15].](/cms/asset/f8899ea9-45dd-4b45-a889-3455e03c405c/yadm_a_2269021_f0004_c.jpg)
Model B differs from model A in assuming, that the foam modulus in the center reaches a minimum and increases linearly towards the foam surface, EquationEq. (7)(7)
(7) :
(7)
(7)
Hobbs found the best agreement for a quite simple rectangular I-beam model D, in which the entire cross-section is reduced by the ratio of the average modulus and the skin modulus. This oversimplified model—EquationEq. (8)(8)
(8) reduces the structural foams to a rectangular cross section with average density and neglects skin-core effects entirely. Bc is the width times the ratio of the core modulus to the skin modulus [Citation15].
(8)
(8)
Iida et al. [Citation17] investigated bending properties of polyurethane structural foams manufactured through reaction injection molding. They used a variation of Steiner’s theorem, EquationEq. (9)(9)
(9) , and considered density specific bending moduli with an exponent n = 1.9.
(9)
(9)
They also describe that the maximum bending strength in structural foams is influenced by two mechanisms during testing—wrinkling and buckling due to compression within the upper skin and tensile failure in the lower skin. They found that theoretical and measured bending property values coincided quite well. They specify that maximum flexural strength is mainly determined by the flexural strength and modulus of the solid material from which the foam is made [Citation17].
Sadik et al. [Citation28] compared the bending properties of polypropylene structural foams of the skin, the core, and the overall foamed structure. They found good agreement between measured and theoretical values with a model based on a linear mixing rule for rigidity.
Wu and Yeh proposed that the literature established until 1993 focused mainly on structural foams produced with low-pressure structural foam injection molding, and only a few authors discussed gas counter-pressure structural foam injection molding. They produced ABS foams with both process variants, compared their overall structure, and compared bending moduli with I-Beam models that were first proposed by Hobbs in ref. [Citation15]. Contrary to the findings presented by Hobbs, Wu, and Yeh found that models A and B result in relatively adequate agreement. At the same time, they described model D as the least applicable based on their results. They found the best agreement of theoretical and measured data with Model E, EquationEq. (10)(10)
(10) [Citation22].
(10)
(10)
The models described by Hobbs and its variation show a sophisticated albeit empirical approach to modeling structure-property relationship. However, accurate calculation of values for Bc requires knowledge of the foam structure.
shows density distribution in homogeneous foams, composite sandwich and structural foams and compares the different stress distribution within each part. It is a variation of a schematic diagram presented by Iida et al. [Citation17].
Figure 5. Comparison of density and stress distribution in homogeneous foams, composite sandwich and structural foams, based on ref. [Citation17].
![Figure 5. Comparison of density and stress distribution in homogeneous foams, composite sandwich and structural foams, based on ref. [Citation17].](/cms/asset/59607406-b7fa-4d26-b418-2264c9d8c6fe/yadm_a_2269021_f0005_c.jpg)
Throne describes, together with his colleagues in several studies, that the density gradient within a structural foam—unlike within a sandwich beam—does not show an abrupt change in density and the skin-core interface does not incorporate a plane of shear. He further described, that deflection under load must be determined by integration of the density profile across the specimen. If we assume, that the structural foam consists of a uniform core and uniform skin layers, then this approach can be described as a linear rule of mixtures based on the ratio of polymer skin to overall thickness of the structural foam, EquationEq. (11)(11)
(11) [Citation27, Citation29, Citation30].
(11)
(11)
Zhang et al. [Citation19] compared different models to predict bending properties for structural foams and found, that the I-Beam model of Hobbs predicted data very well in the range of relative densities between 45 and 100%. They found reasonable agreement—a deviation of 5.8% between theoretical and measured values. They also revealed, that the approach proposed by Throne—integration of average moduli over a continuous density gradient—underpredicted their measured data by an average of 11% [Citation19].
Barzegari et al. developed a parametric model for the description of density profiles for structural foams produced in injection molding processes. The density profile would be used as a basis for integration of bending moduli and thus calculate the bending modulus of the structural foam.
The presented literature shows great effort to describe structural foams and predict their bending properties with different models. However, structural foams have a large variance in properties that are not only influenced by their cell structure but also by the applied process that is used for their production. Limitations in computational power led to the development of empirical and mathematical models that incorporate basic polymer properties, most pronounced for models modified by Hobbs. These factors have to be considered and may lead to limited applicability for each of the proposed models.
This study focusses on comparing the applicability of the previously described models to predict bending properties of structural foams, that have been produced in a two-step hot press process.
Steiner’s theorem, EquationEq. (6)
(6)
Linear rule of mixtures for relative skin thickness, EquationEq. (11)
Materials and experimental method
Materials
This study investigates the compressive behavior of semi-finished amorphous polyethersulfone based thermoplastic foam Divinycell F50 from DIAB. The most important properties of the semi-finished material are presented in . The data sheet of the foam describes excellent heat aging at 180 °C without a decrease in mechanical performance, and that the onset of Tg is be located at 205 °C, while the Tg itself was determined at 225 °C [Citation31]. The Tg of a variant of the raw polymer itself was reported to also be at 222 °C [Citation32].
Table 1. Properties of semi-finished materials.
Investigation of compressive behavior
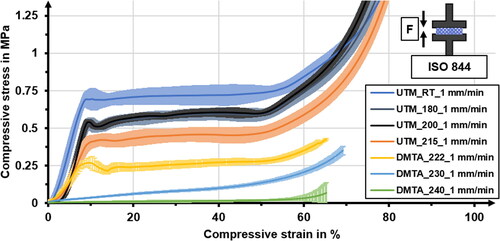
The compressive behavior of the foam specimen was investigated in quasi-static compression tests on a universal testing machine Zwick 1485 (UTM) and on a dynamic-mechanic-thermal-analysis apparatus (DMTA) machine Eplexor 8 from Netzsch Gabo following ISO 844. The test setup for compression tests in UTM and DMTA is presented in .
Figure 6. Test setup in UTM and DMTA for compression tests.
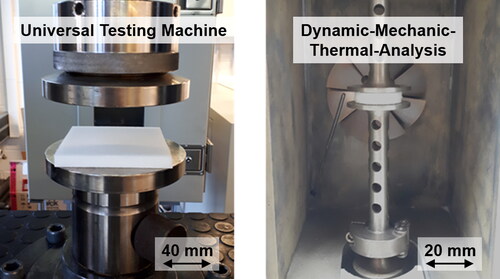
Tests on UTM were conducted on foam panels with a square area of 100 × 100 mm2. A cylindrical specimens with a diameter of 21 mm was prepared for tests on DMTA. An overview of tests conducted on each machine is presented in . The general method for testing was similar on both machines. The test chamber and specimen were heated to the test temperature while a pre-load was applied (UTM: 5 N; DMTA: 1 N). Tests on Zwick 1485 have been conducted at room temperature, 180, 200, and 215 °C (i.e. 7 K below Tg). Tests on DMTA have been conducted at temperatures between 215 and 240 °C (i.e. between 7 K below and 18 K above Tg). The test series at 215 °C has been conducted on both test machines to allow comparison of characteristic values between both machines. Homogeneous temperature distribution within the test chamber and the foam specimen was ensured by allowing a soak time of 300 s before the test procedure started. Tests on both machines were conducted with test speeds of 1 and 10 mm/min to determine strain dependence during compression.
Table 2. Test series on UTM and DMTA.
Hot press process for structural foam manufacturing
Setup of the laboratory hot press
The hot press process presented in this study was executed on a laboratory hot press. Force control of the hot press is realized by a combination of an electromechanical cylinder and a membrane force sensor with a maximum force of 20 kN and an accuracy of ±1N.
Temperature control in each tool is accomplished by six heating cartridges with a total power of 2.4 kW together with a mantle thermocouple with an accuracy of ±1 K. Active cooling of the tools is realized by an air-water-mixture in an individual cooling plate in the tool setup. This cooling plate is equipped with meandering canals within a steel block.
The distance between both tool halves is measured with a digital glass scale with an accuracy of ±1 µm. The operating software is based on LabVIEW. This software allows both in-line process control and recording of process data consisting of
process force (pressure will be calculated post-hoc with individual sheet dimensions),
process temperatures within both the bottom and top tool, but also up to four temperatures via thermocouples at individual positions within the process setup and.
the distance between both tool halves.
Data is recorded with a rate of 1 Hz and written into a logfile for subsequent analysis.
Selection of process parameters and design of experiments
The transformation of semi-finished foam into structural foams was conducted in a two-step isochoric and isothermal hot press process, schematically depicted in . The different parameter combinations of maximum process pressure pmax, hold time, target temperature Ti, and target thickness t2 is presented in . A randomized test series with test blocks was designed by using the commercial software Design Expert 13 from Stat-Ease Inc.
Figure 7. Manufacturing thermoplastic structural foams in a hot press process [Citation4].
![Figure 7. Manufacturing thermoplastic structural foams in a hot press process [Citation4].](/cms/asset/946ad8f9-4838-41bb-95a2-bebb6858bdb1/yadm_a_2269021_f0007_c.jpg)
Table 3. Test series for manufacturing structural foam.
The process temperature was considered to be a hard to change factor during test series design. Therefore, experiments with the same process temperature have been assigned to the same block to minimize influences of changes in tool temperature. Each block consisted of three individual tests compacting the foam sheet in two process steps to the different target thicknesses. The first test series focused on compacting to all of the three target thicknesses t2 with a maximum pressure of pmax = 0.8 Where
is the compressive strength of the foam.
The second test series (highlighted in yellow in ) focused on the influence of different maximum pressure pmax = 0.2 pmax = 0.5
and pmax =1.2
during compaction to specific target thicknesses.
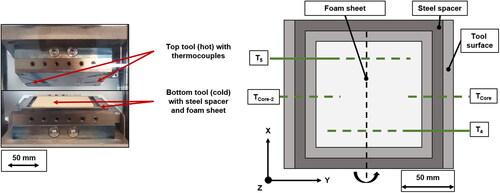
The test setup in the hot press as well as a schematic for positioning thermocouples in the process are shown in . Before starting a test group, the top tool was heated to the target temperature; this temperature was held for 10 min to allow a homogeneous temperature distribution. Additionally, the effective temperature on the top tool surface was recorded during the processes T4 and T5—on two different positions as well as the temperature TCore within the center of the initial thickness—during the process, the top tool moves closer to this position. The foam is turned upside down in between both process steps to produce a polymer skin on the second side. The rotational axis is displayed as a dotted line in . This leads to the foam being in contact with the same regions of the top tool and both T4 and T5 being recorded at equal spots of the foam—within a reasonable range of certainty.
Figure 8. Test setup in hot press (left) and placement of thermocouples (right).
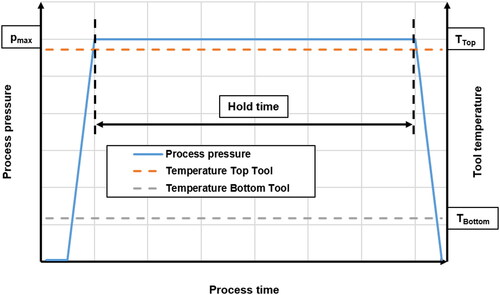
The schematic for the press program is shown in . The general outline was the same for different parameter combinations. The process starts after applying a pre-load of 50 N to the foam sample. This pre-load is held for 5 s, after which the pressure should be increased to the maximum process pressure pmax within a time span of 5 s. Hold time starts then for a defined period of time. The process is concluded by decreasing the pressure. The temperature within both the top and bottom tools remain unchanged during the course of the process. The maximum compaction in each process step was limited by using steel spacers to allow reproducible target thicknesses after each of the two hot press process steps. The setup of the steel spacers was prepared in such a way, that maximum compaction—difference between thickness before and after the process—in both process steps are equal. The effective pressure that is applied to the foam sheet cannot be calculated definitively when both tool halves are in contact with the steel spacer. Therefore, the course of the foam compaction is evaluated—especially the compaction speed based on the recorded process data—to analyze and understand the impact of process parameters applied to the foam in these experiments.
Figure 9. Process schematic for pressure and tool temperature in press program software.
shows an exemplary comparison of the course of process pressure (target values vs. recorded): The relative compaction based on the total compaction applied in this particular process step and the compaction speed with a link to the relative compaction, dividing it into regions of compaction speed smaller or greater than 2 The overall compaction and its speed might vary, depending on the specific combination of chosen parameters, shown in . The individual processes will be differentiated by maximum compaction speed as well as the relative compaction—normalized to the maximum compaction that has been applied to the foam for speeds greater than multiples of 2
− 2, 4, 6
up to 12
The relative compaction in each section will be compared between the different test series and connected to the resulting bending properties.
Figure 10. Exemplary comparison of process pressures—target values vs. recorded—(top), relative compaction (center), compaction speed during the process (bottom).
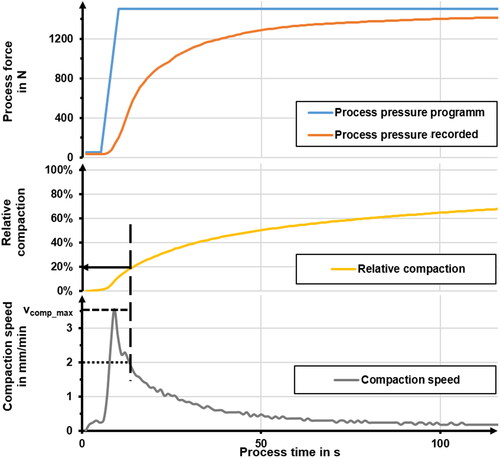
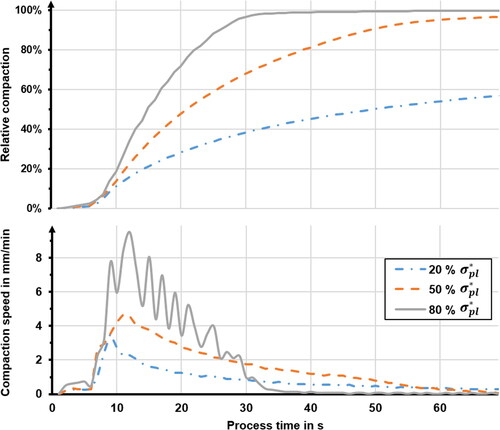
Figure 11. Exemplary comparison of relative compaction (top) and compaction speed (bottom) for different pmax at tool temperatures of 230 °C.
Determination of structural foam density
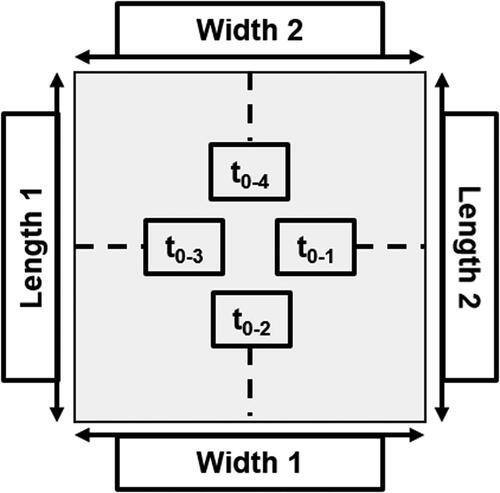
Foam specimens with dimensions of 100 × 100 mm2 have been cut from the standard-size foam slab (2400 × 600 mm2). The weight of the foam sheet and its dimensions have been measured using a laboratory scale and caliper. The length and width of the panel have been measured twice. Foam thickness t0-i has been measured at four points on each side of the panel. The effective density was determined based on these measurements. The compaction changes the overall density of the structural foam. Measurements of these dimensions after the manufacturing of both polymer skins allow for determining the structural foam density with EquationEq. (12)(12)
(12) ().
(12)
(12)
Figure 12. Measurement of foam sheet dimensions.
Examination of bending properties of structural foams
Bending properties of the manufactured structural foams have been examined in three-point-bending tests according to DIN EN ISO 178. The schematic test setup is shown in .
Figure 13. Schematic for three-point-bending tests [Citation33].
![Figure 13. Schematic for three-point-bending tests [Citation33].](/cms/asset/cecf1eb8-22e1-4878-b05e-337c4c3875ac/yadm_a_2269021_f0013_c.jpg)
The test specimens were of dimensions (lpart × b) of 80 × 15 mm2, with different thicknesses between 2 and 5 mm. Crosshead speed was 2 mm/min. Support lengths for bending tests are given in . Three specimens were tested per produced structural foam sheet to compensate for inhomogeneities within the manufactured structural foams. The position of each specimen within the structural foam sheet is presented in . The specimens were all placed in the test setup with a consistent orientation so that the first produced skin was on top. Bending tests are performed up to a maximum deformation of 8% or until a force drop of more than 30% occurs, compared to the maximum force of the particular test.
Figure 14. Schematic for specimen preparation per individual foam sheet.
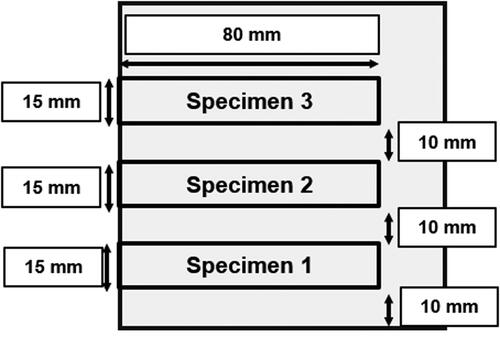
Table 4. Support length for different part thicknesses.
The characteristic property of bending strength can be calculated with EquationEq. (13)(13)
(13) as the maximum value of bending stress
during testing [Citation33]:
(13)
(13)
The bending strain is calculated with EquationEq. (14)
(14)
(14) by using the deflection s of the part as [Citation33]:
(14)
(14)
Bending modulus EB is calculated with EquationEq. (15)(15)
(15) as the secant gradient for bending stress for bending strains between 0.25% and 0.75%. Using both the bending stress
and the bending strain
the bending modulus of the part is calculated as [Citation33]:
(15)
(15)
Optical examination of foam structure
The change in foam structure was analyzed on micro-sections by using a Leica DM6000M microscope with the associated software tool. The specimens are chosen based on their specific performance during the three-point bending test. The microsection is cut from the specimen after the test. The change in foam structure and its effect on the bending properties will be compared together with the corresponding characteristic values—both poor and good performance.
Simplifications and adaption of theoretical models
The models that are chosen for the prediction of both foam structure and its bending properties use several simplifications. One of those is the assumption that the foam cells in the polymer skins are fully compacted and polymer density is achieved. The other is that the residual foam core remains unaffected. Its density and mechanical performance are assumed to be equal to those of the semi-finished foam. A possible density gradient is neglected for initial considerations.
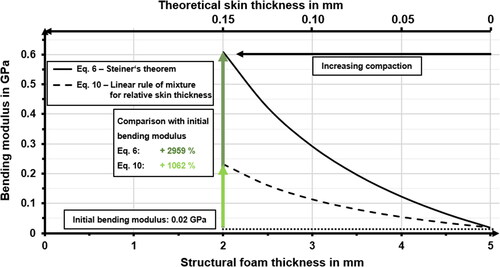
presents a comparison of the theoretical moduli calculated by using the selected models. The figure reveals a vast difference between the values predicted by each model. Both models predict increasing bending moduli when polymer skins are produced—an increase of 1060% for EquationEq. (11)(11)
(11) and an increase of 2960% for EquationEq. (6)
(6)
(6) .
Figure 15. Comparison of theoretical bending moduli based on selected models.
EquationEquation (16)(16)
(16) for bending modulus EB and EquationEq. (17)
(17)
(17) for bending strength
are adapted versions of the linear rule of mixture based on relative skin thickness Eq. (11) with the additional factors C1 and C2 being introduced to account for inhomogeneities and therefore reduced performance of the produced polymer skins. The models are initially compared to the measured values without weighting by the factors (C1 = C2 = 1). The model with best agreement will be adapted further. The values of these correction factors will be determined empirically in a second step to increase agreement.
(16)
(16)
(17)
(17)
Results and discussion
Isothermal quasi-static compression test
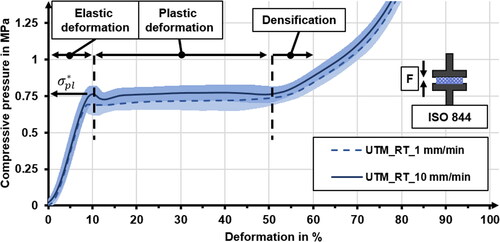
The compressive behavior of Divinycell F50 has been investigated in isothermal quasi-static compression tests. These tests have been performed to identify compressive yield strength at room temperature as reference values for process pressure selection as well as a means of comparison of the influence of both increasing temperature and increasing crosshead speed on the stress–strain-curves. shows the stress–strain-curves for compression at room temperature recorded on UTM with crosshead speeds of 1 and 10
While increasing crosshead speed shows a slight increase in compressive stress, this difference is not significant, and the standard deviation of both curves overlaps. Compressive strength has been identified as
= 0.75 MPa with a strain of 10% and has been used to compare the maximum process pressure. The plateau for plastic deformation extends up to a strain of 50%, at which densification begins.
Figure 16. Quasi-static compressive behavior of Divinycell F50 at room temperature.
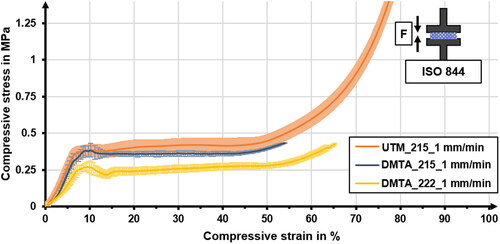
shows a comparison of stress-strain curves on UTM and DMTA at 215 °C to validate that tests conducted on both machines are comparable. Compressive stress during plastic deformation on UTM was slightly higher than on DMTA. However, these differences are not significant and can be attributed to a general difference in test machine design and dimensions of tested foam specimen square and cylindrical. With temperatures increasing further toward Tg, compressive stress decreases further, as depicted with the stress–strain curves recorded at 222 °C. Both tests methods can be used to compare the compressive behavior of this foam qualitatively.
Figure 17. Quasi-static compressive behavior on Zwick at 215 °C and on DMTA at 215 and 222 °C.
presents compressive stress-strain curves for different temperatures recorded with a crosshead speed of 1 Compressive stress during plastic deformation decreases with increasing temperature. This behavior can be generally attributed to thermoplastic polymers. The characteristic stress-strain curve consisting of distinct sections for elastic and plastic deformation as well as densification can be identified for increasing temperatures, including Tg. A definite differentiation between an elastic and plastic deformation cannot be determined if temperatures are increased beyond Tg. Stress-strain curves recorded at 240 °C show almost no stress before the on-set of densification.
Figure 18. Influence of temperature on quasi-static compressive behavior at a crosshead speed of 1 mm/min.
shows a comparison between the stress-strain curves at both crosshead speeds and for different temperatures. Stress-strain curves recorded at equal temperatures have been grouped in pairs, but the beginning of each pair has been spread out to allow for a better comparison. A comparison of compressive strengths determined for the different temperatures is presented in . The table also shows compressive strengths in relation to the values measured at room temperature. The most important influence is that of the increasing temperature. When the temperature is increased the compressive strength decreases. However, the characteristic behavior of PES allows the foams to show high strength even when temperatures approach the onset of Tg at 205 °C. Compressive strength for 180 °C is still at 75% compared to RT, with neglectable change 72% when temperature is increased to 200 °C. Even at Tg the foam reveals a compressive strength that represents 44% of the value at room temperature. The comparison also shows that stress–strain curves for temperatures within the range of Tg demonstrate compaction speed-dependent behavior. This behavior leads to higher compressive stresses in tests conducted with 10 compared to 1
Figure 19. Influence of crosshead speed on compressive behavior at different test temperatures.
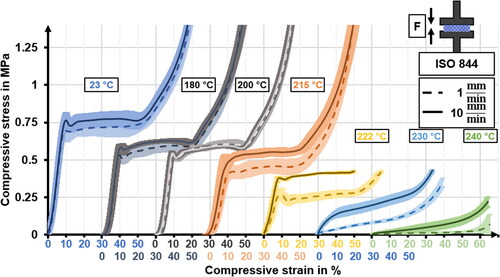
Table 5. Compressive strengths determined for different temperatures.
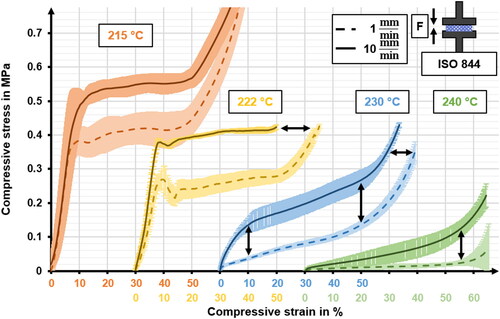
shows an enlarged excerpt of , focusing on the compressive stress-strain curves for elevated temperatures between 215 and 240 °C. Increasing crosshead speed at 215 and 222 °C, i.e. Tg, primarily leads to increased stress at which the plateau for plastic deformation manifests. Both curves follow a similar course during elastic deformation, diverge, develop two distinct plateaus, and then approach each other after the onset of densification. When the temperature is increased beyond Tg the stress strain curves depict a more pronounced compaction speed-dependent behavior, which is displayed for 230 °C. For instance, the stress for both crosshead speeds could be compared at a strain of 10%. For a crosshead speed of 1 mm/min, the average stress is 0.04 MPa, at the same time, the average stress for 10 mm/min is 0.14 MPa. The standard deviation for recorded stresses starts to fan out when deformation is increased beyond 10%. At the onset of densification, approximately 50% of the stresses for 10 are twice as high as for 1
−0.28 MPa compared to 0.14 MPa. The influence of crosshead speed becomes less pronounced when the temperature is increased to 240 °C. The stresses that are recorded for both crosshead speeds decrease further. Stresses increase steadily with increasing deformation for 10
while a noticeable increase in stresses for 1
can only be recorded after the onset of densification.
Figure 20. Influence of crosshead speed on compressive behavior at elevated temperatures.
The general effect of increasing temperatures is that compressive strength decreases. This is advantageous for the objective of local compaction and an increase in density to produce polymer skins. On the other hand, the general effect of increasing crosshead speed can be described as higher stresses being presented by the material during compaction. Densification of foam cells with an exponential increase in stress starts earlier, leading to cells being less densely packed. This behavior presents several challenges concerning the local compaction of foam cells within a thermoplastic foam. A temperature gradient develops inside the foam when it is in contact with the hot tool. Compaction applied by the hot press occurs at the same time. If we assume that two foams are being compacted with identical process setups, except for the compaction speed, then the compaction speed-dependent behavior during compaction at higher speeds results in a wider skin area with a lower density. At 1 the layers at 240 °C are compacted by 60% and enter densification before the 230 °C layer sees considerable stress. These layers are then compacted by 65% before the 222 °C layer is plastically deformed. At 10
the layer at 240 °C is only compacted by 55% before the 230 °C enters an area; that could be compared to the characteristic plastic deformation area. It is the only one that is compacted by 60% before plastic deformation begins in the 222 °C layer.
Even though greater compaction speeds vcomp lead to higher stresses being withstood by the individual layers, they also lead to earlier plastic deformation of the next layer at lower temperatures. A lower density in the skin would also imply a lower mechanical performance. Therefore, it might be advantageous to only compact the cells immediately at the foam surface. Counter-pressure would then be applied to the residual foam at temperatures below Tg, and compaction is carried out layer by layer. The initial foam structure remains intact as long as possible to benefit from its excellent thermal insulation properties. The discussed comparison is obviously greatly simplified but should allow a qualitative comparison.
Influence of process parameters on foam compaction
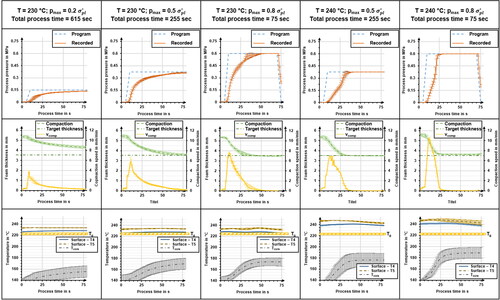
The influence of process parameters will be compared based on process data being recorded during structural foam production. shows a compilation of selected data derived from the recorded process data. The most notable difference in material behavior can be observed for test series with a target thickness of 2 mm and a respective compaction of 1.5 mm in each process step. These test series will be discussed in-depth in the following sections. shows a comparison of pressure, structural foam thickness, compaction speed, and different temperatures recorded during the hot press process being conducted with selected process parameters and a target thickness of 3.5 mm.
Table 6. Comparison of characteristic values derived from process data.
The first row shows the curves for the press program and the effective pressure recorded during the process. It can be seen that the effective pressure curves show a delay compared to the target values. This can be attributed to the general pressure control in the press. The program detects a difference between the program and effective pressure and rotates the electromechanical cylinder to apply pressure. The rotational movement is slower compared to conventional press setups with a hydraulic press cylinder and immediate pressure application. However, this behavior of the electromechanical cylinder facilitates the comparison of different compaction speeds.
The second row shows the curves for compaction and the associated compaction speed, with which the cylinder closes the gap between the tools. The foam is compacted by this motion, either until it withstands the pressure itself—the curves generally show a degressive behavior—or until the tool-halves are both in contact with the steel spacer—the compaction stops immediately. The effective pressure loaded on the foam cannot be calculated reliably at this point. For this reason, the compaction will be compared based on the applied compaction speed.
The third row depicts a comparison of temperatures recorded at the interface between foam and the hot tool. For a target temperature of 230 °C the effective temperature for T4 is slightly lower—an average of 225 ± 1.5 °C across all test series—while T5 shows an average temperature of 231 ± 1.4 °C. A similar behavior can be described for a target temperature of 240 °C. T4 generally shows lower temperatures—an average of 238 ± 2 °C—while T5 shows slightly elevated temperatures of 243 ± 2.7 °C. The last set of recorded data is the temperature in the foam core. Even though the data reveals a high standard deviation indicating temperatures of up to 200 °C, the temperature never surpassed the onset temperature of glass transition. This implies that deformation might occur but was limited due to high compressive strengths—still showing more than 70% compared to room temperature—even for these elevated temperatures.
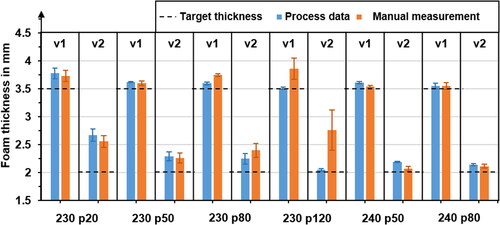
presents a comparison of foam thicknesses derived from both process data and measurements of the specimen between process steps. The presented data is taken from a test series with a target compaction of 1.5 mm in each step—5 mm to 3.5 mm to 2 mm. The first thing that stands out is that not every parameter combination allows achieving the target compaction—especially at 230 °C with pressures of 20 and 50% of the compressive strength. This can be confirmed by both process data and the foam thickness measured after each process step. Another characteristic is that the foam still shows recovering behavior at 230 °C for both 80 and 120%. While process data show that there has been contact between the top tool and steel spacer, the measurement of the specimen outside the tool showed a higher thickness—especially for the test series with a 120% pressure level. This thickness also showed a higher standard deviation. One explanation for this behavior might be that the total process time of 75 s at a maximum tool temperature of 230 °C might not be long enough to compact the foam cells completely. However, it seems sufficient to increase the tool temperature to 240 °C to achieve more reproducible compaction with less pronounced relaxation during an equal total process time.
Figure 21. Comparison of foam thickness based on process data and manual measurement.
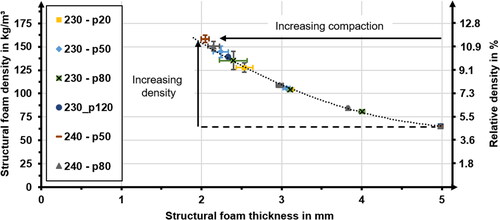
The process reduces the thickness of the cellular material. Since no material has been cut or removed from the sample this means, that the overall density of the structural foams increases with increasing compaction. The initial foam density for a thickness of 5 mm was determined to be 65 Compaction to a target thickness of 2 mm increases the average density to 163
which corresponds to 11.9% of the polymer density. The effective densities for the manufactured structural foams are based on their thickness after the second compaction step. These values are displayed in . The change in overall density only depends on change in foam thickness and is therefore of process influences. However, it may be that the process influences the specific density gradient across the foam cross section and therefore impact the mechanical performance of the structural foam. This will be investigated in the following sections of the manuscript.
Figure 22. Structural foam density for different test series.
presents a comparison of average surface temperatures—T4 and T5 as well as the maximum values for the core temperatures Tcore. The values measured for T4 are generally lower than those measured for T5. T4 showed 225 ± 1.5 °C on average for a target temperature of 230 °C. T5 showed on average a temperature of 231 ± 1.4 °C. The values measured for T4 reveal an overlap with the range for Tg—this has to be considered together with the compaction speed dependent behavior in this temperature range. For a target temperature of 240 °C the average temperatures for T4 are 238 ± 1.9 °C and 243 ± 2.7 °C for T5. Another fact, that has to be considered is, that the maximum core temperature in the second press process is generally lower than its counterpart recorded during the first process. This is due to the change in heat flux through the material and its reduced thickness ().
Figure 23. Comparison of surface and core temperature for different parameter combinations.
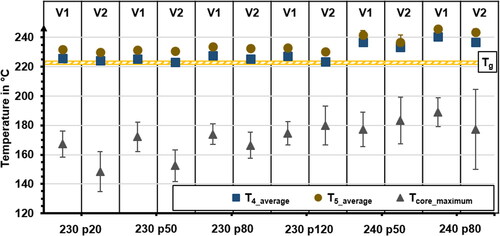
Figure 24. Comparison of pressure, compaction, and temperature progression during a hot press process.
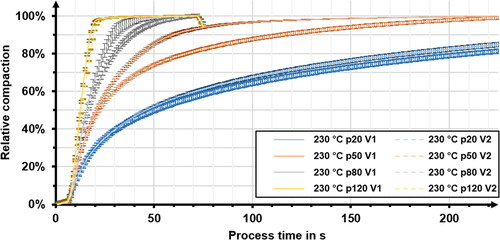
presents a comparison on how maximum process pressure influences the compaction of the foam for a tool temperature of 230 °C. The general course can be described as a degressive curve. This is based on the foam showing greater resistance with increasing compaction and the press reducing compaction speed due to a smaller gap between target pressure and effective pressure. The compaction speed is higher, when the gap between program and effective pressure is great. The comparison between the process step for the production of the first and second skin – V1 and V2—shows, that the second process step shows delayed compaction. This is most pronounced for the p50 tests, where both curves start to diverge at 60% of total compaction. This might be explained by reduced thickness in the second process step and the change in overall heat flux through the material. This might restrain the high temperature area within the foam closer to the interface of the foam and the hot tool. The curves also show, that the target compaction for p80 and p120 might be reached after 50 and 30 s, respectively, allowing a presumed hold time at this thickness of 20 s and 40 s. This indicates, that process time for this temperature should at least be extended to 100 s to further investigate the effect.
Figure 25. Relative compaction over time for different maximum pressures at 230 °C.
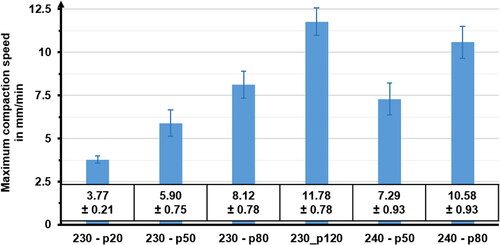
depicts data for the maximum compaction speed for the different test series. The data shows a high variance in speeds being applied to the material, ranging from maximum speeds of 3.77 up to 11.78
The data also reveals a certain degree of overlap between compaction speeds between both tool temperatures—i.e. 230 °C p80 and 240 °C p50. This should allow comparison across the temperature range, that is covered in this study.
Figure 26. Maximum compaction speed during skin production.
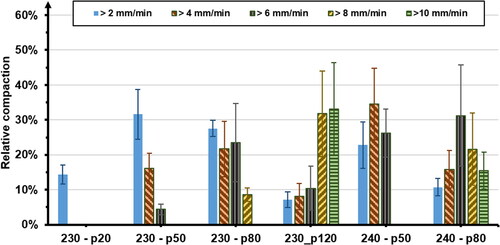
shows the distribution of relative compaction for different ranges of compaction speeds. The relative compaction describes the ratio of the speed-specific compaction to the total compaction of this process step. The distribution among the different ranges varies progressively with increasing maximum speed—which again depends on specific temperature and maximum pressure combinations. At a temperature of 230 °C the compaction for the 120% pressure test series is distributed fairly uneven with an average of 65% being compacted with a compaction speed of more than 8 while 73% of the total compaction are being compacted with less than 6
for the 80% pressure test series. The 80% pressure test series at 240 °C shows a bell-curve-like distribution with a peak of 31% being compacted with a speed of more than 6
22% with more than 8
while only 16% are each located in the region of speeds greater than 4
and 10
Figure 27. Relative compaction for different compaction speed ranges.
This chapter can be concluded by a summary of the following observations:
The maximum compaction is limited by the particular parameter combination—especially noticeable for 230 °C with 20 and 50%. This foam behavior led to the result, that the target compaction of 1.5 mm could not be achieved during the process time. Even extended process times of up to 10 min per process step did not allow achieving this compaction.
The foam shows a relaxation behavior for some combinations of the low temperature level, high compaction speed and short process time—i.e. 230 °C and 75 s. The process time for this temperature should be extended to identify the necessary time span to avert relaxation and expansion after the process. An alternative to increasing process time is increasing process temperature.
A similar, albeit reduced relaxation behavior was also identified for the tool temperature of 240 °C. An increase of total process time beyond 75 s should suffice to avert relaxation.
Influence of process parameters on bending properties in structural foams
Effective bending properties determined during three-point-bending
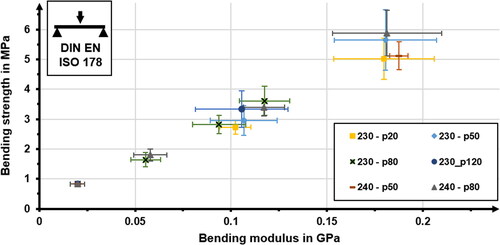
The influence of the transformation of semi-finished thermoplastic foam into structural foams will be discussed based on the change in bending modulus, bending strength, and strain, at which the bending strength occurs. shows a comparison of bending moduli determined for structural foams being manufactured in the different test series. The bending modulus increases for the entire set of test series with increasing compaction. It seems that the influence of the process parameter is less pronounced for compactions of up to 1 mm in each process step. The bending moduli of the different test series start to diverge when compaction is increased beyond this threshold. Two test series in particular reveal a deviation, both of them at a tool temperature of 230 °C with higher pressure levels—p80 and p120. They do not show a significant increase in bending modulus for a thickness of 2.4 mm compared to the set of data recorded for 3 mm. The other parameter combination shows increases of up to 80% compared to the 3 mm data set. The highest increase in bending modulus was determined for the test series 240—p50 with 0.19 GPa compared to the raw material with a bending modulus of 0.02 GPa. This results in a ratio of 9.42 and a relative increase of 842%.
Figure 28. Bending moduli for structural foams.
A similar effect can be described for bending strengths. Compaction has a positive effect in general, but both test series 230 °C p80 and p120 again show lower effective strengths compared to the rest of the test series with similar thicknesses. The highest increase was determined for the 240–p80 test series with 5.87 MPa compared to the raw material with 0.82 MPa, resulting in a ratio of 7.14 and a relative increase of 614%.
The results presented in and indicate that the process parameters indeed have an influence on the bending properties. Reconciliation of these findings with an appropriate theoretical model should facilitate the identification of suitable process parameters. The qualitative comparison of the values hints at a correlation between the bending moduli and the strengths. shows a comparison of the bending moduli and bending strengths determined for the different test series. This figure shows that there might be a correlation between both of those characteristic values. does not show any outliers, albeit showing a higher variance with increasing effective values. This also pertains to both test series 230 °C p80 and p120—that previously showed lower values compared to the other test series with similar thicknesses.
Figure 29. Bending strength for structural foams.
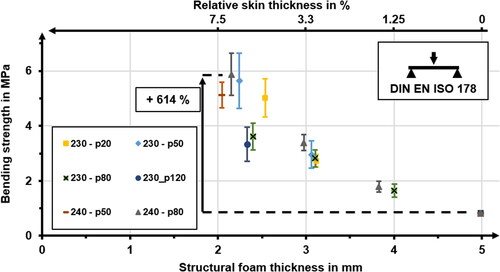
Figure 30. Relation of bending moduli and bending strengths in structural foams.
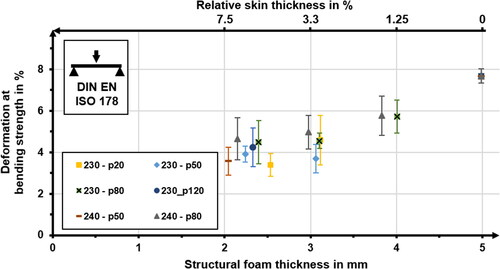
shows a comparison of the deformation at which the maximum bending strength occurs during three-point bending of structural foams. The influence of process parameters seems to be smaller for this characteristic compared to its influence on bending moduli and strengths. The deformation at which bending strength was recorded decreases with increasing compaction. The raw material did not have a pronounced bending strength; the stress–strain curve was steadily increasing, albeit degressively. Therefore, the bending strength was determined to be near 8%—the end of the test procedure.
Figure 31. Deformation at bending strength for structural foams.
Qualitative comparison of failure behavior in structural foams
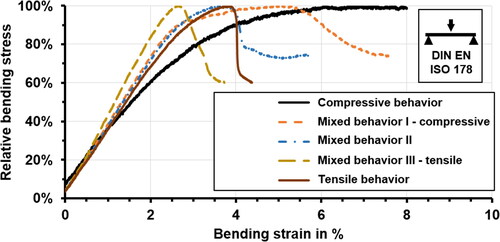
The overall behavior of the manufactured structural foams in three-point bending tests changed with increasing compaction. This led to different manifestations of stress–strain curves and failure mechanisms during testing. The influence of the transformation of thermoplastic foams into structural foams on selected stress–strain curves is shown in . Their qualitative course changes from a degressive course without a distinct maximum—described here as a compressive failure behavior—into courses with endpoints defined by a sudden drop-off in stress. This behavior occurs due to a rupture in the skin being loaded with tensile stresses. The first type of behavior mainly occurs in the raw material and in the structural foams with a thickness of 4 mm—i.e. low compaction and low skin thickness. The behavior changes with increasing compaction and skin thickness. The stress-strain curves also reveal types of behavior, that can be described as a mix of both tensile and compressive failure. The curves with a rather compressive behavior show a first plateau of higher stress and then shift into a lower stress plateau with different gradients. The behavior shifts toward tensile failure with increasing gradients and steeper slopes.
Figure 32. Qualitative comparison of different stress–strain-curves occurring during three-point-bending.
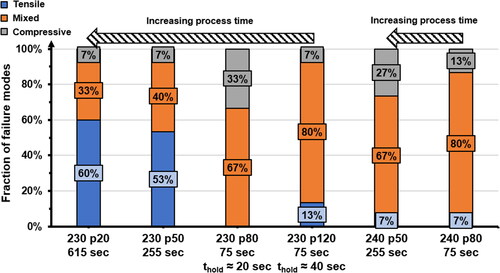
depicts the impact of increasing compaction in the development of failure behavior in structural foams being produced in the described hot press process. The most prominent change in behavior is, that the failure behavior shifts from the compressive behavior of the raw material toward a more tensile failure with increasing compaction and with increasing skin thickness. This change is most prominently portrayed for the test series
Figure 33. Impact of increasing compaction on qualitative failure behavior.
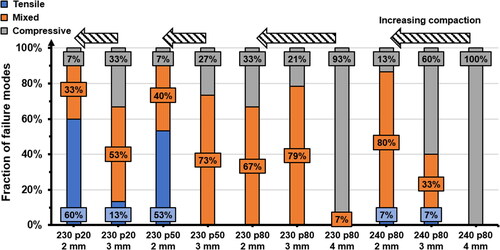
230-p20 at target thicknesses of 3 mm and 2 mm. The fraction of bending tests that ended in tensile failure increased from 13 to 60%.
A similar effect can be described for increasing process time—i.e. temperature exposure during compaction and skin formation (). The data presented is taken from a test series with the maximum compaction for each parameter combination. The samples displayed a failure behavior closer to a tensile failure with increasing process time and thus increasing temperature exposure during skin formation. As discussed in , the test series at 230 °C and maximum pressures p80 and p120 allow compacting the foam to the target thickness during the process. However, the hold time at minimum thickness for p80 of 20 s is lower than for p120 of approximately 40 s. The comparison in shows that the p120 test series has a higher fraction of samples that failed with tensile behavior. Therefore, it can be assumed that the hold time—duration for the minimal thickness has an influence on the manifested failure behavior.
Figure 34. Impact of increasing process time on qualitative failure behavior.
Comparison of measured and theoretical values
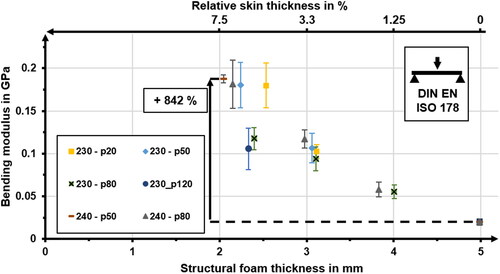
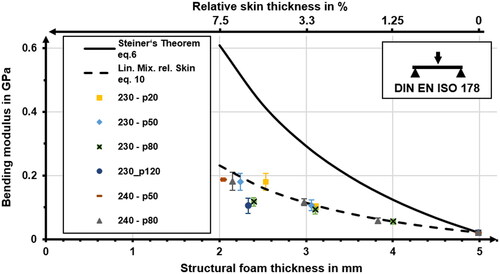
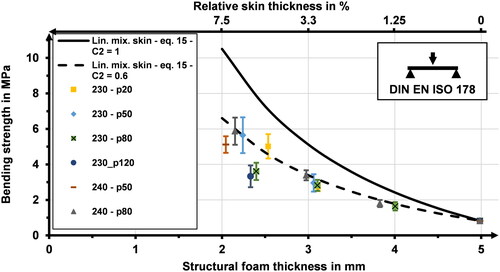
The selection of preferable process parameters for structural foam production is based on the comparison of measured values with values predicted by different theoretical models. shows the comparison of bending moduli with the values predicted by Steiner’s theorem—EquationEq. (6)(6)
(6) and the rule of linear mixture for skin thickness—Eqs. (11) and Equation(16)
(16)
(16) , with a value of C1 = 1. The values predicted with Steiner’s theorem overestimate the measured values in general. The difference between predicted and measured values leads to overestimations of up to 3.2—predicted values of 0.6 GPa and measured values of 0.19 GPa for 240—p50. However, the comparison of predicted and measured values clearly shows an adequate match of the majority of measured values with EquationEq. (11)—
(11)
(11) the rule of linear mixture for skin thickness.
Figure 35. Comparison of measured values with theoretical models.
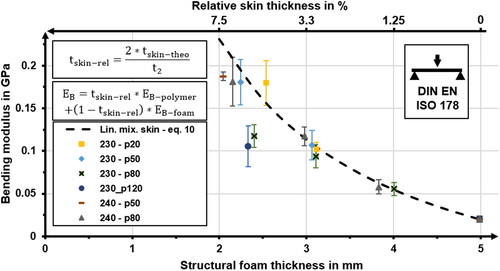
depicts a comparison of measured and predicted values for Eq. (11). The model allows prediction of the change in bending modulus quite well, with most sets of data showing overlap with the model within the standard deviation. However, two test series deviate quite strongly: 230 °C—p80 and p120.
Figure 36. Comparison of measured and predicted Equation(Eq. 11)(11)
(11) bending moduli.
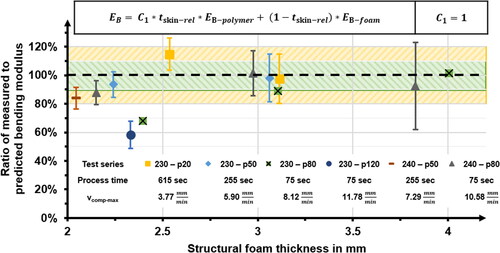
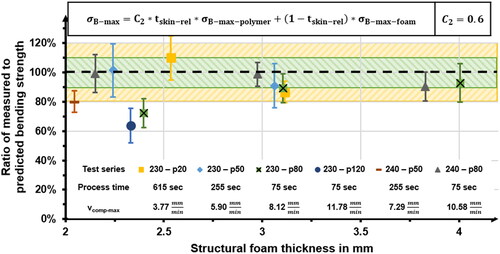
presents the ratio of the measured bending moduli to the values predicted by the linear rule of mixtures for skin thickness. Two areas were highlighted to represent deviations of more than 10% in green and 20% in yellow from the predicted values. The data legend is extended to include the total process time for each individual test as well as the maximum compaction speed applied during skin manufacturing. The comparison shows, that the influence of process parameters is most pronounced for compaction of more than 1 mm in each process step—with corresponding part thicknesses of less than 3 mm in this study. Most of the test series can be characterized as being predicted adequately with average deviations of less than 20%. Two test series that were discussed earlier 230 °C p80 and p120—show larger deviations and are significantly below their predicted counterparts with a reduction of 32 and 42%, respectively. This leads to the conclusions, that compaction speed has an influence that has to be taken into account, especially for a tool temperature of 230 °C. Its influence decreases, when the tool temperature is increased to 240 °C allowing compaction with similar speeds − 11.78 vs. 10.58
The 240 °C p80 test series only showed a deviation of 12% from the predicted value—a performance increase of 20% compared to its 230 °C counterpart. Additionally this test series showed a less pronounced relaxation behavior after the process. The best performance was achieved with the 230 °C p20 test series, albeit with some limitations. While bending moduli were on average 15% higher than predicted, the process design might not be preferable for efficient production. The maximum compaction that is possible with this temperature-pressure combination is significantly smaller than the target compaction—only allowing a compaction to 2.54 mm instead of the target thickness of 2 mm. Furthermore, a total process time of 615 s for one polymer skin might not be preferable, when predicted values can be achieved within 255 s.
Figure 37. Comparison of the ratio of measured and predicted bending moduli.
However, this model shows potential for the prediction of bending moduli in structural foams. Another promising feature of this model is, that it allows the prediction of bending strengths, unlike Steiner’s theorem. shows a comparison of the measured bending strengths with two sets predicted by EquationEq. (17)(17)
(17) . The first set is calculated by using a value of C2 = 1. This approach does not lead to adequate agreement between measured and predicted values—it overestimates the performance of the structural foams. Therefore, the value for C2 has to be adapted to allow better agreement between predicted and measured values. The second set of bending strength has been calculated with a value of C2 = 0.6, which led to better agreement.
Figure 38. Comparison of measured and predicted (EquationEq. 17(17)
(17) ) bending strengths.
depicts the ratios for measured and predicted bending strengths being calculated with a correction factor of C2 = 0.6. The figure shares many similarities with , which are based on the manifestations of bending modulus and strength (which have been discussed previously).
Figure 39. Comparison of the ratio of measured and predicted bending strengths.
A comprehensive overview of measured and predicted values is presented in . The effective bending properties are supplemented with their relative distance to the theoretical values calculated with EquationEqs. (11)(11)
(11) and (Equation17
(17)
(17) ) with the value of C2 = 0.6.
Table 7. Comparison of measured and predicted values for bending properties.
Optical analysis of foam structures
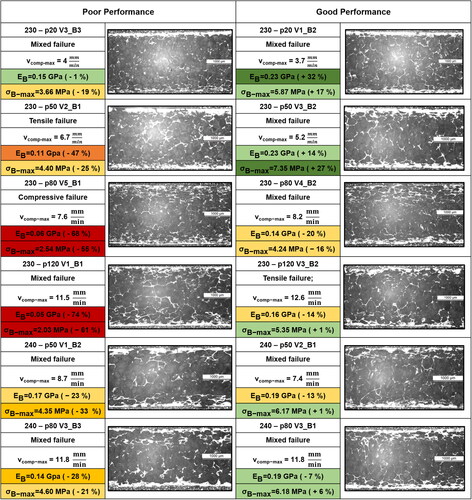
This chapter discusses the structure of structural foams based on the manifestation of polymer skins and the corresponding bending properties. The considered specimen were selected based on their particular performance – both good and poor—during three-point-bending tests. compares the effective performance of structural foams with their structure, determined on microsections. The figure combines data for selected structural foams including effective bending moduli and bending strengths, maximum compaction speed and the failure behavior derived from the stress-strain curve. The effective bending properties are supplemented with their relative distance to the theoretical values calculated with Eqs. (11) and (Equation17(17)
(17) ) with the value of C2 = 0.6. The displayed microsections only show an excerpt of the structural foams width—approximately 5 mm wide out of a total width of 15 mm. The microsection was cut directly from the sample after three-point-bending tests.
Figure 40. Comparison of performance and structure for structural foams manufactured with different process parameter sets.
The figure shows one of the biggest challenges regarding foams as a cellular material. The material distribution within the foam is highly randomized due to different cell sizes and cell wall thicknesses. This leads to a high variance in skin thicknesses within structural foams, which are discussed in this study.
The polymer skin is produced through compaction of foam cells and fuzing of cell walls and membranes. The determination of skin thickness is quite challenging because skin formation on the core side does not always occur in a homogeneous fashion and can therefore be quite jagged. Even if a thickness is determined on theses microsections, it is not known, if the density in this polymer skin is indeed that of the polymer. If the skin thickness were higher than the theoretical value, its density would then be lower than the polymer density. However, the manifestation of the polymer skins might offer some insight in the structure-property relationship in structural foams.
The comparison of the first two structural foams manufactured in the 230 °C p20 test series show, that it is possible to produce quite thick polymer skins. This qualitative manifestation of the polymer skin can also be confirmed for the microsections prepared for the 230 °C p50 series. However, the variance in effective bending properties reveal, that prediction for a single specimen is quite challenging due to the highly randomized structure of cellular materials. The following two pairs show the effect of compaction with high speeds on the resulting foam structure. Homogeneous skins can be identified in some areas. Even though they are rather thin. The foam shows areas with affected foam cells—especially for 230 °C p80 V4_B2—in which a wide area was compacted without being fused together.
However, the development of polymer skins and the effective foam structure does not always allow conclusion to the performance during testing. The samples investigated for the 240 °C p80 test series were taken from the same structural foam sheet, but show varying performance and structure. The upper skin in the first microsection seems to have a thin skin right at the surface, followed by an area of moderate width with increased density.
The lower skin seems to be thicker than the upper skin but has developed in a more jagged fashion. The upper skin in the second microsection shows a similar manifestation compared to the first microsection, albeit more compacted. The lower skin seems to be more homogeneous toward the foam core than the one in the first microsection, but shows some inhomogeneities in form of recognizable compressed foam cells.
Discussion
The comparison of the effective bending properties with their theoretical counterparts also allows the determination of preferable process parameters—especially tool temperatures and compaction speeds. The majority of machinery for hot press processes is equipped with hydraulic press units. This setup allows immediate pressure transmission but offers limited compaction speed control. Therefore, it might be preferable to choose parameter combinations, which allow achieving optimal bending properties with high compaction speeds.
The results of this study show, that the foam tolerates higher compaction speeds for tool temperatures of 240 °C without substantial reduction in both bending modulus and strength. Short process times are preferable, when economic and ecological considerations influence the process design. An optimal process design derived from this study might be located in between the test series 240 °C p80 and 240 °C p 50. The main difference between both test series, besides the maximum pressure, is the total process time. Both allow adequate achievement of the target criteria—thickness, modulus and strength—however with small deviations. 240 °C p80 allowed best agreement between the measured and predicted values, but showed some relaxation behavior after the process. 240 °C p 50 allowed compaction closer to the target thickness, but showed greater reduction of the measured values compared to their predicted counterparts. A first suggestion for improvement would be to increase total process time for p80 from 75 to 135 s and investigate the effect.
Manufacturing processes with lower tool temperatures are possible—albeit with longer process times when compaction speeds can be limited allowing tool temperatures of 230 °C. The comparison of 230 °C p80 and 230 °C p 50 shows that the reduction of maximum compaction speed in combination with a longer total process time has a positive effect on the structural foams bending performance. However, this requires a more sophisticated machinery setup.
Conclusion
This study investigated the effect of process parameters on the performance of structural foams in three-point-bending tests. The structure is changed from a homogeneous low-density cellular foam into a structural foam. This structural foam has polymer skins of higher density. Skin thicknesses were modeled by a linear rule of mixture, based on the relative foam density and applied compaction.
Foam behavior was investigated in quasi-static isothermal compression tests following ISO 844 with different temperatures and crosshead speeds. The foam displayed a compaction speed dependent behavior for temperatures near Tg with higher stresses during plastic deformation for increased crosshead speeds.
Structural foams were manufactured in a two-step isochoric and isothermal hot press process. Process data sets were recorded during the manufacturing of structural foams to allow the analysis of the effective process influence on the foam. Comparison of the behavior in quasi-static tests and the effective process influence allowed investigating the change in foam structure for different tool temperatures and compaction speeds.
The performance of these structural foams was investigated in three-point-bending tests following DIN EN ISO 178. Two models from the established literature for the prediction of bending properties were compared to the measured values to identify a model suitable for adequate performance prediction. A rule of linear mixtures based on the structural foam relative skin thickness was determined to allow best prediction of the bending moduli. This approach also facilitates prediction of bending strength, albeit by incorporating a correction factor to account for reduced performance. Recommendations for a preferable process design were formulated for different manufacturing setups—hydraulic vs. electromechanical press cylinder.
However, the thermoplastic foam investigated in this study is a mere excerpt from the wide variety of available semi-finished thermoplastic foams. The validity of the bending performances predicted by this model needs to be confirmed in future studies. This can be achieved by transformating thermoplastic foams with different initial densities and thicknesses into structural foams with different thicknesses. These studies might also focus on investigating a model for the correction factor for bending strengths.
| Abbreviations | ||
| PEI | = | Polyetherimide |
| PES | = | Polyethersulfone |
| PVC | = | Polyvinyl chloride |
| EPS | = | Expanded polystyrene (EU) |
| XPS | = | Expanded polystyrene (US) |
| EPE | = | Expanded polyethylene |
| EPP | = | Expanded polypropylene |
| PET | = | Polyethylene terephthalate |
| TP | = | Thermoplastic polymer |
| Tg | = | Glass transition temperature |
| Tm | = | Melting temperature |
| sc | = | Semi-crystalline |
| a | = | Amorphous |
| UTM | = | Universal testing machine |
| DMTA | = | Dynamic-mechanical-thermal analysis |
| Symbols | ||
| Ecomp | = | Compressive modulus |
| = | Compressive strength | |
| = | Foam density | |
| = | Polymer density | |
| = | Relative foam density | |
| = | Theoretical skin thickness | |
| = | Relative skin thickness | |
| = | Initial thickness | |
| = | Thickness after two hot press process steps | |
| = | Bending modulus calculated with linear mixture | |
| = | Bending modulus calculated with Steiner’s Theorem | |
| = | Foam bending modulus | |
| = | Polymer bending modulus | |
| n | = | Exponent for relative foam density |
| log | = | Logarithmic function |
| = | Bending modulus predicted by Steiner’s theorem | |
| = | Polymer bending modulus | |
| = | Foam bending modulus | |
| = | Skin thickness | |
| = | Core thickness | |
| Bc | = | Adapted core modulus |
| t0-i | = | Thickness measurements at different positions |
| pmax | = | maximum pressure |
| TTop | = | Temperature upper tool |
| TBottom | = | Temperature bottom tool |
| T4 | = | Surface temperature 1 |
| T5 | = | Surface temperature 2 |
| Tcore | = | Core temperature |
| = | density after two hot press process steps | |
| = | Initial foam density | |
| F | = | Force |
| L | = | Length |
| l_part | = | Specimen length |
| t_part | = | Specimen thickness |
| = | Bending stress | |
| = | Bending strain | |
| s | = | Deflection under bending |
| C1 | = | Correction factor for bending modulus |
| C2 | = | Correction factor for bending strength |
Disclosure statement
No potential conflict of interest was reported by the authors.
Data availability
The data that support the findings of this study are available from the corresponding author, upon reasonable request.
Additional information
Funding
References
- Klempner D and Frisch KC, editors. Handbook of polymeric foams and foam technology. New York: Oxford University Press; 1991.
- Ma W. Sandwich structural composites: theory and practice. Milton: Taylor & Francis Group; 2022.
- BASF aerospace materials and technologies, “Ultrason ATP.” Available from: https://aerospace.basf.com/ultrason-atp.html
- Salmins M, Mitschang P. Bending properties of structural foams manufactured in a hot press process. Adv Manuf Polym Compos Sci. 2022;8(3):117–133. doi: 10.1080/20550340.2022.2077277.
- Thermoplastische Partikelschaumstoffe—Aktueller Stand und Perspektiven. Düsseldorf: VDI Verlag; 1996.
- Biernat U. BASF entwickelt weltweit ersten Partikelschaumstoff auf Basis von Polyethersulfon, Ludwigshafen [Internet]. 2018 Sep. Available: https://www.basf.com/global/de/media/news-releases/2018/09/p-18-312.html.
- Lee ST and Ramesh NS, editors. Polymeric foams: mechanisms and materials. Boca Raton: CRC Press; 2004.
- Zhang A, Wang J, Wang G, et al. Microcellular injection molded lightweight, strong and thermally insulating PP/fibrillated-PTFE composite foams with enhanced surface appearance. J Mater Res Technol. 2023;22:2933–2943. doi: 10.1016/j.jmrt.2022.12.160.
- Guo W, Yang Q, Mao H, et al. A combined in-mold decoration and microcellular injection molding method for preparing foamed products with improved surface appearance. Polymers (Basel). 2019;11(5):778. doi: 10.3390/polym11050778.
- Neitzel M, Mitschang P, Breuer U. Handbuch verbundwerkstoffe: werkstoffe, verarbeitung, anwendung. München: Carl Hanser Fachbuchverlag; 2014.
- Henning F, Moeller E. Handbuch leichtbau: methoden, werkstoffe, fertigung. München: Hanser; 2011.
- Gee G. The glassy state in polymers. Contemp Phys. 1970;11(4):313–334. doi: 10.1080/00107517008204410.
- Brown IG, Wetton RE, Richardson MJ, et al. Glass transition and thermodynamic state of densified polymeric glasses. Polymer. 1978;19(6):659–663. doi: 10.1016/0032-3861(78)90119-2.
- Affolter S, Ritter A, Schmid M. Interlaboratory tests on polymers by differential scanning calorimetry (DSC): determination of glass transition temperature (Tg). Macromol Mater Eng. 2001;286(10):605–610. doi: 10.1002/1439-2054(20011001)286:10 < 605::AID-MAME605 > 3.0.CO;2-Y.
- Hobbs SY. Predicting the flexural rigidity of thermoplastic structural foams. J Cell Plast. 1976;12(5):258–263. doi: 10.1177/0021955X7601200501.
- Wasserstrass JD, Throne JL. Flexure and cantilever bending of structural foam beams. J Cell Plast. 1976;12(2):98–103. doi: 10.1177/0021955X7601200204.
- Iida M, Gotoh M, Yokono H, et al. Flexural properties of moldings of rigid polyurethane made by reaction injection molding. Polym Eng Sci. 1986;26(10):701–707. doi: 10.1002/pen.760261009.
- Khakhar DV, Joseph KV. Optimization of the structure of integral skin foams for maximal flexural properties. Polym Eng Sci. 1994;34(9):726–733. doi: 10.1002/pen.760340905.
- Zhang Y, Rodrigue D, Ait-Kadi A. High density polyethylene foams. 4. Flexural and tensile moduli of structural foams. J Appl Polym Sci. 2003;90(8):2139–2149. doi: 10.1002/app.12824.
- Barzegari MR, Rodrigue D. The effect of density profile on the flexural properties of structural foams. Polym Eng Sci. 2007;47(9):1459–1468. doi: 10.1002/pen.20844.
- Throne JL. Stiffness models for thermoplastic structural foams: an observation [cited 1978 Jan]. Available: 10.1177/0021955X7801400102.
- Wu J-S, Yeh T-M. Studies on the flexural modulus of structural foams. J Polym Res. 1994;1(1):61–68. doi: 10.1007/BF01378595.
- Moore DR, Iremonger MJ. The prediction of the flexural rigidity of sandwich foam mouldings. J Cell Plast. 1974;10(5):230–236. doi: 10.1177/0021955X7401000505.
- Moore DR, Couzens KH, Iremonger MJ. The deformational behaviour of foamed thermoplastics. J Cell Plast. 1974;10(3):135–139. doi: 10.1177/0021955X7401000307.
- Iremonger MJ, Lawler JP. Relationship between modulus and density for high-density closed-cell thermoplastic foams. J Appl Polym Sci. 1980;25(5):809–819. doi: 10.1002/app.1980.070250509.
- Traeger RK. Physical properties of rigid polyurethane foams. J Cell Plast. 1967;3(9):405–418. doi: 10.1177/0021955X6700300906.
- Progelhof RC, Throne JL. Young’s modulus of uniform density thermoplastic foam. Polym Eng Sci. 1979;19(7):493–499. doi: 10.1002/pen.760190706.
- Sadik T, Pillon C, Carrot C, et al. Polypropylene structural foams: measurements of the core, skin, and overall mechanical properties with evaluation of predictive models. J Cell Plast. 2017;53(1):25–44. doi: 10.1177/0021955X16633643.
- Throne JL. Mechanical strength of Self-Skinning foams. J Cell Plast. 1972;8(4):208–210. doi: 10.1177/0021955X7200800407.
- Throne JL, Griskey RG. Structural thermoplastic foam? A low energy processed material. Polym Eng Sci. 1975;15(10):747–756. doi: 10.1002/pen.760151007.
- Diab Group. Divinycell F: technical data [cited 2020 June 01]. Available from: https://www.diabgroup.com/products-services/divinycell-pes/divinycell-f/.
- Material Data Center. Ultrason E 2010 NAT PESU BASF. [cited 2021 Jan 01]. Available from: https://www.materialdatacenter.com/mb/material/pdf/50618/50618/UltrasonE2010NAT.
- DIN EN ISO 178:2019-08, kunststoffe_-bestimmung der biegeeigenschaften (ISO_178:2019); deutsche fassung EN_ISO_178:2019. Berlin: Beuth Verlag GmbH; 2013.