
 ?Mathematical formulae have been encoded as MathML and are displayed in this HTML version using MathJax in order to improve their display. Uncheck the box to turn MathJax off. This feature requires Javascript. Click on a formula to zoom.
Abstract
Dry technical textiles tend to bridge when draping in concave areas or complex geometries such as internal corners. The extent of bridging is based on the spring-back of the textile. In this study, the value for the spring-back for dry technical textiles is defined and a method to quantify the spring-back value is proposed. An automated continuous draping process is presented based on manual lay-up and draping process of dry non-crimp fabrics (NCF) which is used in the production of rotor blade shells for wind turbine blades. This process provides the basis for the study of spring-back behaviours. Within this process, a triaxial NCF sample is manually laid-up on an L-shaped mould and then automatically draped onto the edge using a draping tool. A laser scanner records the draping result and bridging of the NCF sample. Test series show the influence of the process parameters such as drape speed and drape force on the spring-back behaviour. For the draping process under consideration, quadratic dependencies of these factors on the spring-back could be determined.
Disclaimer
As a service to authors and researchers we are providing this version of an accepted manuscript (AM). Copyediting, typesetting, and review of the resulting proofs will be undertaken on this manuscript before final publication of the Version of Record (VoR). During production and pre-press, errors may be discovered which could affect the content, and all legal disclaimers that apply to the journal relate to these versions also.1 Introduction
The use of fibre-reinforced plastics (FRP) has been increasing for years. Due to their good mechanical properties at low weight, FRP are mainly used for lightweight design in the aerospace, automotive, transport and wind energy industries [Citation1–3]. In the wind energy industry, the rotor blades of wind turbines are manufactured as FRP components. The geometry of rotor blades is largely determined by their aerodynamic shape due to the desired optimal energy yield [Citation4]. This results in geometrically complex areas (e.g. transition section [Citation5]). To reduce the rotor blade depth (distance from leading to trailing edge), flat trailing edges, the so-called flatbacks [Citation6], are used. These areas pose great challenges to manufacturing. As rotor blades are manufactured in small quantities and automation solution involve high costs, production of rotor blades are mainly carried out manually. The vacuum assisted resin transfer molding (VARTM) is usually used as the manufacturing process for rotor blades. In this process, a dry, near-net-shape reinforcement structure (preform) is first built up by lay-up, draping and fixing dry textile plies. In certain areas, balsa wood or foam cores are used to obtain a sandwich structure that is resistant to bending and buckling. Non-crimp fabrics (NCF) are particularly suitable for draping into complex geometries due to their good formability [Citation2, Citation7]. Triaxial glass fibre fabrics are often used for the shells of rotor blades [Citation1, Citation6]. The preform is then covered with a vacuum film, infused with a resin-hardener mixture under vacuum and consolidated to form the FRP component [Citation6].
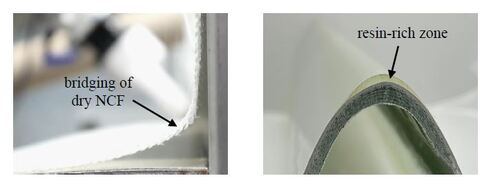
The quality of the preform has an influence on the subsequent processes and determines the quality of the finished FRP component to a larger extent [Citation8]. Thereby, the quality of the preform is in turn significantly influenced by the material properties, the geometry of the mould and the lay-up and draping process. A common problem during preform manufacturing is the bridging of textile plies over concave surfaces or internal corners (see , left). Bridging is mainly due to the bending stiffness of the textile plies. Cavities occur between the textile ply and the mould as well as the textile plies themselves during further lay-up [Citation9, Citation10]. During the evacuation of the vacuum build-up, the preform is pressed against the mould by the vacuum film. Slipping of the textile plies into the cavities is not possible with strongly curved surfaces [Citation9]. The cavities lead to an influence on the permeability [Citation11]. During the subsequent infusion, the resin will spread faster in the resulting channels (so-called race-tracking [Citation12]). During consolidation, resin-rich zones (see , right) and dry spots are formed in the later FRP component. Both resin-rich zones and dry spots have a negative impact on component quality. Due to possible delaminations in these areas, the mechanical properties of the FRP component will be negatively affected [Citation12].
Figure 1 Bridging of dry NCF in L-shaped mould (left) and resin-rich zone in a FRP component (right)
Bridging is addressed in various contributions. For example, Szcesny et al. [Citation13] describe the development of an automated tape laying process for unidirectional (UD) prepreg material. The bridging effect occurs in concave areas when the tapes are laid-up and draped. Lichtinger et al. [Citation14] attribute the detachment of the tapes in concave tool geometries to the insufficient tack of the tapes. Olsen et al. [Citation15] describe an automated tape laying process for the winding process. The process is intended for use with prepreg tapes. They also observe that with concave surfaces, the textile detaches from the mould due to residual tension, which can result in an unacceptable part. They further describe that the lay-up speed and the force of the tape head have an influence on the lay-up, at higher speeds they need more force for the same result. Thor et al. [Citation10] explain bridging as the cause for the occurrence of out-of-plane fibre waviness, delaminations and matrix voids in corner radii. Lightfoot et al. [Citation16] investigate wrinkling in laminates due to ply slippage during consolidation in an autoclave process. They describe a mechanism for ply slippage in a” U-shaped” tool due to shear forces between tool and ply as well as ply and ply. The unidirectional carbon fibre epoxy prepreg used is laid-up manually. The plies are laid-up in different directions. Depending on the orientation of the single ply, the direction-dependent stiffness changes and bridging of the layers takes place in the area of the radii. During consolidation, wrinkles are formed in plies that are not bridged, as these are pushed further into the edge by the bridged plies. The defects in the laminates were determined and classified for different lay-up sequences.
The state of the art shows that bridging of dry textile semi-finished products is investigated only sparsely. In the field of rotor blade production, binders are used during manual lay-up and draping to prevent or reduce bridging. The company Danobat [Citation17, Citation18] has developed an end effector and associated process for automated lay-up and draping. The process involves the application of binder prior to the lay-up and draping of the semi-finished textile products. From the known sources it can be seen that the process is suitable for laying-up semi-finished textiles in multi-curved moulds, but not for moulds with internal corners.
Hence, this study is aimed at investigating the influence of the process parameters such as drape speed and drape force on the spring-back behaviour and thus on the bridging of dry triaxial non-crimp fabrics in an automated draping process. For this purpose, a cut triaxial NCF sample (subpreform) is draped into an L-shaped mould by a draping tool without the use of binders. The draping result is then recorded with the help of a line laser scanner. To characterise the spring-back behaviour, the value for the spring-back (see , right) is introduced and used as the response variable.
2 Materials and methods
This section describes the material used for this study and the preparation of the samples. Subsequently, the spring-back for dry NCF and the automated draping process are presented. The section concludes with the method for calculating the spring-back value.
2.1 NCF used for the draping process
A triaxial NCF made of glass fibres 1Footnote1 is used to investigate the spring-back behavior. Within the framework of the research projects BladeMaker [Citation19] and BladeFactory [Citation20], this NCF is used for automated lay-up and draping in the preforming process of rotor blade components (e.g. shell halves [Citation6]). The triaxial NCF consists of three differently oriented UD layers that are stitched together with a yarn. The properties of the NCF can be found in . shows the two sides of the NCF. The 0∘ layer is the inner side and the -45∘ layer is the outer side of the material wound on the roll.
Figure 2 First layer (left) and third layer (right) of used triaxial NCF for the draping process, stitching parameters are listed in
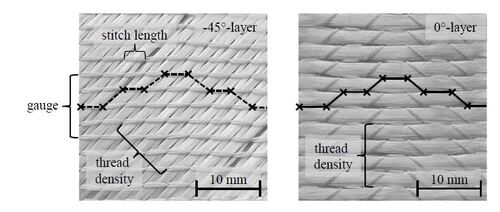
Table 1 Properties of used triaxial NCF
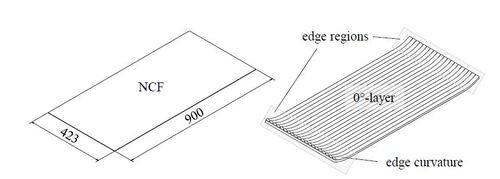
The samples used for the experiments have a length of 900 mm and a width of 423 mm (see , left). They are cut manually with the help of a roller cutter. Winding the NCF on a cardboard core creates stress conditions in the NCF after unwinding. Curvatures occurs in the edge areas across the roll (see , right). To minimise the influence of the pre-tension, the samples are stored flat for at least 24 hours.
Figure 3 Used sample geometry (left) and schematic representation of the edge curvature (right)
2.2 Definition of a value describing the spring-back behavior of dry NCF
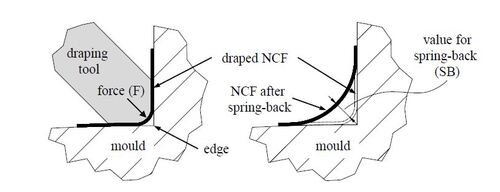
The spring-back effect is generally used in metal forming [Citation21] or for cured laminates (e.g. [Citation22, Citation23]). It describes the spring-back of metal after forming (e.g. V-bending) or the spring-back of reinforced plastics after demoulding. To quantify the spring-back effect, the difference between the desired bending angle and the angle after forming or demoulding is often used.
In this contribution, the value of the spring-back (SB) is used as the distance between the NCF during draping and the bridged NCF after draping in the direction of the edge. To investigate the factors influencing the spring-back behaviour, this value is set as the response variable (see ).
Figure 4 Draping of a dry NCF in a L-shaped mould (left), bridging after draping and value for the spring-back (right)
2.3 Automated draping process
The automated draping process uses a robot cell with an articulated robot arm, a mould and a draping tool. The mould, which is made from 2 mm sheet steel, is L-shaped with a curved horizontal flank. The horizontal flank has a width of 477 mm and a radius of 824 mm. The height of the vertical flank is 90 mm. The length of the mould is 1006 mm (see , left).
Figure 5 Used mould (left) and draping tool (right) for the automated draping process, all dimensions are given in millimetres (mm)
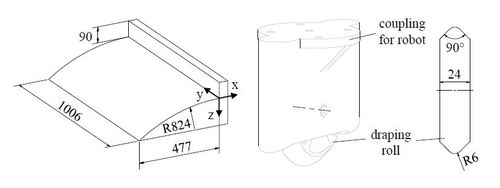
The draping tool is made from 3D printed PETG filament. It consists of a rotating wheel that can be mounted to the articulated arm robot. The wheel has an outer diameter of 106 mm and a width of 24 mm. It is bevelled at a 90∘ angle and rounded with a radius of 6 mm (see , right).
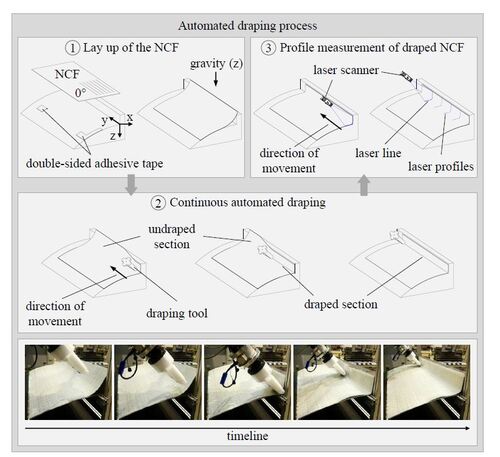
The automated draping process is shown in . One NCF sample is placed manually on the mould and fixed by double-sided adhesive tape at the positions shown (see , ①). This prevents the sample from slipping off unintentionally and ensures uniform positioning of the samples on the mould. Following the manual manufacturing process of wind turbine rotor blades, the 0∘ layer of the NCF is placed in the longitudinal direction of the L-shaped mould. In the test series, the NCF is oriented with the 0∘ layer facing upwards. Due to the mechanical properties (especially bending stiffness) of the triaxial NCF, it does not assume the geometry of the edge when laid up. Gravity only slightly deforms the NCF sample towards the edge, which is why further draping is necessary to achieve the near-net shape (see , ②). , ② shows the automated draping of the NCF sample. The draping tool moves into the edge at the beginning of the mould at a speed of 10 mm/s. After a dwell time of three seconds, the draping tool is continuously guided through the mould in the longitudinal direction and drapes the NCF once. After draping, the draping tool on the articulated robot arm is exchanged for a laser scanner to scan the surface of the draped NCF along the mould (see , ③). A laser profile is taken at every millimetre.
Figure 6 Automated draping process
Based on previous experience in the field of automated draping of dry NCF, it can be assumed that there are additional factors that can have a decisive influence on the spring-back behaviour compared to manual draping [Citation19, Citation20]. shows the influencing factors of the draping process on the response variable. The factors of the draping tool and the robot replace the human-induced influencing factors in manual draping.
Table 2 Factors influencing the bridging of dry NCF in an automated draping process (bold: variable factors, italic: varying factors and normal: constant factors)
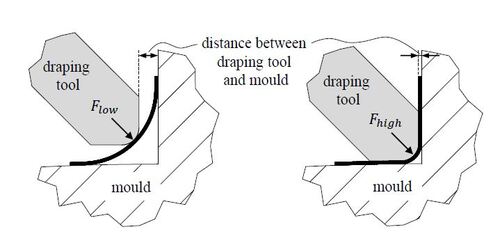
In this paper, the influences of velocity (v) and force (F) on the spring-back behaviour are investigated. The velocity represents the traversing speed of the Tool Center Point (TCP) of the articulated arm robot during draping (here in y-direction), which is equal to the drape speed. The force implies the drape force acting on the NCF sample in the z’-axis (see and ). The position of the draping tool varies for different forces. With small forces there is a bigger gap between draping tool and mould. The NCF is less severely deformed (see ). The constant factors (see ) are not changed. The varying factors are considered in the error analysis. The biggest source of error of the chosen draping process is the lay-up of the NCF sample on the mould. To prevent this error, special care is taken to ensure that the samples are cut identically. Markings are made on the mould to enable identical positioning of the samples. Furthermore, the samples were laid up by the same person.
Figure 7 Schematic illustration of different drape force states
2.4 Calculation of the spring-back value
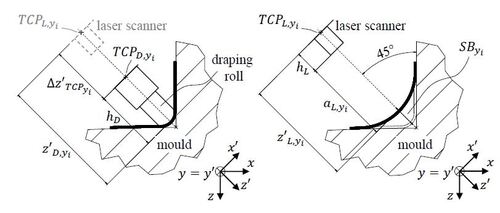
The calculation of the spring-back value is based on the distance measurement of the line laser scanner. The laser scanner is at a 45∘ angle to the mould. The z’ axis (see ) runs through the edge of the mould. The distance between the edge of the mould and the laser scanner in the z’ direction is therefore the maximum distance. Both the laser scanner and the draping tool lie in the z’ axis of the TCP of the articulated robot. Due to the process, the draping tool and the laser scanner are not used simultaneously. Since the coordinates of the articulated robot are known, a theoretical distance value of the laser scanner can be calculated for the draping tool at each draping position.
Figure 8 Illustration of variables to calculate the spring-back during draping (left) and surface scanning (right) for a profile cross section (for the origin of the coordinate system see )
The calculation of the values for the spring-back is done with the help of the coordinate values of the TCP along the y-axis. For the laser scanner, the vector results, where only
changes according to the y-axis during the measurement process (
mm,…,
mm).
The measured distance values of the laser scanner can be used to determine the distance from the draped NCF to the TCP of the laser scanner (see , right):
(1)
(1) where hL
is the height of the laser scanner and
is the measured distance value of the laser scanner to the NCF after draping.
To calculate the theoretical distance value of the laser scanner during draping , the difference
between the TCP values during draping
and the TCP values during measurement
is calculated (see Equationeq. 2
(2)
(2) or Equationeq. 3
(3)
(3) ). For illustration, the theoretical position of the laser scanner is shown on the left side of .
Since the geometry of the mould is subjected to manufacturing deviations, the draping is adapted to the mould. The geometry of the mould was previously recorded with the laser scanner. The vector used results from the mean values of the coordinate values from the 6 trials (n = 6).
(2)
(2)
EquationEq. (2)(2)
(2) can be simplified since
holds:
(3)
(3)
With and the height of the draping tool hD
can be determined:
(4)
(4)
The spring-back values for each draping position is then calculated by:
(5)
(5)
Due to the chosen coordinate system, the value of the spring-back is defined as negative value here (see Equationeq. 5(5)
(5) ).
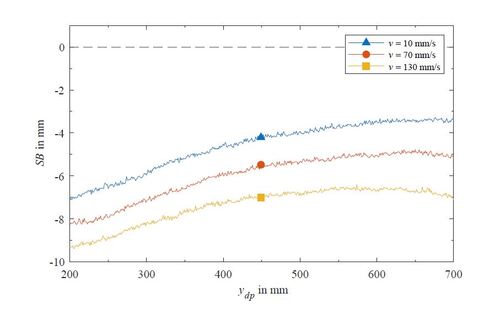
The determined spring-back values result in a curve over the draping positions ydp of the mould. The curve is based on the mean values from six individual measurements. shows three exemplary curves for the velocities v = 10, 70 and 130 mm/s at a constant force of F = 10 N. The closer the spring-back values are to zero, the lower the spring-back.
Figure 9 Average curves (n = 6) of spring-back against draping position for different velocities - exemplary curves for v = 10, 70 and 130 mm/s
3 Results
To investigate the spring-back behaviour, preliminary and main experiments were done using the one-factor-at-a-time method. This chapter deals with the preliminary tests carried out and the selection of the influencing factors and factor levels for the main tests derived from them. The dependencies of speed and force on the spring-back behaviour are also determined. In the following, the median values are calculated from the spring-back result curves and the relationships between the influencing factors and the response variable are investigated with the help of linear and quadratic regression.
3.1 Preliminary tests
As a basis for the test series, preliminary tests were first carried out to determine the levels of the factors for the main tests. In addition, the spring-back behaviour of the NCF was investigated for the time immediately after draping and for defined longer periods. The used levels of the factors for the preliminary tests are listed in .
Table 3 Investigated levels of the factors (input variables) for preliminary tests
With regards to speed, it has been shown that no significant differences in the spring-back are observed from speeds of about . Due to this, levels of 10 to 150 mm/s in a gradation of 20 mm/s as well as a low (5 mm/s) and a high speed (200 mm/s) were used. With regards to the investigation of the factor force, it was found that a force of more than 10 N is not useful, as the counterforce from this force onwards is not generated by the textile but by the mould. Draping force levels from 2 to 10 N were used in a gradation of 2 N. Despite a constant setting, marginal deviations in the applied force can occur in the course of the drape. The level values used for the main tests are shown in . Furthermore, the time of spring-back after draping was investigated to evaluate the process. It could be shown that the spring-back occurs in the first seconds after draping. After about ten seconds after draping, no further spring-back could be detected. For longer times (40, 100, 160, 220 and 280 s) there were no significant changes. The time during which spring-back occurs is not a problem for the process used, as the surface scan takes place at least 120 s after draping the textile onto the mould.
Table 4 Investigated levels of the factors velocity and force (input variables) for the main tests
The preliminary tests also show that the initial and final areas of the NCF samples do not permit any meaningful results. This is due to the curvature of the NCF samples in the edge areas (see , right). For this reason, the initial and final areas are not considered in the evaluation, but only the area between draping positions 200 and 700 mm. The acceleration factor can therefore be neglected.
3.2 Influence of velocity on the spring-back behavior
shows the mean curves for the spring-back values for the speeds 10, 70 and 130 mm/s at a constant force of 10 N. It can be seen that smaller spring-back values are achieved at lower speeds. Between the draping positions 200 and 700 mm the absolute values for the spring-back decrease. Overall, however, the spring-back curves are very similar. Comparing the spring-back values of the individual draping positions, the confidence intervals ( ;
) reveal significant differences between the curves shown. To illustrate the influence of the factors on the spring-back behaviour, the spring-back curves are shown in boxplots below (e.g. and ).
Figure 10 Spring-back-curves for different velocities - exemplary curves for v = 10, 70 and 130 mm/s and its boxplots. The boxes and their whiskers indicate minimum, maximum, quartiles and median (basic boxplot withouts outliners) [Citation24]
![Figure 10 Spring-back-curves for different velocities - exemplary curves for v = 10, 70 and 130 mm/s and its boxplots. The boxes and their whiskers indicate minimum, maximum, quartiles and median (basic boxplot withouts outliners) [Citation24]](/cms/asset/0e0e75af-faa5-4044-ac1c-ac9131f7cab8/yadm_a_2286127_f0010.jpg)
Figure 11 Boxplots of average curves of spring-back against velocity
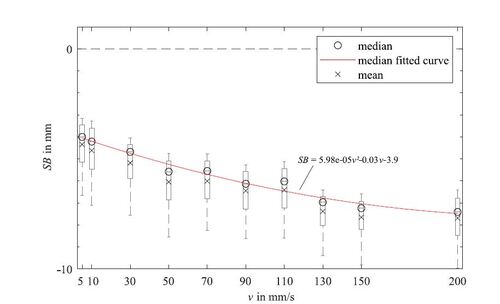
shows the boxplots of the spring-back curves for the investigated factor levels of speed. The spring-back decreases with decreasing speeds. For comparison with the median values, the mean values of the spring-back curves are also shown. The mean values are lower than the median values, but the progression is similar. In order to clarify the dependence of the speed on the spring-back, a linear and quadratic compensation curve was formed by the median values. When comparing the coefficients of determination, it can be seen that the quadratic compensation curve better represents the progression ( ). The statement about the quadratic dependency can be considered valid for each drape position because of the similar spring-back curves.
3.3 Influence of force on the spring-back behavior
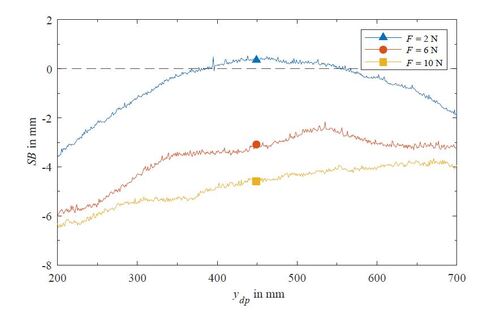
shows the exemplary mean value curves of the spring-back values for the forces and 10 N at a constant speed of 50 mm/s. Also for the force, it can be seen that smaller spring-back values are achieved at lower forces. The absolute values of the curves behave differently. With a force of 2 N the spring-back values first become smaller and then increase again. This sometimes results in positive values for the spring-back. The NCF sample continues to move in the direction of the mould (spring-in). The different curves result from the calculation of the spring-back values. When calculating the spring-back values, the distance from the draping tool to the mould in the direction of the edge is included in the calculation. The distance varied when a constant force was set during draping. At higher draping forces the distance is more constant. The curves for forces 6 and 10 N are similar to the spring-back curves in . The absolute values of the spring-back values also become smaller at higher draping positions. Significant differences can also be found for these spring-back curves for each draping position on the basis of the confidence intervals (
;
). In the range between the draping positions 350 and 550 mm stronger differences are recognisable.
Figure 12 Average curves (n = 6) of spring-back against draping position for different forces - exemplary curves for and 10 N
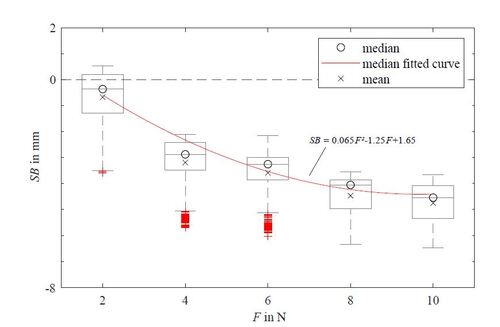
The curves are again presented in boxplots to examine the dependency of the factor on the spring-back behaviour (see ). A linear and a quadratic compensation curve were formed by the median values. Here it is found that a quadratic compensation curve better represents the course ( ). Due to the different curves shown, the statement of the quadratic dependency of the force on the spring-back behaviour is not generally valid and can deviate from this for individual draping positions. Nevertheless, a general dependence was proven.
Figure 13 Boxplots of average curves of spring-back against force
4 Discussion
A method for quantifying the spring-back behaviour of dry textiles was presented in order to visualise the influence of process parameters on the spring-back behaviour. The main findings are derived from the results of the test series. The speed of continuous draping (v) and the draping force on the dry NCF sample (F) have a significant influence on the spring-back behaviour. This is valid in the range investigated here for small values of velocity (0 - approx. 100 mm/s) and force (0 - approx. 10 N). It can be stated that smaller spring-back values occur for smaller velocities as well as for smaller forces. With regard to the force, it can be noted that with small deformations of the NCF sample by small forces, it springs back only slightly, as expected. The influence of the speed could be explained by a viscoelastic behaviour of the dry NCF. The spring-back of the NCF can be attributed to the elastic component, the time-dependent setting behaviour, e.g. fibre sliding or restructuring of the fibre structure to the viscous component. The dry NCF sample relaxes with time. Kelly et al. [Citation25] show the relaxation behaviour for example for glass-fibre continuous filament mat. Since the draping process is continuous, the force of the draping tool never occurs permanently at a particular draping position. However, by reducing the speed, the condition of constant draping at a particular position can be approximated. In summary, it can be said that with slow draping there is more time for settling in the NCF. This influences the spring-back behaviour in such a way that lower spring-back values are achieved. Another notable feature across both test series was the reduction of the spring-back values with ongoing draping. This trend was observed for all series of measurements. It is assumed that the already draped area of the NCF sample has an influence on the spring-back values in the further draping process (see , ②). An area of an already draped NCF will affect the further draping, as large and permanent deformations of the NCF have already occurred in this area. For further draping this will have a positive effect on spring back, the values will decrease. In particular, the spring-back curves for the draping speed show a slope in the first part of each curve, which becomes more constant as the curves progress. The shape of the curves indicates transient behaviour due to boundary effects. Repeated draping processes could therefore further reduce the spring-back.
5 Conclusion and outlook
In this study, the influence of different factors on the spring-back behaviour of a dry triaxial NCF in a continuous draping process was investigated. Within the process, an NCF sample is manually placed on an L-shaped mould and then automatically draped into the edge with the help of a draping tool. A laser scanner is used to record the draping result of the NCF sample. The following key conclusions can be made from the study on automated draping. The process parameters such as speed and force have a significant influence on the spring-back behaviour. The smaller the values of speed or force, the lower the spring-back values. By evaluating the curves of the spring-back values, it could also be shown that a quadratic dependency of the factors on the response variable is more probable than a linear dependency. Particularly with regard to the conflict of objectives between mould geometry, material properties and the lay-up and draping process, these results represent a gain in knowledge for automated production. An adjustment of the process parameters speed and force in a continuous draping process can, in relation to the spring-back behaviour, lead to better draping results and thus to a better quality of the FRP component.
Further work will focus on dealing with the interactions of the factors on the spring-back behaviour. Different NCF materials and different mould geometries are the subject of ongoing investigations. Furthermore, a constant distance between the draping tool and the mould may be of interest as a factor influencing spring-back. The dependency between drape force and distance would need to be investigated. With regard to the proposed calculation method, the use of a constant distance would be advantageous, as this is derived directly from the position values of TCPD .
Acknowledgements
The cooperation projects BladeMaker (0325435E) and BladeFactory (0324272B) were funded by the Federal Ministry for Economic Affairs and Climate Action, following a decision of the German Bundestag.
Disclosure statement
No potential conflict of interest was reported by the authors.
Data availability statement
The data that support the findings of this study are available from the corresponding author, Marvin Richrath, upon reasonable request.
Nomenclature
| v | = | velocity of the draping tool during continuous automated draping process in mm/s |
| F | = | draping force of the draping tool during continuous automated draping process in N |
| tds | = | time between draping and surface scan in s |
| TCPL | = | X-, Y-, Z-vector of TCP of articulated robot with laser scanner during profile measurement in mm |
| TCPD | = | X-, Y-, Z-vector of TCP of articulated robot with draping tool during automated draping in mm |
| hL | = | height of laser scanner in mm |
| hD | = | height of draping tool in mm |
| aL | = | distance between laser scanner and NCF sample after draping in mm |
|
| = | distance between TCP with laser scanner and NCF sample after draping in mm |
|
| = | distance between TCP with laser scanner and NCF sample during draping in mm |
|
| = | difference between TCP-values during draping and TCP-values during profile measurement in mm |
| ydp | = | draping position in mm |
| SB | = | spring-back-value in mm |
Notes
1 P-D Glasseiden GmbH Oschatz
References
- Henning F, Moeller E, editors. Handbuch Leichtbau - Methoden, Werkstoffe, Fertigung. 2nd ed. Carl Hanser Verlag; 2020. Available from: doi: 10.3139/9783446459847.
- Middendorf P, Metzner C. Aerospace applications of non-crimp fabric composites. In: Lomov SV, editor. Non-crimp fabric composites; 2011. p. 441–449. Available from: doi: 10.1533/9780857092533.4.441.
- Sköck-Hartmann B, Gries T. Automotive applications of non-crimp fabric composites. In: Lomov SV, editor. Non-crimp fabric composites; 2011. p. 461–480. Available from: doi: 10.1533/9780857092533.4.461.
- Brøendsted P, Nijssen RPL, editors. Advances in Wind Turbine Blade Design and Materials. Oxford, Cambridge, Philadelphia, New Delhi: Woodhead Publishing; 2013. Available from: doi: 10.1016/B978-0-85709-426-1.50016-7.
- Ohlendorf JH, Rolbiecki M, Schmohl T, et al. mapretec - ein Verfahren zur preform-Herstellung durch ebene Ablage für ein räumliches Bauteil als Basis einer automatisierten Prozesskette zur Rotorblattfertigung. Universität Bremen, Institut für integrierte Produktentwicklung (BIK); SAERTEX GmbH & Co. KG.; 2015. resreport. Available from: doi: 10.2314/GBV:849726018.
- Ohlendorf J, Richrath M, Franke J, et al. Towards automation of wind energy rotor blade production: a review of challenges and application examples. Advanced Manufacturing: Polymer & Composites Science. 2020; Available from: doi: 10.1080/20550340.2020.1838224.
- Kong H, Mouritz AP, Paton R. Tensile extension properties and deformation mechanisms of multiaxial non-crimp fabrics. Composite Structures. 2004; Available from: doi: 10.1016/j.compstruct.2004.04.046.
- Nezami F. Automatisiertes Preforming von Kohlefaserhalbzeugen mit aktiven Materialführungssystemen zur Herstellung komplexer Faserverbundstrukturen [dissertation]. Technische Universität Dresden; 2015.
- Schürmann H. Konstruieren mit Faser-Kunststoff-Verbunden. 2nd ed. Springer-Verlag Berlin Heidelberg 2007; 2007. Available from: doi: 10.1007/978-3-540-72190-1.
- Thor M, Sause M, Hinterhölzl R. Mechanisms of Origin and Classification of Out-of-Plane Fiber Waviness in Composite Materials – A Review. Journal of Composites Science. 2020; 4(3). Available from: doi: 10.3390/jcs4030130.
- Christ M. Definition und Quantifizierung der Drapierbarkeit von multiaxialen Gelegen durch die Vermessung von Einzeleffekten [dissertation]. Universität Bremen; 2018.
- Stöven T. Beitrag zur Ermittlung der Permeabilität von flächigen Faserhalbzeugen [dissertation]. Technische Universität Kaiserslautern; 2004.
- Szcesny M, Heieck F, Carosella S, et al. The advanced ply placement process – an innovative direct 3D placement technology for plies and tapes. Advanced Manufacturing: Polymer & Composites Science. 2017; 3(1). Available from: doi: 10.1080/20550340.2017.1291398.
- Lichtinger R, Lacalle J, Hinterhölzl R, et al. Simulation and experimental validation of gaps and bridging in the automated fiber placement process. Science and Engineering of Composite Materials. 2015; 22(2). Available from: doi: 10.1515/secm-2013-0158.
- Olsen H, Craig J. Automated composite tape lay-up using robotic devices. In: [1993] Proceedings IEEE International Conference on Robotics and Automation; 1993. p. 291–297 vol.3. Available from: doi: 10.1109/ROBOT.1993.292190.
- Lightfoot J, Wisnom M, Potter K. A new mechanism for the formation of ply wrinkles due to shear between plies. Composites Part A: Applied Science and Manufacturing. 2013; 49. Available from: doi: 10.1016/j.compositesa.2013.03.002.
- DANOBAT. Dfs-wb - automated wind blade manufactoring system [Online]; 2015. Available from: https://www.danobatcomposites.com/wp-content/uploads/2016/09/2015_DFS-WB_en.pdf.
- Arriola AC, Eraña AX, Sastre SM, et al. System for Automatically Producing Wind Turbine Blades ; EU Patent; EP2433782 B1; 28.09.2016.
- Braun R, Fröse E, Prissok F, et al. Gemeinsamer technischer Schlussbericht zum Verbundprojekt Blademaker. Fraunhofer-Institut für Windenergiesysteme (IWES); 2 Komponenten Maschinenbau GmbH; BASF Polyurethanes GmbH; fibretech composites GmbH; Fraunhofer-Institut für Fertigungstechnik und Angewandte Materialforschung (IFAM); Hexion Stuttgart GmbH; J. Schmalz GmbH; P-D Glasseiden GmbH Oschatz; Siemens AG; Universität Bremen, Institut für integrierte Produktentwicklung (BIK); Universität Bremen, Fachgebiet 12 Werkstofftechnik, Fasern und Faserverbundwerkstoffe (FIBRE); 2018.
- NN. BladeFactory - Fertigungstechnologien und prozessorientierte Materialevaluierung für eine Rotorblattproduktion mit hoher Parallelisierung [Online]; 2022. Available from: https://www.iwes.fraunhofer.de/de/forschungsprojekte/aktuelle-projekte/bladefactory.html.
- Siegert K, editor. Blechumformung - Verfahren, Werkzeuge und Maschinen. 1st ed. Springer-Verlag Berlin Heidelberg; 2015. Available from: doi: 10.1007/978-3-540-68418-3.
- Pereira G, LeBoulluec P, Lu WT, et al. Spring-back behavior on L-shaped composite structures: A statistical analysis of angular recovery as a function of time and residual cure. Composites Part A: Applied Science and Manufacturing. 2019; 124. Available from: doi: 10.1016/j.compositesa.2019.105491.
- Svanberg J, Holmberg J. An experimental investigation on mechanisms for manufacturing induced shape distortions in homogeneous and balanced laminates. Composites Part A: Applied Science and Manufacturing. 2001; 32(6). Available from: doi: 10.1016/S1359-835X(00)00173-1.
- Mittag HJ. Statistik: Eine Einführung mit interaktiven Elementen. 4th ed. Springer Berlin Heidelberg; 2015. Available from: doi: 10.1007/978-3-662-47132-6.
- Kelly P, Umer R, Bickerton S. Viscoelastic response of dry and wet fibrous materials during infusion processes. Composites Part A: Applied Science and Manufacturing. 2006; 37(6). Available from: doi: 10.1016/j.compositesa.2005.02.008.