
ABSTRACT
In 2018, 1.6 million tonnes of waste oil were collected in the European Union. About 61% of the waste oil was regenerated – i.e. it was turned into base oil again – and 39% followed energy recovery pathways either in the form of conversion to fuel or via direct incineration. Although the life-cycle literature largely agrees that regeneration outperforms energy recovery in the EU in terms of greenhouse gas emissions and societal costs, policies to boost regeneration and their socio-economic impacts remain underexplored. We fill this gap by discussing policies for managing waste oil flows and by systematically assessing their socio-economic impacts. We analyse different policies that would induce an increase in the regeneration rate of waste oil from the current 61% to either 70% or 85% and assess how the type and magnitude of impacts as well as their distribution across different actors varies, depending on the policy design. The policies lead to a net saving in terms of avoided societal costs and to moderate gains in employment. However, when accounting for estimated administrative costs, these benefits are likely insufficient to justify regulatory intervention.
1. Introduction
In 2017, 4.3 million metric tonnes of lubricants were placed on the market in the EU-28, 2 million tonnes of which are estimated to be collectible (Stahl and Merz Citation2020). About 1.6 million tonnes of waste oil were actually collected with 61% going towards regeneration to base oil and 39% being converted to fuel oil or used for energy recovery (Stahl and Merz Citation2020). In its New Circular Economy Action Plan, the European Commission (Citation2020a) aims to foster and encourage a sustainable, resource efficient and competitive economy in which materials are kept in circulation for as long as possible. As base oil, at least in theory, can be regeneratedFootnote1 indefinitely, it has substantial potential for contributing to the principles of a circular economy.
Waste oil can be treated in three general ways: First, it can be regenerated to base oil via a range of different technologies such as hydro-treatment, solvent extraction and distillation. Second, it can be converted via distillation into fuel oil. Third, it can be incinerated in cement kilns, power plants and similar facilities – we refer to this treatment as ‘energy recovery’. We also include hazardous waste incineration in the third category, as most facilities in Europe are prepared to recover at least some of the energy, although their primary purpose is waste destruction.
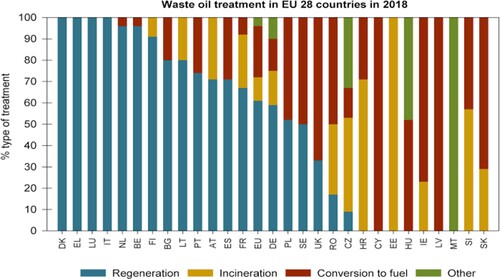
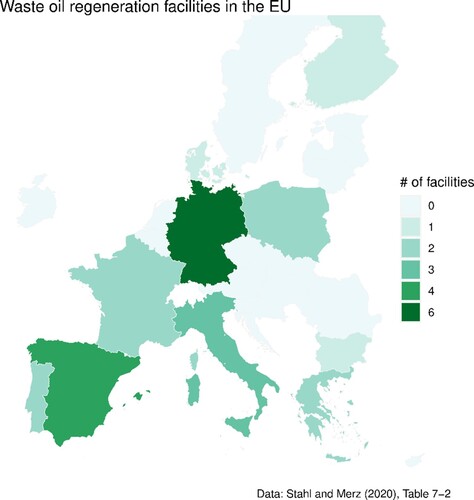
There is large heterogeneity across EU Member States in how waste oil is managed. While seven countries exhibit regeneration rates above 90%, in ten countries only 10% or less of the waste oil is regenerated. In most countries, energy recovery via incineration in cement kilns or power plants is not a relevant treatment option, however, in three countries it accounts for more than 50% (Stahl and Merz Citation2020). This is summarised in . The accounting of waste oil quantities and regeneration rates is not harmonised across countries. For instance, particularly in countries with high regeneration rates, the initial sediment and water are reported separately from dry waste oils or only the regeneration of waste oil of sufficient quality is reported, which in both cases leads to higher reported regeneration rates.
Figure 1. Waste oil treatment in EU 28 countries in 2018 (based on Stahl and Merz Citation2020). Regeneration: includes exports for regeneration. Incineration: takes place in cement and lime kilns and industrial boilers. Other: includes exports. Note that the accounting of waste oil quantities and regeneration rates can differ between countries. Some countries feature regeneration rates of 100%. However, evidence suggests that such high regeneration rates are in many cases artefacts of accounting, as some countries report the initial sediment and water separately from dry waste oils and others report only on the regeneration of waste oil of sufficient quality (García-Gutiérrez et al. Citation2023; Le Bihan et al. Citation2021; RDC Environment Citation2023). Country abbreviations follow the two-letter ISO 3166 alpha-2 code, except for Greece, which is abbreviated as ‘EL' and the United Kingdom, which is abbreviated as ‘UK'.
Looking at the heterogeneity in waste oil regeneration rates in , the questions arise whether it would be desirable from an environmental and socio-economic point of view that all Member States reach high regeneration rates and, if yes, what policy options exist for reaching this goal and how they compare in terms of their socioeconomic impacts. While the first question is at least partially answered by existing life-cycle literature, which we review in the following paragraphs, the second question is analysed in detail in this article.
There are two main arguments in favour of increasing the share of waste oil that is regenerated. First, there is evidence in the life-cycle literature that under a large set of circumstances regeneration outperforms other forms of waste oil recycling (such as conversion to fuel or energy recovery) in environmental terms, at least in a majority of environmental categories and in a European context (Abdalla and Fehrenbach Citation2017; Fehrenbach Citation2005; Kalnes, Shonnard, and Schuppel Citation2006; Pires and Martinho Citation2013).Footnote2 Most of these studies focus on greenhouse gas emissions,Footnote3 acidification and other environmental pollutants, and compare the recycling pathways on a category-by-category basis. This approach has the drawback that one pathway might outperform another in a certain set of impact categories, but not in others, which can lead to ambiguous outcomes (as is for example the case in Kanokkantapong et al. Citation2009).
To resolve this conflict, García-Gutiérrez et al. (Citation2023) use the social costs of different pollutants from Bijleveld et al. (Citation2018) and van Essen et al. (Citation2019) to quantify the full cost of different waste oil recycling pathways to society, thus providing a single number which allows for a ranking of technologies. They find that regeneration still outperforms all other pathways, but the advantage of the lowest-performing regeneration technology over the best-performing conversion to fuel technology is notably smaller when compared to the assessment only looking at selected pollutants. Nevertheless, this advantage is markedly larger when looking at better performing regeneration technologies and when comparing energy recovery and regeneration.
Second, from a policy perspective, the EU waste hierarchy generally prioritises waste oil regeneration over energy recovery (see Article 4 of the Waste Framework Directive; European Commission Citation2008). However, the legislative text also states that
[w]hen applying the waste hierarchy […], Member States shall take measures to encourage the options that deliver the best overall environmental outcome. This may require specific waste streams departing from the hierarchy where this is justified by life-cycle thinking on the overall impacts of the generation and management of such waste. (Article 4; §2 in European Commission Citation2008)
In this article, we assess what policies exist to increase regeneration and how they compare in terms of their socio-economic impacts. For answering these questions, we analyse two groups of policies: the first group consists of different types of regeneration targets and the second group relies on price-based instruments such as levies and subsidies. All policies are calibrated in a way that they would lead to an EU-wide increase in the regeneration rate from currently 61% to either 70% or 85% by 2030, depending on the scenario.Footnote5 The first group comprises three variations of targets: Policy 1a simply sets the target and leaves it up to Member States to achieve it; Policy 1b sets a regeneration target in the form of an average market-wide quota and Policy 1c specifies a percentage of recycled content to be met by each lubricant product unit. In the second group, Policies 2a and 2b consist of subsidies for regeneration, financed either from the general budget (2a) or via a levy on lubricants from virgin base oil (2b). See for a summary of the policies.
Table 1. The different policies analysed in this article.
Our main results are that for the 70% target, CO2 savings amount to 0.6 Mt over the period 2024-2045, accumulated societal life cycle cost savings to 124 M€ over the same period and net employment gains to 124 jobs by 2045 in the EU. For the 85% target, CO2 savings amount to 1.7 Mt, accumulated societal life cycle cost savings to 330 M€ over the same period and net employment gains to 329 jobs by 2045.Footnote6
Apart from the price-based policies (2a and 2b), which lead to excess costs that are a multiple of the expected benefits, all other policies are similar in terms of costs and benefits. The policies differ, however, in terms of who bears their main financial burden: While the incidence of the burden of policy 1a is undefined (as the implementation is left to Member States), the main burden of policies 1b and 1c would initially fall on lubricant producers and eventually on lubricant consumers. In policy 2a it would fall on the central government (and thus ultimately on taxpayers) and in policy 2b initially on virgin base oil producers and eventually on lubricant consumers. Compared against our estimate of the administrative cost of the policies (which is in the range of 11–213 M€), the expected net benefits of such policies would be rather low.
To our knowledge, this is the first study to compare recycling policies for waste oil management in the EU in terms of their potential socio-economic impacts. Although waste oil management might be of lesser importance compared to the management of other types of waste with larger volumes, this article establishes a framework that can be used in similar contexts. The question whether it is socio-economically preferable for a waste to be incinerated for energy recovery, recovered as a fuel or recycled is of crucial importance for many different materials, such as plastics or textiles. In addition, we use an interdisciplinary approach by combining methods from life-cycle analysis and economics to derive a more complete picture of the environmental and socio-economic effects of regulating waste oil than would be possible by using either of these approaches in isolation.
To better understand the following analysis, we need to establish some essential facts about the base oil life cycle. Base oil is the main component of lubricant products and is a rather valuable fraction of crude oil. At US refineries, only about 1% of crude oil is refined into lubricants (Lubes’n’Greases Citation2022). Base oils are classified into different groups, depending mostly on their viscosity and their sulphur and saturates content. The most common base oil groups are I, II and III, with Group I being a lower grade base oil and Groups II and III being of higher grades. In 2021, 37% of global base oil capacity produced Group I, 40% Group II and 14% Group III (Lubes’n’Greases Citation2022). Base oil prices have been fluctuating significantly over the last years. Between July 2020 and July 2021, Group I base oil was traded in Europe between €470 and €1640 per tonne. Groups II and III were traded between €820 and €1760 per tonne (Lubes’n’Greases Citation2022). In late November 2022, Group I base oil stood at €1140 and Group II base oil at €1720 per tonne (Chemanalyst Citation2023). Once lubricants reach the end of their useful life, they are classified as waste. According to IFEU (Citation2021), the price of waste oil that is of sufficient quality for regeneration ranges from 125 to 191 €/t. However, waste oil prices move jointly with crude oil prices, which were rather low in late 2020 and early 2021, when price data were collected by IFEU (Citation2021).
In what follows, we introduce policies for increasing regeneration and discuss their characteristics in Section 2. We then use a partial equilibrium model to illustrate qualitatively the effects of different policies on waste oil regenerators and virgin base oil refiners in the base oil market in Section 3. In Section 4, we use recent EU data to quantify these effects. Section 5 concludes.
2. Policies for waste oil management
The policies we select for analysis fall either into the category of regeneration targets (1a-1c) or price-based instruments (2a and 2b). See for a summary of the policies and their implementation in the model. The policies increase waste oil regeneration by different means but are all calibrated such that they lead to an EU-wide increase in the regeneration rate from currently 61% to either 70% or 85% by 2030. In Appendix A, we discuss each policy in detail.
3. Insights from a partial equilibrium model of the base oil market
This section illustrates the main effects at play, using a partial equilibrium model of the base oil market. Section 3.1 lays out the assumptions of the model and section 3.2 discusses the main insights.
3.1. Model assumptions and structure
There are four assumptions on which the model is based.
First, we assume the existence of a well-functioning, EU-wide base oil market on which virgin and regenerated base oil are traded freely.
Second, regenerators provide a small volume of base oil compared to virgin refiners and are hence price takers, because the equilibrium market price for base oil is determined by the production costs of virgin refiners. Due to this difference in volumes, the supply curve of regenerators is steeper than the aggregate supply curve (i.e. regenerators face capacity and supply constraints more quickly). Based on Stahl and Merz (Citation2020), we calculate a share of 11.3% of regenerated base oil in the base oil market.
Third, we assume that demand for lubricants is relatively inelastic, because it is tied to existing capital such as cars. This is reflected by the relatively steep demand curve D in and .
Figure 2. The effect of a quantity target on the base oil market. Left panel: SAgg is the aggregated supply of regenerated and virgin base oil (in blue). D is the aggregate demand curve (in red). The market equilibrium is given by the intersection of the aggregate supply curve and the demand curve in the point (Q0,P0), where a quantity of Q0 is sold at price P0. Right panel: A quantity target increases the supply of regenerated base oil SRG (in green) from q0 to q1. The equilibrium (Q0,P0) is the same as in the left panel. According to the regenerators’ supply curve (SRG), they sell the quantity q0 << Q0 at price P0. If a policy (such as the 70% regeneration target) would increase the amount of regenerated base oil sold on the market from q0 to q1, regenerators face higher costs and would need to sell at p1. However, as the equilibrium price is at P0 regenerators need a cost compensation of at least the area corresponding to the pink triangle in the right panel.
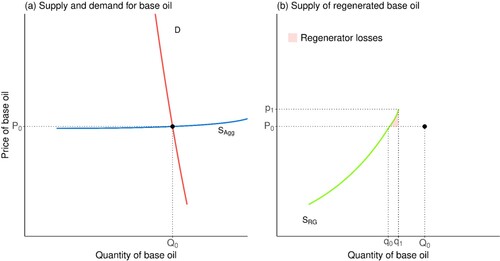
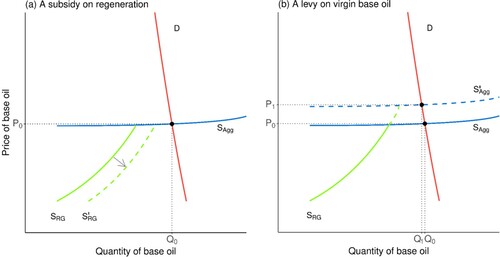
Figure 3. The effect of a subsidy (left panel) and a levy (right panel) on the base oil market. SAgg represents the aggregate supply curve (in blue), which is the sum of the virgin refiners’ and the regenerators’ supply curves. For illustrative purposes, the regenerators’ supply curve SRG is also shown separately (in green). D is the demand curve (in red). Left panel: The effect of a subsidy for regeneration on the ratio of regenerated to virgin-based base oil. The supply curve for regenerators is shifted to the right (from SRG to SRG’), but the aggregated supply curve (SAgg) hardly shifts, due to the much larger volume of virgin base oil (we therefore do not include a shifted aggregate supply curve in the left panel). Right panel: The effect of a levy on virgin base oil on aggregate base oil supply. The aggregated supply curve (SAgg) shifts upwards (to S’Agg) due to the increased cost for virgin refiners, making additional regeneration profitable for regenerators, as they can sell at a higher price. Policy 2a is illustrated in the left panel, while policy 2b is illustrated by the sum of the effects displayed in both panels.
Fourth, we assume that virgin base oil and regenerated base oil are perfect substitutes. As a consequence, their supply curves are hence summed up into an aggregate supply curve SAgg in and .
3.2. Insights from the model
In this section, we first define the equilibrium in the base oil market ( left panel). We then illustrate the impacts on regenerators when the regeneration rate is increased ( right panel). Finally, we illustrate the effect of subsidies on regenerators ( left panel) and of levies on virgin refiners ( right panel).
The market equilibrium is given by the intersection of the aggregate supply curve SAgg and the demand curve D in the point (Q0,P0), where a quantity of Q0 is sold at price P0 (left panel in ). This equilibrium price might change in response to the policy, but this change would be rather small due to the comparatively low volume of base oil provided by regenerators compared to virgin producers and to relative flatness of the aggregate supply curve.
The right panel of depicts the supply curve of regenerators. Regenerators are price takers (see assumption 2). Therefore, the equilibrium (Q0,P0) is the same as in the left panel. According to the regenerators’ supply curve, they sell the quantity q0 << Q0 at price P0. If a policy such as the 70% (or 85%) regeneration target increases the amount of regenerated base oil sold on the market from q0 to q1, regenerators face higher costs (p1) and would, at least in theory, be forced to sell below cost at the equilibrium market price, if they do not receive a higher compensation for their increased production – e.g. through a subsidy from the regulator. This minimum compensation is approximated by the pink triangle in the right panel.
The effect of this policy on consumer prices and related distributional effects cannot be assessed without knowing how regenerators would be induced to supply the increased amount of regenerated waste oil (and be compensated for the related costs). In principle, regenerators cannot pass the cost on to consumers through higher prices, because the price of base oil is set by the larger group of virgin oil refiners. Therefore, financial support for regenerators or additional policies that ensure that lubricant producers buy regenerated base oil at higher prices would be necessary. The distributional impacts would differ, depending on the chosen policy: A subsidy would affect the consumer price only marginally and thus would not have notable distributional implications between households. If, by contrast, lubricant producers would be obliged to buy regenerated base oil at higher prices (e.g. under a recycled content obligation), this price increase would normally be passed on to consumers.
Consider next the effects of a subsidy on regenerators and a levy on virgin base oil. The main effect of a subsidy would be to make production cheaper for regenerators and thus to shift their supply curve to the right (left panel in ). The aggregate supply curve would hardly be affected by this shift in the regenerators’ supply curve, as the price of base oil is still determined by the costs of the virgin base oil producers. A levy on virgin refiners, by contrast, shifts the virgin refiners’ (and with it the aggregate) supply curve upwards (right panel in ). Due to the relatively inelastic demand (assumption 3), the change in the equilibrium quantity of base oil (i.e. Q0-Q1) is very small. Policy 2a is a subsidy for regenerators and hence illustrated by the left panel in . Policy 2b is a subsidy for regenerators financed via a levy on virgin refiners and the overall effect is hence the sum of the effects in the left and the right panel.
4. Quantitative comparison of policies using life-cycle data
This section quantifies the impacts of different policies aimed at increasing the regeneration of waste oil in the EU in terms of their societal life-cycle costs, their greenhouse gas emissions and their employment effects. For this purpose, we compare the different policy scenarios over the period 2024–2045 against a business-as-usual scenario in which no additional policies are implemented.
Currently, 61% of waste oil is regenerated in the EU, while the remainder is processed to fuel (24%) or incinerated either in lime or cement kilns or in hazardous waste incineration (HWI) facilities. According to different industry stakeholders (see García-Gutiérrez et al. Citation2023), around 5–15% of all collected waste oil is unsuitable for regeneration, at least with current collection practices, which is why we only analyse a maximum regeneration target of 85%. Moreover, the untapped share of waste oil that is most suitable for regeneration is currently used for treatment to fuel. Therefore, we assume in this quantitative analysis that when the regeneration rate is increased, waste oil is redirected from treatment to fuel to regeneration. We thus only consider the net benefits from increasing regeneration at the expense of treatment to fuel.
We define the business-as-usual scenario in Section 4.1. The comparative policy analysis is done in Section 4.2.
4.1. Business-as-usual scenario
In order to assess the impact of the different policies, we establish a business-as-usual scenario (i.e. without policy intervention) of base oil demand, the resulting waste oil generation and the different uses of the waste oil (regeneration, conversion to fuel and energy recovery) until 2045.
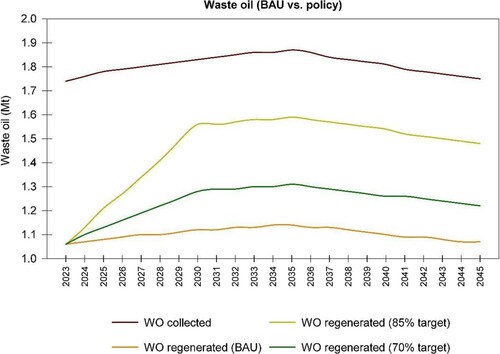
For that purpose, we extend projections from Bau et al. (Citation2018) on lubricant oil demand to the year 2045. We apply the annual lubricant market growth rates from Bau et al. (Citation2018) to European base oil demand taken from Stahl and Merz (Citation2020), so as to obtain a projection of base oil demand and waste oil generation in the EU. Collection rates from earlier years are used to derive projections for the collected waste oil. We also take EU emission standards for cars into account.Footnote7 As a result, the annual lubricant market growth rates are equal to Bau et al. (Citation2018) until 2035. Starting from 2036, we assume that the waste oil generation coming from the automotive sector decreases gradually from its 2035 level to 32.5% in 2050 due to EU regulations aiming to ban combustion engine cars from 2035 onwards. The resulting business-as-usual collected and regenerated waste oil quantities are shown in , together with the quantities of waste oil used for regeneration in the policy scenarios.
Figure 4. Regenerated (RG) waste oil (WO): policy versus business-as-usual (BAU).
4.2. Quantitative socio-economic analysis of policies to regulate waste oil
We focus on three main types of impacts: environmental, economic and social. Environmental impact analysis is based on the life cycle assessment (LCA) results and calculates the savings in different types of emissions (such as greenhouse gases, heavy metals and particulate matter) or resource use which translates into savings in impact categories (Global Warming Potential, Eco- and Human Toxicity, Particulate Matter, etc.) related to different policy fields. The quantitative economic analysis is in large parts based on the life-cycle costs (LCC) derived in García-Gutierrez et al. (Citation2023) and estimates benefits and costs associated with different policies. In the analysis of the social effects, net effects on job creation are analysed, as well as different types of distributional effects.
Since the objective of all policies is to channel waste oils towards regeneration, we render the policies comparable with regard to their economic impacts by calibrating them such that they all lead to the same outcome with respect to regeneration.Footnote8 All policies are gradually phased in over the period from 2024 to 2030. We specifically analyse two targets. The less ambitious target corresponds to an increase in collected waste oil that goes to regeneration from 61 to 70% until 2030. In the more ambitious scenario, regeneration increases from 61 to 85% until 2030. 85% also corresponds to our conservative estimate of the upper limit of regeneration that could be achieved with current waste oil qualities and collection practices (see García-Gutiérrez et al. Citation2023).Footnote9 The policies hence only differ in their economic and social impacts. summarises the corresponding targets for each policy and the methods used to derive them.
4.2.1. Policy 1a: specifying the share of waste oil that needs to be regenerated
This policy directly sets a minimum percentage of the collected waste oil that must be regenerated.
The results in terms of environmental, economic and social effects are summarised in and are discussed at length in the corresponding subsections below.
4.2.1.1. Environmental effects
Between 2024 and 2045, a 70 (85)% regeneration target would move an additional 3.11 (8.29) Mt of waste oil from fuel generation into regeneration, which would avoid 0.6 (1.7) Mt of CO2-equivalent emissions over the whole time period. This equals around 3 (8) % of Estonia’s total greenhouse gas emissions in 2018.Footnote10 This value is calculated as the difference between the average CO2-equivalent emissions across regeneration technologies, weighted by each specific regeneration technology’s share of waste oil treated via regeneration, and the CO2-equivalent emissions from waste oil-based fuel production. This is a lower-end estimate of the savings, as we assume that only waste oil that was going to fuel production is diverted to regeneration and as we do not account for indirect effects of the policy such as lower environmental burdens through policy-induced innovation in the long term (D'Amato, Mazzanti, and Nicolli Citation2021). Waste oil going towards incineration has higher levels of contamination, which makes it less suitable for regeneration (at least without further treatment).
shows the comparison of the policy scenario with the business-as-usual (BAU) baseline in terms of regenerated waste oil.
Environmental benefits might be asymmetric in the sense that if waste oil is not burned locally, but instead refined in other regions or countries, the exporting region would avoid pollution altogether while the importing region would face additional pollution through increased regeneration activity, even though on aggregate, environmental impacts would be reduced.
4.2.1.2. Economic effects
In García-Gutiérrez et al. (Citation2023), the monetary value of the benefit from avoided pollution is determined, relying on estimates of the external costs of different pollutants from Bijleveld et al. (Citation2018) and van Essen et al. (Citation2019). Based on this, García-Gutiérrez et al. (Citation2023) translate the additional tonnes of waste oil going to regeneration in the different policy scenarios into monetary savings. In what follows, we use the concept of societal life cycle costs (sLCC), described in detail in their article. This measure sums up the internal (such as CAPEX and OPEX) and external costs (related to the emissions of pollutants) and hence is the most comprehensive measure of gains and losses to society in the context of this analysis.
Building on García-Gutiérrez et al. (Citation2023), we find that moving one tonne of waste oil from conversion to fuel to regeneration generates a net saving (in terms of sLCC) of 55.8€. This value is calculated as the difference between the sLCC of conversion to fuelFootnote11 and the average sLCC of all regeneration technologies, weighted by each specific regeneration technology’s share of waste oil treated (via regeneration).Footnote12 Summing up the savings from 2024 until 2045 for the 70 (85)% target yields a net present value (NPV) of 124 (330) M€, using a social discount rate of 3%.
The effect on the government budget is not clear ex ante as the implementation of policy 1a would be left to Member States. The costs could be relatively high for a subsidy on regeneration (see also policy 2a) and comparatively lower for recycled content targets (1c) or a subsidy financed via a levy on virgin production (2b). There are few sources regarding the administrative costs of such policies. Based on an Australian levy and subsidy scheme (see Deloitte Citation2020), we estimate in Section 4.3 that over the 2024-2045 period and discounted with a social discount rate of 3% the administrative costs would amount to a range of 11–213 million €.Footnote13 We see no principle reason for why the administrative costs should markedly differ between a 70% and an 85% target.
4.2.1.3. Social effects: employment
According to García-Gutiérrez et al. (Citation2023), each 1000 tonnes of waste oil diverted from conversion to fuel to regeneration are associated with a net employment effect of 0.783 jobs, which we measure in Full-Time Equivalents (FTEs).Footnote14 For the 70 (85)% target, this translates into 18 (47) additional FTEs in 2024, the year the policy is first put into place. Over the analysed period, the number then increases to 124 (329) FTEs across the EU, by the year 2045. The FTEs can be interpreted as number of jobs created through this policy.
Since the use of waste oil for energy recovery, including conversion to fuel, often takes place locally, while high quality waste oil suitable for regeneration is often exported to places with regeneration facilities, this net job creation implies a shift of jobs between regions and countries. Of the 27 waste oil regeneration facilities in the EU27 + UK, six are located in Germany, five in Spain, three in Italy, with the remaining thirteen facilities distributed over Greece, France, Poland, Portugal, the UK, Bulgaria, Denmark and Finland (see and Stahl and Merz Citation2020). Therefore, implementing regeneration targets likely increases intra-EU movements of waste oil for regeneration from countries without regeneration facilities to countries with existing facilities (and spare capacity), which would imply job losses for waste oil-based fuel producers in the former and job gains for regenerators in the latter regions. This might raise distributional concerns, if no measures are taken to counteract this, such as creating incentives for building local regeneration facilities.
Figure 5. Waste oil regeneration facilities in the EU-27 (absolute number). Source: Stahl and Merz (Citation2020).
We estimate the distributional effects as follows: spare regeneration capacities in the EU are calculated using Tables 9-1 and 27-4 in Stahl and Merz (Citation2020). The country share of the spare regeneration capacity is shown in . We then assume that the jobs created through increased regeneration accrue to the different countries according to their share of regeneration capacities. We determine each country’s share of the total EU waste oil-based fuel production and assume that jobs lost in waste oil-based fuel production are proportional to this share. The results are displayed in .
Figure 6. Free regeneration capacities in the EU as a percentage of the total spare capacity. Country abbreviations follow the two-letter ISO 3166 alpha-2 code, except for Greece, which is abbreviated as ‘EL' and the United Kingdom, which is abbreviated as ‘UK'.
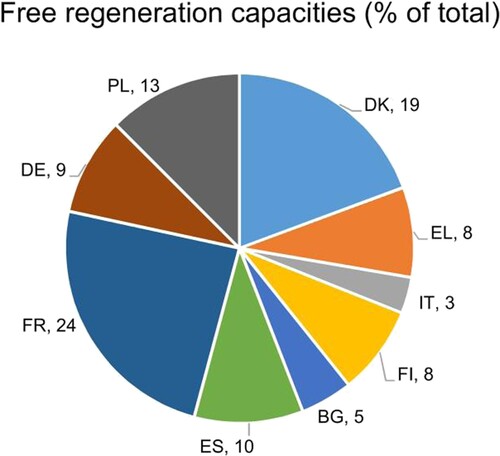
Figure 7. Employment effects of 70% and 85% regeneration targets in terms of FTEs in 2045 for different EU countries. We assume that the regeneration target set in policy 2a shifts waste oil from waste oil-based fuel producers to regenerators in countries with spare regeneration capacities. FTEs by 2045 can roughly be interpreted as the number of jobs lost over the course of the period 2024–2045. Top panel: 70% regeneration target. Bottom panel: 85% regeneration target. FTE: full-time equivalent; RG: regenerated; WODF: waste oil derived fuel. Country abbreviations follow the two-letter ISO 3166 alpha-2 code, except for Greece, which is abbreviated as ‘EL' and the United Kingdom, which is abbreviated as ‘UK'.
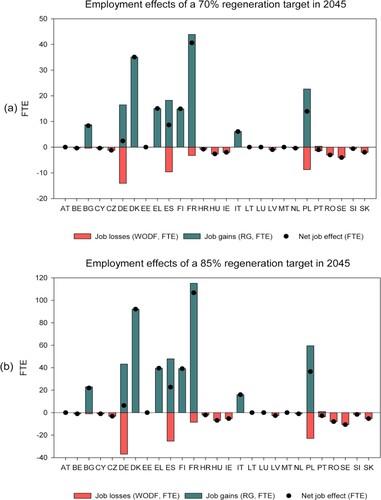
shows that the aggregate job creation on the EU level outweighs job losses significantly. Looking at the country level, however, we see that some countries, such as France, Denmark, Poland and Greece would benefit strongly, while others, like Sweden and Romania would incur job losses. In the remaining countries, job losses are either offset by gains in regeneration (Spain, Germany), or, if countries do not have regeneration facilities, job losses do occur, but are rather small (Czechia, Croatia, Slovenia).Footnote15
4.2.1.4. Social effects: cost pass-through, distributional impact
Another social issue is related to the question of who pays for the increase in waste oil regeneration. This is illustrated via the supply and demand partial equilibrium model in . The model and the resulting effects are described in detail in Section 3.
As we have seen in Section 3, the impact of policy 1a on consumer prices and related distributional effects remain unspecified unless we know how regenerators react to the increased waste oil load (and the related costs) and how governments implement the regeneration target in practice. As the price of base oil is set by the larger group of virgin oil refiners, regenerators cannot simply pass the cost on to consumers through higher prices. Policy 1a does not specify the exact implementation of the regeneration target, but the other policies do, which allows for better assessing where the policy burden falls, as we will see in the following paragraphs.
4.2.2. Policies 1b and 1c: regenerated content targets
Policies 1b and 1c – percentage targets of regenerated base oil either as a market average or as recycled content in each individual lubricant product – are measures designed to ‘pull’ regenerated base oil into the base oil market. The policies are calibrated such that their effect on the regeneration of waste oil is equivalent to policy 1a. For policy 1b, this means that the share of regenerated base oil on markets increases from 11.3 to 13.0% for a 70% target and to 15.8% for an 85% target between 2024 and 2030. For policy 1c, this means that the share of regenerated base oil in Group I base oilFootnote16 used in every unit of lubricant product sold in the EU increases from 20.7 to 24.1% for the 70% target and to 29.9% for the 85% target between 2024 and 2030. The share of regenerated base oil on the market is calculated using data from Stahl and Merz (Citation2020); Data from IFEU (Citation2021) is used to translate base oil quantities into their waste oil equivalents.
4.2.2.1. Environmental effects
While policy 1a affects the regeneration rate directly, policies 1b and 1c are indirect tools that act on proxies of the regeneration rate (such as the percentage of regenerated base oils on the base oil market). Therefore, there is a higher uncertainty of the effect of policies 1b and 1c on the regeneration rate. A scenario is imaginable, in which a share of the increase in demand for regenerated base oils is covered by imports, instead of local regenerators. In this scenario, the effect of policies 1b and 1c on the regeneration rate would be lower than anticipated.
4.2.2.2. Economic effects
While the overall economic effects in terms of societal life cycle costs are similar to policy 1a, there is a key difference in who pays the burden of the policy: For both options (1b and 1c), the responsibility of ensuring that the targets are met lies with lubricant producers, who have to buy and incorporate more regenerated base oil, which under normal economic conditions increases the price of the latter and hence their production costs. If lubricant producers do not receive additional support, they pass on parts or all of this price increase to consumers (see social effects).
4.2.2.3. Social effects
In addition to the employment effects discussed for the previous policy (1a), the following additional distributional effects need to be taken into account: Setting targets in terms of the market share of regenerated base oil (as in 1b)Footnote17 or as a percentage of recycled content (as in 1c), shifts the regulatory burden onto the lubricant producers. As they increase their purchases of regenerated base oil, prices rise and allow regenerators to produce the increased quantities in a profitable way. Looking at the right panel in , lubricant producers losses would be approximated by (p1-P0)*q1,, i.e. they would be larger than the losses of the regenerators indicated by the pink triangle.
Lubricant producers would shift at least part of their increased costs on to consumers, thus increasing the price of lubricant products. Whether or not this price increase has a regressive impact in EU Member States, depends on structural factors, such as widespread car ownership among low-income households. The 2015 wave of the EU Household Budget Survey contains a consumption category for household spending on lubricant products for transport use (Classification of Individual Consumption According to Purpose (COICOP) code:07.2.2.4). Unfortunately, these data only cover 11 EU countries and data on 4-digit COICOP categories are rather noisy, which does not allow for a full distributional analysis of a price increase in lubricant products. However, it can be inferred that spending on lubricants makes up a tiny fraction of total spending (usually below 1%). Taken together with the fact that a subsidy that is equivalent to a target of 70% of waste oil going to regeneration would be on the order of magnitude of 1–6% of the price of base oil (see the section on options 2a and 2b), a small price increase would have only a negligible distributional effect, particularly when compared to the rather large price changes induced by the fluctuation of global crude oil prices.
4.2.3. Policies 2a and 2b: subsidies, financed out of the general budget or via a levy
Both policies consist of a unit subsidy given to regeneration facilities for each tonne of processed waste oil. For comparability, the subsidy is set at level (€/tonne) such that the outcome in terms of additional regeneration is equivalent to policy 1a (regeneration of either 70% or 85% of all waste oil collected in the year 2030). In policy 2a, the funding for this policy is not specified and is assumed to be financed out of the general budget. In policy 2b, by contrast, funding for the subsidy comes from a levy on virgin base oil.
4.2.3.1. Environmental effects
For the same reason as in policies 1b and 1c, there is increased uncertainty regarding the environmental outcome of policies 2a and 2b. This is because the policies do not impact the regeneration rate directly, but instead act on a proxy like the costs of regeneration.
4.2.3.2. Economic effects
The monetary value of the benefit from avoided pollution via policies 2a and 2b is the same as for policies 1a-1c. However, for policy 2a, the total spending on the subsidy must be subtracted from the external cost savings. For policy 2b, the subsidy is financed via a levy on virgin-based base oil and thus does not create additional costs for the regulator.
The government-financed subsidy in policy 2a would start at 5.5€ per t of waste oil regenerated in 2024 and would gradually increase to 34.5€ in 2030 for the 70% target. For the 85% target the subsidy increases from 14.2 €/t to 76.6 €/t.
Using the elasticity of substitution between regenerated and virgin base oil from CalRecycle (Citation2016), we can estimate the changes in the relative quantities in response to changes in the relative prices. From this, we can infer the corresponding waste oil subsidy, knowing that one tonne of waste oil is regenerated into approximately 0.63 tonnes of base oil (when taking the average across different regeneration technologies, weighted by the quantities treated via the technologies). Since the subsidy would be paid for every unit of waste oil going towards regeneration – also to the part that would have been regenerated even without the subsidy – the total sum of the subsidy payments is comparatively large. The Net Present Value (NPV) of all subsidies until 2045 is 595 M€ for the 70% target and 1604 M€ for the 85% target, roughly four times the NPV of the societal life cycle savings. This would render a subsidy financed out of the government budget inefficient.
If the subsidy is instead financed via a levy on virgin-based base oil as in policy 2b, the calculation above changes as follows. For the 70% target, the levy would increase from less than 0.6€ to 4.6€ per tonne of virgin base oil between 2024 and 2030 (less than 1% of the market price) and the subsidy would increase from 5.0€ to around 31.0€ per tonne of waste oil regenerated. Until 2045, the NPV of the sum of all levies (which is equivalent to the sum of all subsidies) is 361 M€. For the 85% target the levy increases from 1.7€ to 12.5€, the corresponding subsidy from 13.6€ to 68.0€ and the NPV of the sum of all levies equals 954 M€. Since the levy by itself already induces an increase in the ratio of regenerated to virgin base oil quantities, the subsidy for achieving a specific regeneration rate can be lower than in the case of a government budget-financed subsidy. Both policies (2a and 2b) risk generating excess profits for regenerators, as they receive a subsidy for waste oil that is already regenerated in the baseline.
4.2.3.3. Social effects
Both, the employment and the regional distributional effects (in term of job shifts between regions) of policies 2a and 2b in terms of employment are equivalent to that of option 1a.
One crucial difference, however, occurs regarding who pays for the additional regenerated base oil. This is left open in option 1a, while lubricant producers initially pay the burden in options 1b and 1c (and eventually pass at least part of it on to consumers). In option 2a, the subsidy would be financed out of the general budget which would have largely negligible distributional effects and no direct (‘first-order’) effects on the price of lubricant products. This is illustrated in the left panel of , where the main effect of the subsidy is a shift of the regenerators’ supply curve to the right.Footnote18
In option 2b, the initial burden falls on virgin refiners of base oil in the form of the levy, which shifts the virgin refiners’ (and hence the aggregate) supply curve up (see the right panel in ), while regenerated base oil becomes cheaper as a result of the subsidy. The overall effect of policy 2b is the sum of the effect from the left and the right panel in . It is likely that the price increase caused by the levy is passed on to consumers, but due to the low level of the levy, the effect on households’ budgets would be small.Footnote19 We assume that demand for lubricants is relatively inelastic (i.e. it does not react much to small price changes), because it is mostly tied to existing capital such as cars, and people are unlikely to change their lubricant spending in response to a small price increase.
4.3. Summary: results of socio-economic analysis of policy impacts
The main results from the socio-economic analysis are summarised in and . Due to the chosen set-up, environmental effects are the same for all policies, as they are all calibrated to meet the same target. Some economic, social and distributional effects differ, however. While the financial burden that might be incurred by policy 1a is undefined (implementation left to Member States), the main burden of policies 1b and 1c initially falls on lubricant producers, and ultimately on lubricant consumers. In policy 2a it would fall on the government's budget (and ultimately on taxpayers) and in policy 2b initially on virgin base oil producers and eventually on lubricant consumers. Spending on subsidies by far exceeds benefits from avoided external costs for policies 2a and 2b, while costs are expected to be more moderate for the other policies.
Table 2. Summary of environmental, economic and social impacts for regeneration rates of 70% and 85% of all collected waste oil (sLCC = societal life cycle cost; FTE = full time equivalent).
Table 3. Comparison of environmental, economic, and social effects of the different policies until 2045 at EU level. All monetary values are given in 2024 NPV.
There are several social effects to consider. First, for all policies (except 2a) it can be expected that all or at least a part of the burden is passed on to consumers via higher lubricant prices. However, given the fact that these price increases are quite small and spending on lubricants is very low in relation to household income, the social effects of this price increase are expected to be minimal. Policy 2a would not necessarily lead to such a price increase, it could even decrease prices to a small extent. Second, regarding the distributional effects of the environmental effects, there could be a regional shift in emissions from EU regions without regeneration capacity to other EU regions that possess sufficient free capacities. Third, a similar shift could be expected for jobs, which would decrease in regions without regeneration capacities and increase in regions with available capacities.
Regarding the total savings in societal life cycle costs – 124 M€ until 2045 for the 70% target and 330 M€ for the 85% target – they are relatively low, particularly compared to the implementation costs of the policies under discussion, which we estimate using cost data on Australia, where a levy and subsidy scheme, similar to policy 2b is in place. According to Deloitte (Citation2020), the administrative costs are about 1 million Australian dollars per year (around 0.65 million €, using 2022 exchange rates). The Australian lubricant oil market is roughly 20 times smaller than the European market, so administrative costs would be higher in the EU, but due to economy-of-scale effects below twenty times the Australian costs. Cumulatively over the 2024–2045 period and discounted with a social discount rate of 3%, the administrative costs in the EU would amount to a range of 11 to 213 million €. We see no principle reason for why the administrative costs should differ between a 70% and an 85% target.
The main reason for the relatively small savings in sLCC is that the societal cost difference between regeneration and conversion to fuel is simply not that large (around 56€ per tonne of processed waste oil). In addition, the total amount of waste oil is also limited (2 Mt per year are estimated to be collectible) compared to other waste streams (e.g. municipal waste generation is more than 220 Mt per year).
From , no clear ranking emerges. Policies 2a and 2b lead to relatively high costs in terms of subsidies, which already exceed expected sLCC savings by a big margin even when administrative costs are not taken into account (see ). This is because the subsidies would be paid not only for the additional quantities of regenerated base oil but also for the base oil that would already be regenerated without the policy. This makes the subsidy less efficient than e.g. a recycled content target, which would provide the minimum incentive needed to supply the incremental quantities of regenerated base oil for complying with the target. Answering whether policies 1a to 1c lead to a net benefit or a net loss is less straightforward, since the expected benefits in terms of sLCC savings (124 M€ for the 70% target and 330M€ for the 85% target) are of the same order of magnitude as the administrative costs, which we estimate to be between 11 and 213 M€.
5. Discussion and conclusions
In this article, we analyse different policies to increase waste oil regeneration, in terms of their environmental and socio-economic impacts. All policies are calibrated to lead to the same outcome: an increase in the regenerated share of collected waste oil from the current 61% to either 70% or 85% in 2030. The different policies thus have the same environmental impact, i.e. they avoid 0.6 Mt of CO2-equivalent emissions until 2045 for the 70% target and 1.7 Mt for the 85% target.
Implementing these policies would yield a cumulative benefit of 124 M€ between 2024 (the year the policy is phased in) and 2045 (the end point of the analysis) in terms of avoided societal costs for the 70% target and 330 M€ for the 85% target. Given the fact that these savings are distributed over 24 years and 27 countries, the expected net benefits are rather small, even more so, when the estimated cumulative administrative costs of 11-213 M€ are factored in. All policies lead to a small net gain in employment of 124 jobs over the whole of the EU in the year 2045 for the 70% target and 329 jobs for the 85% target, but gains and losses are distributed unevenly across regions.
Apart from policies 2a and 2b – subsidies for regeneration financed by different means – which lead to excessive costs in terms of subsidy payments that already exceed expected savings by a big margin, all policies perform similarly. They differ, however, in how their costs are initially allocated to the different economic actors. Ultimately, this cost increase will at least partially be passed on to lubricant consumers. However, in terms of the product market price, the cost increase will be hardly noticeable as lubricant spending makes up only a negligible share of household spending, which also renders the distributional effects negligible.
There are two caveats regarding these findings. First, evidence suggests that the quality of the waste oil that currently undergoes incineration might generally be lower and less suitable for regeneration. Hence, it might be the case that only waste oil currently used for conversion to fuel could be directly diverted to regeneration, which would imply an upper limit on the EU regeneration rate of 85%. However, with improved collection, higher regeneration rates could become attainable (RDC Environment Citation2023). Second, base oil demand is constantly changing in terms of demand shares for the different base oil groups and will undergo dramatic changes due to the rise of electric mobility, particularly in Europe. This could alter the composition of available waste oils and also reduce its overall quantity in the near future, making it potentially unattractive to invest into the sector. Taken together, this leads to suboptimal conditions for a secondary waste oil market. However, stricter policies at the EU level and increased monitoring might improve conditions on markets for secondary material in general (Zu Castell-Rudenhausen et al. Citation2022).
Despite our finding that additional policies for waste oil management in the EU might only lead to minor societal gains, the results of this article are of high practical significance and political relevance. They demonstrate that there are cases in which the costs of policy that fosters stricter recycling might not be offset by the benefits, even when societal benefits are accounted for. Our findings also contribute to the wider debate on whether conversion of waste to energy is desirable from a socio-economic point of view (see e.g. Pareglio et al. Citation2020) and on how circularity can be embedded in the context of the European Green Deal (Zoboli et al. Citation2020). Moreover, this article establishes an interdisciplinary framework by combining methods from life-cycle analysis and economics that can be applied to other waste streams such as plastics or textiles. It is particularly useful for comparing waste treatment pathways such as incineration, energy recovery and regeneration in terms of their socio-economic impact.
Supplemental Appendix
Download MS Word (14 KB)Acknowledgement
We thank Enrique Garcia John for excellent comments.
Disclaimer
The views expressed in this paper are purely those of the authors and may not in any circumstances be regarded as stating an official position of the European Commission.
Disclosure statement
No potential conflict of interest was reported by the author(s).
Notes
1 In this article, we use the term ‘regeneration’ for treatments that turn waste oil back into base oil. This is synonymous with the term re-refining, which is also used frequently in this context.
2 Some studies – particularly from outside the EU – find no clear advantage of regeneration over the conversion of waste oils to fuel (Collins, Schiebel, and Dyke Citation2017; Geyer et al. Citation2013; Kanokkantapong et al. Citation2009). This outcome might be the result of slightly different economic, environmental and political circumstances compared to EU countries.
3 However, industrial GHG emissions in the EU are already regulated either by the EU Emissions Trading System (ETS) or via effort sharing regulations, which is why it is crucial to analyse a wider array of pollutants.
4 Another argument sometimes put forward in favour of regeneration is that, by increasing regeneration of waste oil, imports of crude oil for base oil production could be avoided and thus import dependency would be reduced (and fewer resources would be depleted). While this might be true when comparing virgin production of base oils against regeneration as in Botas et al. (Citation2017), the argument falls flat when considering other recycling pathways for waste oils. In a European context, waste oil used for increased regeneration is redirected from another recycling pathway, most likely from conversion to fuel (as both pathways can handle similar waste oil qualities). Therefore, less recycled fuel will be produced and crude oil imports have to be increased to make up for this loss. In sum, one effect roughly offsets the other and the overall effect on imports is likely negligible. Whether or not imports slightly decrease or increase depends on the quantity of avoided crude oil imports by regenerating one tonne of waste oil to base oil vs. converting a tonne of waste oil to fuel. Confidential data on the efficiency of regeneration vs. conversion to fuel, hints at a slight increase in imports.
5 We choose 70% as a low ambition target that is set slightly above the EU average regeneration rate and 85% as a high ambition target which represents a conservative estimate of the upper limit for regeneration with current collection practices (see Section 4).
6 This estimate does not account for indirect effects of the policy such as lower environmental burdens through policy-induced innovation which can become relevant in the long term (D'Amato, Mazzanti, and Nicolli Citation2021) or other general equilibrium effects.
7 See amending regulation 2021/0197(COD) on CO2 emission standards for cars and vans and RDC Environment (Citation2023).
8 For the sake of this analysis, we assume that this implies homogenous environmental impacts across all policies.
9 It should be kept in mind that, particularly for economic instruments like levies and subsidies, there is evidence that, in addition to these policies, environmental planning might be needed to shape and monitor environmental policies (Mazzanti and Zoboli Citation2013).
10 Source: Our world in data (Citation2023).
11 Specifically, the fuel treatment labelled ‘ER-WODFa’ in García-Gutiérrez et al. (Citation2023).
12 The three regeneration technologies analysed in García-Gutiérrez et al. (Citation2023) are hydro-treatment, solvent extraction and distillation. According to IFEU (Citation2021), of the quantities of waste oil that are regenerated and that are accounted for in their data collection, approximately 32% go towards hydro-treatment, 46% towards solvent extraction and 22% towards distillation. These data represent 82% of all waste oil going towards regeneration. Although there is some uncertainty due to the unaccounted 18%, we assume that the percentages treated via the individual regeneration pathways are a sensible approximation of the fate of all waste oil treated via regeneration and we use them as weights to calculate average values across technologies.
14 FTE is a unit indicating the workload of an employed person. An FTE of 1.0 corresponds to one full-time worker. In our case, FTEs are determined via the yearly capacities of the different treatment pathways and are thus FTEs per year.
15 One caveat of this finding is that the expansion of regeneration would, at least in the beginning, take place by using spare capacities. This might not have the full employment effect as calculated in the LCA. However, limited reductions of volumes of waste oil-based fuel production most likely would also not directly lead to a firing of personnel. So perhaps both job gains and losses are exaggerated, but the net effect might still be a sensible approximation of reality.
16 For policy 1c we only look at Group I base oils for two reasons: First, according to information received from industry stakeholders, the technical feasibility of increasing the content of regenerated base oil in lubricant products employing higher base oil groups is to some extent unclear. Second, the majority of existing regeneration plants in the EU produces Group I base oil.
17 In the case of a market-based target (as in 1b), some mechanism would need to be implemented to ensure that a price equilibrium exists in the lubricant market. Tradable regeneration certificates could provide a solution for this.
18 As the price of base oil is determined by the costs of the virgin base oil producers, even though regenerated base oil might become cheaper, the overall price level is unlikely to be affected, but the share of regenerated base oil is increased.
19 For the 70% target, the levy in 2024 makes up less than 0.1% of the total price of base oil, increasing to 0.6% in 2030. For the 85% target, the levy increases from 0.3% to 2.5% of the price of base oil over the same period.
20 For instance, an ambitious target could be the average regeneration rate of the countries that are above the 50th percentile (in terms of waste oil regeneration), which would imply a target of 85%. A less ambitious target could be the current EU average regeneration rate (61%). Note, that in the analysis below, we do not specify the targets at the Member State level, but instead analyse an EU-wide target. However, the caveat discussed previously still applies, namely that regeneration rates are not always calculated in the same way in different Member States.
21 This appears to be the way how the policy is implemented in Australia (Deloitte Citation2020). Alternatively, the subsidy could be levied on all lubricants sold, as is done in Italy (CONOU Citation2021). While this might change the absolute values of the subsidy and the levy slightly, it does not have a qualitative impact on the outcome.
References
- Abdalla, N., and H. Fehrenbach. 2017. “Updating the Study Ecological and Energetic Assessment of Re-Refining Waste Oils to Base Oils Substitution of Primarily Produced Base Oils in- Cluding Semi-Synthetic and Synthetic Compounds.” Heidelberg.
- Australian Government. 2023. “Product Stewardship for Oil (PSO) Scheme.” Https://Www.Dcceew.Gov.Au/Environment/Protection/Used-Oil-Recycling/Product-Stewardship-Oil-Program.
- Baranzini, A., and S. Carattini. 2017. “Effectiveness, Earmarking and Labeling: Testing the Acceptability of Carbon Taxes with Survey Data.” Environmental Economics and Policy Studies 19 (1), 197–227. https://doi.org/10.1007/s10018-016-0144-7.
- Bau, A., G. Bruni, L. Hussin, D. Kiewell, B. Kohler, and R. Verity. 2018, December 7. “Lubes Growth Opportunities Remain despite Switch to Electric Vehicles.” McKinsey and Company.
- Bijleveld, M., S. de Bruyn, L. de Graaff, E. Schep, A. Schroten, and R. Vergeer. 2018. Environmental Prices Handbook 2017.”
- Botas, J. A., Jovita Moreno, Juan J Espada, David P Serrano, and Javier Dufour. 2017. “Recycling of Used Lubricating Oil : Evaluation of Environmental and Energy Performance by LCA.” Resources, Conservation & Recycling 125 (January): 315–323. https://doi.org/10.1016/j.resconrec.2017.07.010.
- CalRecycle. 2016, February. “Used Oil Lifecycle Assessment Report to the Legislature.” Publication # DRRR-2016-01518. https://www2.calrecycle.ca.gov/Publications/System/DR/Download/57e0e6ce-6116-4468-ba2f-c84fae41eed9.
- Chemanalyst. 2023. “Price Data on Base Oil.” https://www.chemanalyst.com/Pricing-data/base-oil-63.
- Collins, M., K. Schiebel, and P. Dyke. 2017. “Life Cycle Assessment of Used Oil Management.” American Petroleum Institute, no. January: 1–367.
- CONOU. 2021. “Rapporto Di Sostenibilità 2021.” Consorzio Nazionale Oli Usati.
- D'Amato, A., M. Mazzanti, and F. Nicolli. 2021. “Green Technologies and Environmental Policies for Sustainable Development: Testing Direct and Indirect Impacts.” Journal of Cleaner Production 309: 127060. https://doi.org/10.1016/j.jclepro.2021.127060
- Deloitte. 2020. “Product Stewardship (Oil) Act 2000 Review - Final Report.” Deloitte Access Economics, no. December: 1–87.
- Essen, H. van, L. van Wijngaarden, A. Schroten, D. Sutter, C. Bieler, S. Maffii, M. Brambilla, et al. 2019. Handbook on the External Costs of Transport. European Commission. Delft: CE Delft.
- European Commission. 2008. “Directive 2008/98/EC of the European Parliament and of the Council of 19 November 2008 on Waste and Repealing Certain Directives.” Official Journal of European Union, 1–59. https://eur-lex.europa.eu/legal-content/EN/TXT/HTML/?uri=CELEX:32008L0098.
- European Commission. 2020a. “A New Circular Economy Action Plan For a Cleaner and More Competitive Europe.” Communication from the Commission to the European Parliament, the Council, the European Economic and Social Committee and the Committee of the Regions Com(2020) (Brussels, 11.3.2020). https://eur-lex.europa.eu/legal-content/EN/TXT/?qid=1583933814386&uri=COM:2020:98:FIN
- European Commission. 2020b. “Report on the Functioning of the European Carbon Market.” COM(2020) 740 Final.
- European Parliament and Council. 2019. “Directive (EU) 2019/904 of the European Parliament and of the Council of 5 June 2019 on the Reduction of the Impact of Certain Plastic Products on the Environment.” Official Journal of the European Union 2019 (March): 1–19. https://eur-lex.europa.eu/eli/dir/2019/904/oj
- Fehrenbach, Horst. 2005. “Ecological and Energetic Assessment of Re-Refining Used Oils to Base Oils: Substitution of Primarily Produced Base Oils Including Semi-Synthetic and Synthetic Compounds.” Heidelberg. https://www.ifeu.de/fileadmin/uploads/GEIR-final-report-LCA-21-04-05.pdf
- García-Gutiérrez, P., D. Klenert, R. Marschinski, D. Tonini, and H. Saveyn. 2023. “Environmental and Socio-Economic Sustainability of Waste Lubricant Oil Management in the EU – A Comparison of Regeneration and Energy Recovery of Waste Oil.” Publications Office of the European Union. https://doi.org/10.2760/7597
- Geyer, R., B. Kuczenski, A. Henderson, and T. Zink. 2013. “Life Cycle Assessment of Used Oil Management in California Pursuant to Senate Bill 546 (Lowenthal)” 546.
- IFEU. 2021. “Background Data Collection for Waste Oil Treatment.”
- Kalnes, T. N., D. R. Shonnard, and A. Schuppel. 2006. “LCA of a Spent Lube Oil Re-Refining Process.” In 16th European Symposium on Computer Aided Process Engineering and 9th International Symposium on Process Systems Engineering, edited by W Marquardt and C B T - Computer Aided Chemical Engineering Pantelides, 21:713–18. Elsevier. https://doi.org/10.1016/S1570-7946(06)80129-X
- Kanokkantapong, V., K. Worapon, P. Bunyarit, W. Porntip, and P. Prasert. 2009. “Used Lubricating Oil Management Options Based on Life Cycle Thinking.” Resources, Conservation and Recycling 53 (5): 294–299. https://doi.org/10.1016/j.resconrec.2009.01.002.
- Le Bihan, M., R. J. Dulbecco, S. Martin, and F. Michel. 2021. “European Review of Extended Producer Responsibility (EPR) Schemes for Lubricants Final Report.” RDC Environment, ADEME.
- Lubes’n’Greases. 2022. “Lubes’n’Greases Factbook 2021-2022.” LNG Publishing Company, Inc.
- Mazzanti, M., and R. Zoboli. 2013. “Resource Taxation and Regional Planning: Revenue Recycling for Local Sustainability in the Aggregates Sector.” Journal of Environmental Planning and Management 56 (6): 893–916. https://doi.org/10.1080/09640568.2012.708651
- Olson, M. 1965. The Logic of Collective Action: Public Goods and the Theory of Groups. Cambridge, USA: Harvard University Press.
- Our world in data. 2023. “Greenhouse Gas Emissions (Database).” https://ourworldindata.org/greenhouse-gas-emissions.
- Pareglio, S., R. Zoboli, M. Mazzanti, L. Bonacorsi, E. Chioatto, A. D'Amato, C. Ghisetti, M. A. Maggioni, S. Paleari, and E. Zecca. 2020. “Energy and the Circular Economy: How to Fill the Integration Gap?” FEEM Policy Brief No. 22 – 2020. Available at SSRN: https://ssrn.com/abstract = 3780091.
- Pires, A., and G. Martinho. 2013. “Life Cycle Assessment of a Waste Lubricant Oil Management System.” The International Journal of Life Cycle Assessment 18 (1): 102–112. https://doi.org/10.1007/s11367-012-0455-2.
- RDC Environment. 2023. “Study to Analyse Lubricant and Industrial Oil EPR Systems and Waste Oil Collection Schemes in EU Member States to Support Measures to Increase Collection Rates” – Final Report, Publications Office of the European Union. https://doi.org/10.2779/948514
- Stahl, H., and C. Merz. 2020. “Study to Support the Commission in Gathering Structured Information and Defining of Reporting Obligations on Waste Oils and Other Hazardous Waste” – Final report, Publications Office, 2020. https://doi.org/10.2779/14834
- Zoboli, R., M. Mazzanti, S. Paleari, L. Bonacorsi, E. Chioatto, A. D'Amato, C. Ghisetti, M. A. Maggioni, E. Zecca, and S. Pareglio. 2020. “Energy and the Circular Economy: Filling the Gap through New Business Models within the EGD.” FEEM Report No. 13 - 2020, Available at SSRN: https://ssrn.com/abstract = 3780085.
- Zu Castell-Rudenhausen, M., M. Wahlstrom, D. Nelen, Y. Dams, S. Paleari, R. Zoboli, H. Wilts, and I. Bakas. 2022. “Investigating Europe's Secondary Raw Materials Markets.” European Environment Agency, Luxembourg. https://doi.org/10.2800/48962
Appendix A: A detailed discussion of the pros and cons of each policy
Policy (1a) sets the minimum percentage share of all collected waste oil that must be regenerated, by 2030 (in our case 70% and 85%). Both domestic regeneration and intra-EU movements for the purpose of regeneration count towards the target, given that some Member States are lacking their own regeneration capacities. The exact implementation of the target would be left to the Member States. The target is phased in gradually in order for the Member States to build up regeneration capacities.
1a is the most flexible policy, in the sense that it can be achieved through different means. Moreover, it addresses the issue of low regeneration rates directly, so there is little uncertainty in the environmental outcome (similar to an emission standard). In addition, the data needed for monitoring this policy is relatively clear and available (amount of waste oil regenerated, regeneration capacities, imports/exports for regeneration).
However, there are some caveats: First, the large heterogeneity between countries would call for more than one target. Alternatively, there are intermediate options, like a minimum target and an ambitious target, for those that already meet the minimum target (although such a distinction might decrease the political feasibility).Footnote20 Second, due to the quality of the waste oil and related technical constraints to regeneration, a residual share of the collected waste oil cannot be regenerated. According to (García-Gutiérrez et al. Citation2023) there is considerable uncertainty regarding this share but some estimates from industry stakeholders put it in the range of 5 to 15%. This would have to be taken into account when setting the target. Third, the policy is rigid compared to more flexible policies such as pricing instruments. If, for example, regeneration capacities are not built up on time, the policy might need to be revised to avoid pressure on informal or illegal waste oil disposal. Fourth, this policy might raise lubricant prices to a small extent, which could negatively affect its acceptability. It might also face resistance from waste oil-based fuel producers, as most additional waste oil for regeneration would come from this sector and not from energy recovery or Hazardous Waste Incineration, which generally use lower qualities.
Policy (1b) sets a minimum share of total base oil put on EU markets that must be derived from regenerated waste oil (possibly distinguished by base oil group). Since policy 1b would apply to the market as a whole, it is up to lubricant producers to decide which specific lubricants to put on the market with a lower (or higher) regenerated content, as long as the average regenerated content on the market is in line with the target.
Surveillance and enforcement would be left to individual countries. However, in order not to distort lubricant markets, the targets themselves would need to be harmonised at EU level, possibly distinguished by base oil group and be applied to imports as well. This policy would create demand for regenerated base oil and would provide a powerful pull measure that would directly incentivise producers to regenerate more, thus addressing both the supply and the demand side.
On the downside, in certain market situations, e.g. due to shocks in the supply chain, there might not be enough regenerated base oil, even when all collected waste oil is regenerated, to meet the demand created by the policy. Unless the policy is then temporarily suspended, this could lead to an artificial restriction of lubricant supply. Moreover, base oil demand between groups is continuously shifting (see Lubes’n’Greases Citation2022) which would require the policy to be adjusted frequently. In addition, the content of regenerated base oil in imported base oil is mostly unclear, thus leaving an important variable unknown. According to Stahl and Merz (Citation2020), this would affect 11 to 14% of the base oil market.
Policy (1c) sets a minimum percentage share of base oil from regenerated waste oil that must be contained in every unit of a lubricant product put on EU markets (‘recycled content target’). Similar targets exist already in the EU for other product categories, for example the 25% quota of recycled PET in PET bottles by 2025 (European Parliament and Council Citation2019).
The key difference between policies 1b and 1c is that policy 1b would apply to the market as a whole, leaving it up to lubricant producers to decide which specific lubricants to put on the market with a lower (or higher) regenerated content, as long as the average regenerated content on the market is in line with the target. Policy 1c is stricter, as it regulates the content of regenerated waste oil in each unit of lubricant sold.
In addition to the caveats that apply to policy 1b, the following points need to be taken into account. First, the target would likely depend on the base oil group. Since there are only six regeneration plants in the EU producing Group II base oils and only one regeneration plant producing Group III base oil (Stahl and Merz Citation2020), the outcome of this policy would potentially depend on a very small set of companies. Possibly, such a target could be only reasonably set for base oil Group I, which is currently produced by 24 regenerators across the EU. Second, monitoring compliance is difficult and costly, as it would require regular controls at the product level, as opposed to analysing aggregate statistics for policies 1a and 1b. Third, the technical feasibility of recycled content in different base oil groups would need to be verified, given that some equipment manufacturers (e.g. in the car industry) work with narrowly defined technical specifications for authorised lubricant products.
Policy (2a) consists of a subsidy for regenerators financed via the general budget. This subsidy could be temporary (‘sunset clause’), until sufficient capacity has been built up. It could be linked to the price of crude oil, in order for regenerated waste oil to be competitive even when crude oil prices are very low.
There is a precedent in EU agricultural subsidies and a similar policy is in place in California (see CalRecycle Citation2016). In addition, a subsidy might face less resistance compared to other price instruments, particularly taxes, in part because the associated costs are diffuse, but the benefits are concentrated (i.e. regenerators benefit), see Olson (Citation1965). This policy is also robust to the previously mentioned uncertainty regarding the share of the collected waste oil that is unsuitable for regeneration.
Two caveats apply to this policy. First, some countries already have relatively high regeneration rates and, since subsidies would need to be paid for every tonne of waste oil that is regenerated, the policy would be costly. In 2018, around 1 million tonnes of waste oil were already regenerated and a total of 1.64 million tonnes of waste oil were collected in the EU. Evidence from Italy suggests that in order to effectively regenerate all waste oil suitable for regeneration, subsidy levels would need to be between 69 and 208 €/t of waste oil (García-Gutiérrez et al. Citation2023). For reaching similar regeneration rates in the EU, this would imply yearly subsidy spending of 113-341 million € (ceteris paribus). Second, there could be undesirable interactions of the subsidy with existing Member State level policies, including with existing subsidy schemes.
Policy (2b) consists of a levy on virgin base oil sales that is used to subsidise regenerators.Footnote21 As in the case of policy 2a, this policy could be temporary and the levels of the levy and the subsidy could be linked to the price of crude oil, for the same reasons.
There are several arguments in favour of this policy: First, the policy might face less resistance compared to other price instruments, as the revenue from levy is earmarked and does not simply ‘disappear’ into the general budget (see Baranzini and Carattini Citation2017, for instance, who find evidence of this earmarking effect in the context of carbon pricing). Second, this policy option is robust to the previously mentioned uncertainty in the percentage of the collected waste oil that is unsuitable for regeneration. Similar policies are in place in Italy (CONOU Citation2021) and in Australia (Australian Government Citation2023).
This policy has some similarity to the EU’s Emission Trading Scheme (ETS) in the sense that the majority of the revenues are used for spending purposes (in case of the EU ETS, 78% was spent on specified climate and energy related purposes between 2013 and 2019; see European Commission Citation2020b). Further, policy 2b would have the advantage over policy 2a that it does not burden the public budget. However, its main difficulty is that regeneration facilities only exist in 11 Member States, which would imply cross-border subsidies, which are likely to imply political and implementational challenges.