
 ?Mathematical formulae have been encoded as MathML and are displayed in this HTML version using MathJax in order to improve their display. Uncheck the box to turn MathJax off. This feature requires Javascript. Click on a formula to zoom.
Abstract
Any knowledge discovery could in principal benefit from the fusion of directly or even indirectly related data sources. In this paper we explore whether data fusion by simultaneous matrix factorization could be adapted for survival regression. We propose a new method that jointly infers latent data factors from a number of heterogeneous data sets and estimates regression coefficients of a survival model. We have applied the method to CAMDA 2014 large-scale Cancer Genomes Challenge and modeled survival time as a function of gene, protein and miRNA expression data, and data on methylated and mutated regions. We find that both joint inference of data factors and regression coefficients and data fusion procedure are crucial for performance. Our approach is substantially more accurate than the baseline Aalen's additive model. Latent factors inferred by our approach could be mined further; for CAMDA challenge, we found that the most informative factors are related to known cancer processes.
Introduction
Identification of driving events and their hazard rates for cancer progression remains a major challenge in cancer studies.Citation1 Recently, initiatives such as The Cancer Genome Atlas (TCGA)Citation2 and International Cancer Genome Consortium (ICGC)Citation3 were launched to coordinate large-scale cancer genome studies across different cancer types and subtypes of clinical importance. They collect data that span patients, cancer types and diverse biological data types to address the richness of genomic and molecular mechanisms that play critical roles during cancer development. Importantly, these include data from matched tumor and non-tumor tissues.Citation4 Rich, diverse, large and complex data sets generated within cancer genome projects now require computational methods that can collectively address them, provide interpretations on the genome-scale, and further integrate them with other genomic, clinical and functional information.
One of the fundamental goals of bioinformatic approaches in cancer studies is cancer subtype classification,Citation5-8 whereby a heterogeneous population of tumor samples is partitioned into biologically and clinically meaningful subtypes. Stratification of tumors is typically determined by the similarity of molecular profiles and correlated with clinical phenotypes including patient survival time and response to chemotherapy. Most current attempts to stratify tumors have used a single source of biological information and have derived molecular profiles from mRNA expression data,Citation8,9 somatic mutationsCitation10,11 or methylation data.Citation12 They have discovered informative subtypes in diseases such as breast cancer and glioblastoma but have also reported a lack of correlation between derived profiles and clinical phenotypes in certain cancer types, including colorectal and lung tumors.Citation6,13 These shortcomings might be due to data incompleteness, noise inherent to biological measurements and limitations of data analysis methods.
Although individual data sets have long been used to stratify patients, stratification based on multiple types of data, such as expression, methylation and somatic mutation profiles, has been more challenging. These data sets are fundamentally different from each other, both in type and in structure. Somatic mutation profiles are extremely sparse and dispersed since typically only a small fraction of genes are mutated and patients diagnosed with the same cancer type share few, if any, mutations.Citation14 On the other hand, methylation, miRNA expression and gene expression measurements assign quantitative values to nearly all markers, miRNAs and genes, respectively, in every patient. These data also naturally come at different levels of granularity and describe distinct biological data types, such as genes, proteins, miRNAs and methylation markers, among others. Heterogeneity of data generated by an increasing number of cancer studies hence limits the usage of naive computational approaches that either cannot be applied to such data or have to discard potentially beneficial biological information.
Here we report that the problems that stem from data diversity can be largely surmounted by data fusion, which can collectively consider a plethora of data sets coming from both directly and indirectly related data domains and provides gains in accuracy through data integration.Citation15 We focus on the prediction of patient survival time and the identification of crucial clinical and molecular features. We propose a new machine learning approach that can consider a potentially large number of heterogeneous data sets to infer latent factors for a survival regression model. Its principal innovation is simultaneous inference of patient profiles and estimation of the influence of latent factors on patient survival time. Below we describe the key concepts behind the proposed approach and demonstrate its high predictive accuracy in 3 ICGC cancer studies.
Results and Discussion
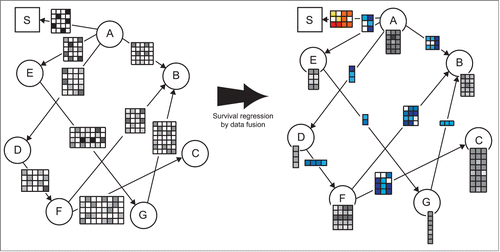
Overview of data fusion for survival regression We here propose a method called DFMF-SR that couples Aalen's additive model for survival regression and matrix factorization-based data fusion into a joint inference procedure. The principal novelty of the approach is the establishment of interdependence between Aalen's time-varying regression coefficients and fused latent matrix factors during model inference. Intuitively, in each iteration of the algorithm, current estimates of patients' survival time influence the optimization of latent matrix factors and vice-versa. shows an exemplar data fusion graph of 8 data sets together with patient survival data and their corresponding latent matrix factors as inferred by DFMF-SR. We summarize relationships present in every data set () with a mapping from objects, i.e., the units of analysis, to sets of objects called latent factors (columns in
and
) and pairwise relations between latent factors themselves (
). The inference process aims at identifying objects that are similar to each other in terms of their affiliation with latent factors. Similar objects are mapped to the same latent factor. Individual objects are allowed to instantiate similarity patterns with multiple latent factors.
Figure 1. Example illustrating survival regression by data fusion (DFMF-SR). The left pane shows the data fusion graph. Nodes in the fusion graph correspond to different types of objects considered by the system. Edges represent data matrices that describe relationships between objects of different types. For example, rows of matrix ("A," "E") correspond to objects "A" and columns agree with objects of type "E." A designated node "S" in the square box serves for the times of the events. Matrix ("A," "S") contains patient survival data. It is a binary matrix indicating the times when the respective objects of type "A" experienced the event. Type "A" most often corresponds to patients or tumor samples and hence ("A," "S") encodes the amount of time that has passed from primary diagnosis until a patient's death. DFMF-SR naturally interleaves collective matrix factorization with estimation of survival regression coefficients. The right pane shows the latent data model inferred by DFMF-SR. Each matrix with gray entries identifies a mapping from objects to their respective latent factors, which are stored in matrix columns. The number of matrices with blue entries is the same as the number of data sets; each one stores pairwise relations between latent factors as supported by the corresponding data set. The matrix with entries colored in different shades of red holds time-varying survival regression coefficients.
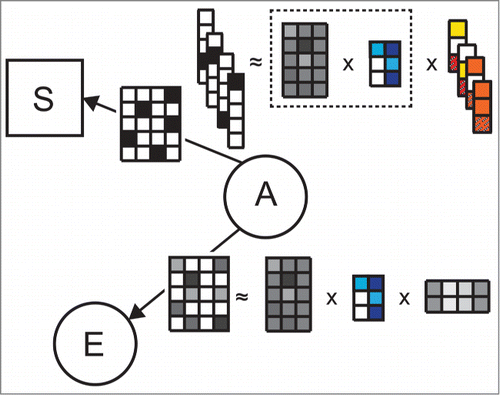
Overall, the goal of analysis with DFMF-SR is to identify the mapping of objects to a fixed number of latent factors, the pairwise relations among the factors, and regression coefficients of the survival model. The latter are optimized against good prediction of hazard rates using the mapping of individuals to latent factors. It should be noted that latent factors are inferred simultaneously for all objects and every object type in the system as shown in . exposes the coupling between latent factors and survival coefficients that are estimated by regressing latent factors against patient survival data. Selection of a data set whose latent factors are used in survival model estimation is done prior to model inference. However, DFMF-SR is flexible in the sense that it allows one to consider for survival analysis the latent representation of any data set included in the system.
Figure 2. Example illustrating the use of latent factors from matrix tri-factorization for survival model estimation in DFMF-SR. Let us assume data matrix ("A," "E") was selected as a data set whose latent factors are used in the survival model. In each iteration of DFMF-SR, current tri-factorization of ("A," "E") is updated toward both better reconstruction of the matrix ("A," "E") and improved accuracy of the survival model. Parametrization of the survival model is given by vectors with red and orange entries. Since DFMF-SR builds upon Aalen's additive model, the number of vectors corresponds to the number of time points in the survival data. Each vector holds information about the importance of any latent factor for survival up to the respective time point. The dimensionality of each vector corresponds to the number of latent factors in ("A," "E"), i.e., the number of columns in the matrix with blue entries, plus one. An additional entry in each vector is reserved for the time-varying baseline hazard for survival.
Predictive performance
reports the errors of predicting survival time for lung, kidney and head/neck cancer studies. We use protein expression and somatic mutation (p corresponds to samples, r to protein or to copy number somatic mutation; see sec. Factorized data fusion model for survival regression) data to regress against survival data. Our DFMF-SR approach (last row in ) outperforms an alternative approach that does sequential survival regression by first transforming data into the latent space and then inferring a survival model independently of data transformation (second and third row in ). Similar gains in accuracy of DFMF-SR are observed for other choices of r but are omitted here for brevity.
Table 1. Cross-validated error of predicted survival time. Latent data representations of protein expression values or somatic mutation data are regressed against patient survival data for 3 different cancer studies. We compare our approach (DFMF-SR) to a procedure, which first infers predictive factors by data fusion (DFMF in Step I) or principal component analysis (PCA in Step I) and then learns a regression model (Aalen in Step II). Aalen's regression modeling could be in principal applied to raw data (first row without feature construction in Step I), but fails due to high dimensionality of data sets
Models inferred by DFMF-SR are also substantially better than Aalen's regression from the raw data (first line in ). The less well-studied cancer data sets in CAMDA 2014 are challenging to analyze due to noisy measurements, missing data and high right censorship (given the available data). For example, 30% of tumor samples from the HNSC study do not have information about donors' last known vital status or time intervals since their primary diagnoses. Of the remaining samples, 86% belong to censored individuals. We observed that model performance crucially depends on the ability to infer latent space and reduce data dimensionality, and survival regression analysis fails to detect predictive signals if applied to high-dimensional untransformed data sets in the original data domain.
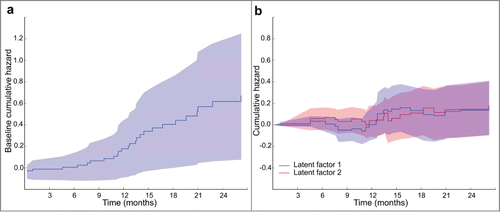
The additive regression model benefits from incorporating time into estimation of regression coefficients and can give information about effects of data features on patient survival time by plotting components of cumulative regression coefficients B*(tk) against time. shows cumulative regression functions for 2 somatic mutation latent factors and the baseline regression coefficient in the HNSC cancer study. The baseline coefficient starts off small in the first 10 months after primary diagnosis and then increases (, right pane). Notice the different dynamics of regression coefficients for the 2 latent factors (, left pane). Gene sets belonging to these latent factors are enriched in biological processes known to play a role in the development of cancer,Citation1 such as regulation of nitric-oxide synthase activity, monooxygenase and oxidoreductase activity, nitric oxide processes, and cyclase activity (FDR < 4 × 10⁻⁴). This finding points to a possible utility of the proposed approach for uncovering critical factors and their changing influence across different stages of cancer progression.
Figure 3. Cumulative hazard plots produced by DFMF-SR showing (a) the cumulative hazards of selected somatic mutation latent factors, i.e., B*i (tk) of latent factor i for times tk of the events, and (b) the baseline hazard in the HNSC cancer study. Notice that regression coefficients are the derivatives of the cumulative hazards and so it is the slopes of the plots that are informative.
Materials and Methods
We begin by briefly describing the Aalen's additive model for survival analysis and a recent approach to collective matrix factorization, which form the foundation of our work here. We then present our survival regression model that uses data fusion and latent factor parametrization, and conclude with an overview of considered data sets from the ICGC and a procedure for evaluation of predictive performance.
Background and preliminaries
Survival analysis and regression
Survival analysis studies the relationship between risk factors and a patient's time to the event (e.g. death, cancer relapse). The patient is referred to as right-censored if the event has not yet occurred by the end of the study. Traditional statistical techniques usually cannot be applied because of the skewness of the distribution of patient lifetime data, time-dependent features and data censoring. The survival probability until at least some time point is most often estimated with Kaplan-Meier statistics. When additional patient data are available, such as clinical covariates or information about somatic mutations that are present in the tumor, we can model time to the event through survival regression.
Aalen's additive model of survival regression
Aalen's additive model is an alternative to Cox's proportional hazards model.Citation16-18 It has time-varying regression coefficients, poses no assumptions about their parametric form and can provide information about the changing effects of data features on survival. Let λ(t) denote a vector of hazard rates for n individuals where λi(t) denotes the hazard rate of individual i. The additive model is given by λ(t) = X(t)β(t), where vector holds the baseline hazard and
regression coefficients that measure the influence of the respective features in
. The matrix X(t) is constructed as follows. If the ith individual is at risk at time t (the event has not yet occurred), then the corresponding row of X(t) contains the individual's feature profile, otherwise it is replaced with an all-zeros row. Aalen's model estimates cumulative regression coefficients defined by
. This is done by finding
, where
are ordered times of events and
is a binary vector indicating an individual who experiences the event at time
. The matrix
is computed by the least squares formula from
.
Data fusion by matrix factorization (DFMF)
We have recently proposed a data fusion approach called DFMFCitation15 (data fusion by matrix factorization) that can jointly factorize possibly many data matrices into low-dimensional matrix factors in a way that latent matrix factors are shared between factorizations of related data matrices. In DFMF, data matrices encode relations between 2 object types, say genes and gene ontology terms. Data matrices are related if they share an object type. An example of related matrices are the gene expression matrix and gene ontology term assignment matrix, as both matrices provide data on genes. DFMF can consider a set of data matrices. It can additionally consider constraints on the latent data representation that are expressed as matrices that relate objects of the same type, such as data on protein interactions. We have previously reported the utility of DFMF in functional genomics,Citation15 inference on new diseases associations,Citation19 and drug-induced liver injury prediction.Citation20 All these variants of data fusion assume the same factorization model, which is also used in our proposed extension of data fusion for survival regression.
Formally, let i and j denote 2 types of objects, such as genes and Gene Ontology terms, and let there be ni objects of type and similarly nj objects of type j. DFMF considers a collection
of relation matrices
, where Rij encodes relations between objects of types i and j, and a collection of constraint matrices
for
, where
is
th constraint matrix for objects of type i. DFMF organizes data sets in a data fusion graph. An example of a data fusion graph is shown in . The main component of DFMF is inference of latent matrix factors
(
) and
by minimizing loss function
. In this way, every relation matrix
is tri-factorized into
such that tri-factorization represents a good reconstruction of
,
, given the loss function of DFMF. Importantly, the inferred latent model contains both object type-specific latent matrix factors (
) that are shared between decompositions of related data matrices and data set-specific matrix factors (
) that together constitute latent data representation and are used for prediction.
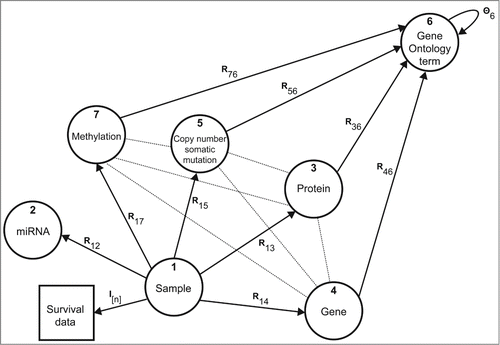
Figure 4. Data sources and their relations. Nodes in the graph correspond to different types of objects and edges denote data matrices Rij or constraint matrices Θi. For example, matrix R13 contains protein expression values, R15 relates tissue samples to mutated genes in the tumor, and DNA methylation matrix R17 reports on gene-based methylation Beta values of interrogated sites. Gene annotations from Gene Ontology are given in matrices Rx6, x ∈ {3, 4, 5, 7}. Constraint matrix Θ6 encodes the semantic similarity of Gene Ontology terms as defined by the directed acyclic graph of the ontology.
Factorized data fusion model for survival regression
Solving the optimization problem
Following the notation introduced in the previous section and in Žitnik & Zupan (2015),Citation15 DFMF-SR infers latent matrix factors (
) and
for all i and j, and cumulative regression coefficients B(t) for all time points of the events,
, by minimizing the following objective function:
(1)
(1)
Here, p and r are object types and specify data set whose fused latent representation we use to regress against survival data. The example in uses data set (“A,” “E”) to regress against survival data (“A,” “S”), hence in that example p corresponds to “A” and r to “E” (see also ). The times tk in EquationEq. (1)(1)
(1) are ordered times of the events and
is a binary vector consisting of zeros except for a one in the position corresponding to an individual who experiences the event at time tk. In our analysis, p refers to samples and r to features (e.g., protein expression profiles or mutated chromosomal regions).
We expand the objective function in EquationEq. (1)(1)
(1) using a trace operator similar to that in Žitnik & Zupan (2015)Citation15 and derive iterative multiplicative update rules for the unknowns from the associated Lagrangian L. Derivatives of L with respect to
for
remain the same as in Žitnik & Zupan (2015)Citation15 and thus, their update rules are unchanged. The multiplicative update of latent matrix factor
(not shown here) follows from the following expression after some algebraic manipulation:
where
is a constant factor. Similarly, update rules of latent matrix factors
for
are the same as those reported in Žitnik and Zupan (2015).Citation15 The rule for
is obtained from the associated partial derivative of the Lagrangian L given by:
(2)
(2)
To properly formulate the multiplicative update rule , one would need to solve a generalized linear matrix equation.Citation21-23 Such equations are difficult to analyze in their full generality, and necessary and sufficient conditions for the existence of their solutions are not known.Citation24 Also, current numerical techniques for solving generalized linear matrix equations are lacking or are not robust in large-scale settings.Citation24 We tackle this problem by randomly selecting a particular tk in each iteration of the DFMF-SR algorithm and its associated term from the last component of the right side of EquationEq. (2)
(2)
(2) . Based on this reduction we update
by solving a Sylvester equation, a well-characterized type of linear matrix equation in which the coefficient matrices occur on both sides of the unknown matrix
.
Finally, Aalen's time-varying coefficients are computed in each iteration of DFMF-SR by regressing current estimates of (tk) for all tk against lifetimes ordered by the times of the events with regularized least squares formulation (). The parameter selection and stopping criteria of the DFMF-SR algorithm are similar to those of the base DFMF algorithm.Citation15
Determining assignment of objects to latent factors
DFMF-SR regresses against latent factors in . Latent factor in
, i.e., a particular column in
, corresponds to a group of objects of type i. Since a latent factor does not directly represent any individual object, it is not readily interpretable in a biologically meaningful manner. To decipher the meaning of any latent factor, we wish to identify objects that are associated with it. By definition, the elements in
can only take nonnegative values and represent object membership strengths to latent factors. Membership strengths are nonnegative and real-valued due to the relaxation of orthogonality constraints on
in DFMF. Therefore, for a given latent factor c from
, we can determine, which objects are most important and have the greatest membership to factor c. Specifically, object x of type i belongs to a factor c if
Data and experimental setup
We consider large-scale cancer studies of 3 cancer types selected for the CAMDA 2014 Challenge in the 15.1 release of the International Cancer Genome Consortium (ICGC).Citation3 These are head and neck squamous cell carcinoma (HNSC; 368 donors), kidney renal clear cell carcinoma (KIRC; 505 donors) and lung adenocarcinoma (LUAD; 461 donors). The ICGC provides data from matched tumor and non-tumor tissues. For each cancer type, data include protein, miRNA and normalized gene expression values, genome-wide information on the state of methylated fragments, somatic mutations and clinical annotation. We consider these data sets alongside Gene Ontology annotations, amounting to a total of 10 data sources () for each cancer study. The base object type (p) is given by tumor samples that are associated with survival data based on the donor's last known vital status ("donor's vital status") and the interval from primary diagnosis to the last follow-up date in months ("donor's interval of last follow-up").
We evaluate the performance of survival models by leave-one-out cross-validation of tumor samples and score the models based on predicted survival times. We report transformed absolute error loss of survival time defined by , where
is the predicted median of survival time y. The median is the optimal predictor of the absolute error loss and is less affected by the long tails of survival distributions than the squared error loss. Log transformation addresses the concern that the absolute difference between predicted and actual survival time at a distant time point should result in smaller error than the same absolute difference achieved at a nearer time point.25
Conclusion
Data fusion for survival regression is a new computational approach that predicts patient's survival time from a collection of heterogeneous data sets. The approach builds upon recently proposed collective matrix factorizationCitation15 and a well-known Aalen's additive model for survival regression.Citation16 Unlike existing methods for survival time prediction, we formulated a joint inference procedure that allows us to simultaneously infer model parameters of collective matrix factorization and regression coefficients of Aalen's model. We demonstrated improved performance of our method over several baselines in case studies involving 3 cancer types from the International Cancer Genome Consortium and diverse data sets, such as gene and miRNA expression profiles, somatic mutation data, methylation and gene annotations from the Gene Ontology. Both latent data representation and joint inference, the 2 features of our approach, contribute substantially to accurate prediction of survival time. Our results allude to the potential benefits of data fusion when inferring survival models that are predictive of clinical outcomes.
Disclosure of Potential Conflicts of Interest
No potential conflicts of interest were disclosed.
Funding
This work was supported by grants from the Slovenian Research Agency (P2–0209, J2–5480), EU FP7 (Health-F5–2010–242038), NIH (P01-HD39691) and the Fulbright Scholarship (B.Z.).
References
- Garraway LA, Lander ES. Lessons from the cancer genome. Cell 2013 153, 17-37; PMID:23540688; http://dx.doi.org/10.1016/j.cell.2013.03.002
- Collins FS, Barker AD. Mapping the cancer genome. Sci Am 2007 296, 50-57; PMID:17348159; http://dx.doi.org/10.1038/scientificamerican0307-50
- Hudson TJ, Anderson W, Artez A, Barker AD, Bell C, Bernabé RR, Bhan MK, Calvo F, Eerola I, Gerhard DS, et al. International network of cancer genome projects. Nature 2010 464, 993-998; PMID:20393554; http://dx.doi.org/10.1038/nature08987
- Pleasance ED, Cheetham RK, Stephens PJ, McBride DJ, Humphray SJ, Greenman CD, Varela I, Lin ML, Ordóñez GR, Bignell GR, et al. A comprehensive catalogue of somatic mutations from a human cancer genome. Nature 2009 463, 191-196; PMID:20016485; http://dx.doi.org/10.1038/nature08658
- Yuan Y, Savage RS, Markowetz F. Patient-specific data fusion defines prognostic cancer subtypes. PLoS Comput Biol 2011 7, e1002227; PMID:22028636; http://dx.doi.org/10.1371/journal.pcbi.1002227
- Network CGAR, et al. Integrated genomic analyses of ovarian carcinoma. Nature 2011 474, 609-615; PMID:21720365; http://dx.doi.org/10.1038/nature10166
- Hofree M, Shen JP, Carter H, Gross A, Ideker T. Network-based stratification of tumor mutations. Nat Methods 2013 10, 11081115; http://dx.doi.org/10.1038/nmeth.2651
- Pal S, Bi Y, Macyszyn L, Showe LC, O'Rourke DM, Davuluri RV. Isoform-level gene signature improves prognostic stratification and accurately classifies glioblastoma subtypes. Nucleic Acids Res 2014 42, e64; PMID:24503249; http://dx.doi.org/10.1093/nar/gku121
- Reis-Filho JS, Pusztai L. Gene expression profiling in breast cancer: classification, prognostication, and prediction. The Lancet 2011 378, 1812-1823; http://dx.doi.org/10.1016/S0140-6736(11)61539-0
- Greenman C, Stephens P, Smith R, Dalgliesh GL, Hunter C, Bignell G, Davies H, Teague J, Butler A, Stevens C, et al. Patterns of somatic mutation in human cancer genomes. Nature 2007 446, 153-158; PMID:17344846; http://dx.doi.org/10.1038/nature05610
- Alexandrov LB, Nik-Zainal S, Wedge DC, Aparicio SA, Behjati S, Biankin AV, Bignell GR, Bolli N, Borg A, Børresen-Dale AL, Boyault S, et al. Signatures of mutational processes in human cancer. Nature 2013 500, 415-421; PMID:23945592; http://dx.doi.org/10.1038/nature12477
- Gifford G, Paul J, Vasey PA, Kaye SB, Brown R. The acquisition of hMLH1 methylation in plasma DNA after chemotherapy predicts poor survival for ovarian cancer patients. Clini Cancer Res 2004 10, 4420-4426; PMID:15240532; http://dx.doi.org/10.1158/1078-0432.CCR-03-0732
- Network CGA, et al. Comprehensive molecular characterization of human colon and rectal cancer. Nature 2012 487, 330-337; PMID:22810696; http://dx.doi.org/10.1038/nature11252
- Lawrence MS, Stojanov P, Polak P, Kryukov GV, Cibulskis K, Sivachenko A, Carter SL, Stewart C, Mermel CH, Roberts SA, et al. Mutational heterogeneity in cancer and the search for new cancer-associated genes. Nature 2013 499, 214-218; PMID:23770567; http://dx.doi.org/10.1038/nature12213
- Žitnik M, Zupan B. Data fusion by matrix factorization. IEEE Transactions on Pattern Analysis and Machine Intelligence 2015 37, 41-53; http://dx.doi.org/10.1109/TPAMI.2014.2343973
- Aalen OO. A linear regression model for the analysis of life times. Stat Med 1989 8, 907-925; PMID:2678347; http://dx.doi.org/10.1002/sim.4780080803
- Aalen OO. Further results on the non-parametric linear regression model in survival analysis. Stat Med 1993 12, 1569-1588; PMID:8235179; http://dx.doi.org/10.1002/sim.4780121705
- Abadi A, Saadat S, Yavari P, Bajdik C, Jalili P. Comparison of Aalen's additive and Cox proportional hazards models for breast cancer survival: analysis of population-based data from British Columbia, Canada. Asian Pac J Cancer Prev 2011 12, 3113-3116; PMID:22393999
- Žitnik M, Janjić V, Larminie C, Zupan B, Pržulj N. Discovering disease-disease associations by fusing systems-level molecular data. Sci Rep 2013 3, e3202
- Žitnik M, Zupan B. Matrix factorization-based data fusion for drug-induced liver injury prediction. Systems Biomedicine 2014 2:16-22.
- Horn RA, Johnson CR. Topics in Matrix Analysis (Taylor & Francis, 1991.
- Bhatia R, Rosenthal P. How and why to solve the operator equation AX−XB = Y. Bulletin of the London Mathematical Society 1997 29, 1-21; http://dx.doi.org/10.1112/S0024609396001828
- Horn RA, Johnson CR. Matrix Analysis (Taylor & Francis, 2012.
- Simoncini V. Computational methods for linear matrix equations. Tech. Rep., Department of Mathematics, University of Bologna, Piazza di Porta San Donato 2014 5, I-40127.
- Lawless JF, Yuan Y. Estimation of prediction error for survival models. Stat Med 2010 29, 262-274; PMID:19882678