Abstract
An optical sensor device based on waveguide metallic photonic crystals for the detection of the environmental refractive-index change is investigated. The sensitivity of the device is found to be improved through optimizing the angle of incidence of the light. This is based on the overlap of the waveguide resonance mode with the most sensitive spectral position of the spectroscopic response of the localized surface plasmon. Experimental investigations were performed on the glucose/water solution with different concentrations. The measurement data verified the mechanisms for the optimization of the sensor sensitivity by adjusting the incident angle of the light, which show excellent linearity and high reproducibility.
1. Introduction
Metallic photonic crystals (MPCs) are widely used in optical switching,Citation1 optical filters,Citation2Citation3 and sensors.Citation4–6 A number of sensors based on localized surface plasmon resonance (LSPR) or particle plasmon resonance (PPR) have been demonstrated.Citation7Citation8 Through coupling with the waveguide resonance mode, the sensitivity of the sensors based on PPR can be enhanced significantly, where a sensor device has been demonstrated for the detection of specific bioreactions.Citation9 This kind of sensor defined by the so-called waveguide MPCs is featured with simplicity in the realization of the nanostructure sensor chip, small sensing volumes, easier control and modification of parameters of the nanostructures.
In this work, we demonstrate that the sensitivity of this kind of sensor device can be enhanced further by optimizing the angle of incidence. Liquid samples of glucose/water solutions with different concentrations are used as the detection targets.
2. Fabrication of the waveguided MPC structures for index sensors
2.1. Fabrication and characterization of MPCs
Solution-processible method Citation10Citation11 based on interference lithography and colloidal gold nanoparticles is employed for the fabrication of MPCs. This shows obvious advantages of simplicity, high efficiency, low cost and large-area homogeneity, as compared with the conventional methods. In this paper, we employ a two-stage annealing process. In the first stage, an annealing temperature of 350°C is employed and the photoresist grating functions as the template for controlling the shape and volume of gold in the formation of the precursor MPC of the one-dimensional array of gold nanostructures. In the second stage, the sample is annealed at 450°C, the photoresist is removed through complete evaporation without destroying the periodical arrangement of the gold nanostructures.
The master grating made of photoresist (S1805 from Rohm and Haas) was fabricated by interference lithography, where a 325 nm laser from Kimmon Electric Co. was split into two beams with a separation angle of about 48° before the two arms were overlapped onto the photoresist film. Then, a colloidal solution of gold nanoparticles was spin-coated onto the master grating before the annealing processes. The two-stage annealing process was performed in an muffle furnace.
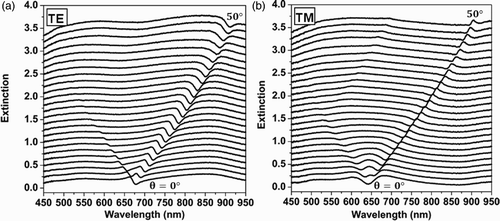
The MPC chip composed of periodically arranged gold nanostructures on a waveguide of indium tin oxide (ITO) was the central part of the sensor. shows the scanning electron microscopic (SEM) and the atomic force microscopic (AFM) images of the gold nanostructures. The grating structures have a period of about 400 nm and a modulation depth of about 70 nm. The waveguide was provided by a 200-nm ITO layer coated on the glass substrate with a thickness of 1 mm and an effective area of 10×10 mm2. Optical extinction spectra of the structures shown in were measured in air at an incident angle increased from 0° to 50° in steps of 2° for transverse electric (TE) (a) and transverse magnetic (TM) (b) polarizations.
Figure 1. SEM and AFM height images of waveguided MPC structures.
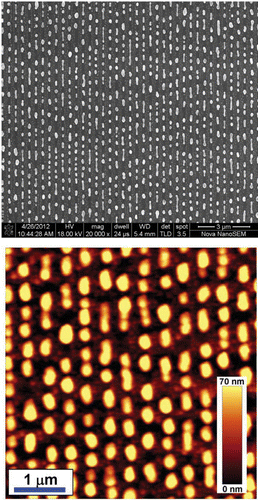
Figure 2. Optical extinction spectra for TE and TM polarizations in air, respectively.
2.2. The design of the sensor system
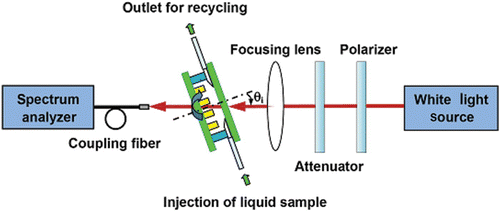
The basic principles of the sensor device based on MPCs have been described in detail in Citation9. shows the schematic of the sensor device. The device was mounted on a rotation stage so that white light could be incident on the MPCs at tunable angles. The incident white light passed through a polarizer, an attenuator, a focusing lens and the window of chamber holding the MPC chip before reaching a fiber-coupled spectrometer (USB4000 from Ocean Optics). The spectrometer was used to measure the transmission or extinction spectra through the sensor device. The liquid sample, which is the solution of glucose in water, is injected from the inlet into the chamber and drained through the outlet back to the container of the liquid sample. The circulation channel connecting the chamber and the container is constructed by soft silicon rubber tubes. The spectroscopic response of the waveguided MPC device was tunable by changing the angle of incidence, as the waveguide resonance mode was strongly dependent on the angle of incidence. The sensor signal could be maximized by optimizing the incident angle of the white light.
Figure 3. Schematic drawing of the experimental setup.
3. Sensitivity optimization of the sensor based on waveguided MPCs
3.1. Definition of the sensor signal spectrum
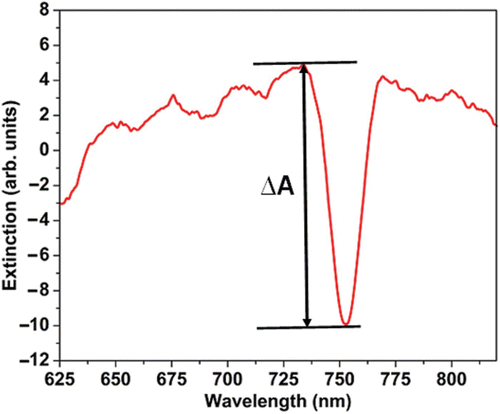
illustrates the definition of the sensor signal using a measured extinction spectrum. The signal has been measured by taking two transmission spectra IS(λ) and I0(λ) before performing the following calculation:
where IS (λ) is the transmission spectra of the circulation of glucose solutions with different concentrations and I0(λ) is the blank spectrum of pure water. The amplitude of the sensor signal is defined by the peak-to-valley difference of the extinction spectrum. Thus, the sensitivity of the sensor device is expressed as S=Δ A/Δ n, where Δ n is the practical change in the environmental refractive index.
Figure 4. Schematic illustration of the definition of the sensor signal.
3.2. Measurements on the sensor signal at different concentrations of the glucose/water solution for different angles of incidence
The optical extinction spectroscopic properties were measured with the concentration of the glucose/water solutions increased from 1% to 10%. For each concentration, the optical extinction spectrum was measured at an incident angle increased from 0° to 28°. –(g) corresponds to incident angles of 0°, 5°, 10°, 15°, 20°, 25°, and 28°. Between each two adjacent changes of the solution concentration, pure water was circulated for 10 min to clean the channels and the MPC chip.
Figure 5. (a)–(g) Optical extinction spectra of glucose/water solutions with the concentration increased from 1% to 10% (W/W) using pure water as the blank sample at different incident angles: (a) 0°, (b) 5°, (c) 10°, (d) 15°, (e) 20°, (f) 25°, (g) 28°. (h) The refractive index of the glucose/water solution measured by an Abbe refractometer with the concentration increased from 1% to 10%.
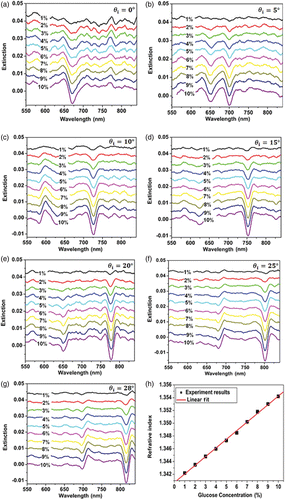
As shown in –(g), with increase in the angle of incidence, both the spectral position and the amplitude of the sensor signal change dramatically with change in the angle of incidence. The sensor signal resulting from the longer wavelength branch of the coupled mode between the waveguide and plasmonic resonance modes Citation9 shifts from about 670 to about 820 nm as the incident angle is increased from 0° to 28°. A maximum amplitude of the sensor signal can be observed in for an incident angle of 25°. This indicates a possible optimization of the sensitivity of the sensor device through change in the angle of incidence. It should be noted that the scaling of the vertical axis was not kept unchanged for the measured spectra in . According to the measurement using an Abbe refractometer, the refractive index increases from 1.330 to 1.334 as the concentration of the glucose/water solution is increased from 1% to 10%. shows a good linear relationship between concentration and refractive index of the corresponding glucose solution.
To demonstrate the enhancement of the sensitivity of the sensor device, we make a comparison between the variations of the amplitude of the sensor signal as a function of the solution concentration at different angles of incidence, as shown in . The measurement data are given by dots with different shapes and the lines with different colors are the corresponding linear fits. It should be noted that the data in have been shifted vertically so that all of them pass through the point of (0, 0) of the coordinates considering that the intensity of the light source changes with time, which may lead to the vertical shift of the amplitude data. Clearly, the smallest slope of both the measured data and the fitting line is observed for an incident angle of 5°, whereas at an incident angle of 25°, the measurement data have the largest slope and the slope drops again when the incident angle is increased further to 28°. Actually, the slope of the plots in corresponds exactly to the sensitivity of the sensor by Δ A/Δ n. Thus, the optimized value of the incident angle is 25° for this sensor device. The sensitivity of the device is measured to be about 4.6 per refractive-index units (RIU); however, this value reduces to about 3.3/RIU at an incident angle of 5°, indicating an enhancement factor of about 1.4 at an 25° incident angle.
Figure 6. Measurements on the amplitude of the sensor signal as a function of the concentration of the sample solution at different angles of incidence. The solid lines show the linear fit to each group of the measurements.
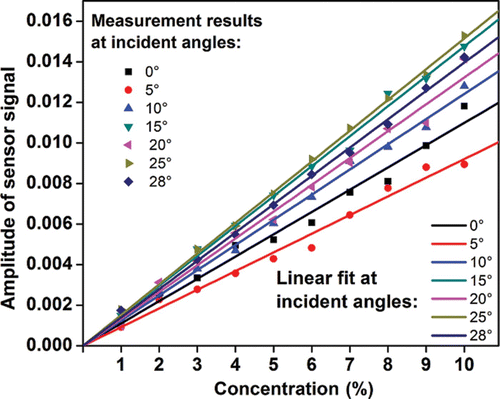
All of the measurements in were performed on the TM polarization Citation11 at room temperature, where the definitions of the polarization direction and the angle of incidence are given in Citation11.
4. Conclusions
We demonstrate an index sensor using waveguided MPCs consisting of periodically arranged gold nanostructures. The coupling between the LSPR and waveguide resonance mode of the waveguide grating structures is the basic principle and the basic mechanism for enhancing the sensitivity of the sensor device. Systematic measurements on spectroscopic response of the sensor device to the change of the concentrations of the glucose/water solutions found that the sensitivity of the sensor may be improved by changing the angle of incidence. The experimental data show a highest sensitivity at an incident angle of 25° with an enhancement factor of about 1.4 with respect to that at an incident angle of 5°.
Acknowledgements
The authors acknowledge the National Key Basic Research Program of China (2013CB922404) and the National Natural Science Foundation of China (11074018, 11274031) for the support.
References
- Nau D, Bertram R P, Buse K, Zentgraf T, Kuhl J, Tikhodeev S G, Gippius N A, Giessen H. Optical switching in metallic photonic crystal slabs with photoaddressable polymers. Appl Phys B.2006;82:543–547 (doi:10.1007/s00340-005-2103-z) doi: 10.1007/s00340-005-2103-z
- Sharon A, Rosenblatt D, Friesem A A. Resonant grating waveguide structures for visible and near-infrared radiation. J Opt Soc Am A.1997;14:2985–2993 (doi:10.1364/JOSAA.14.002985) doi: 10.1364/JOSAA.14.002985
- Zhang X P, Liu H M, Tian J R, Song Y R, Wang L, Song J Y, Zhang G Z. Optical polarizers based on gold nanowires fabricated using colloidal gold nanoparticles. Nanotechnology. 2008;19:1–6;285202
- Nau D, Seidel A, Orzekowsky R B, Deb S H, Giessen H. Hydrogen sensor based on metallic photonic crystal slabs. Opt Lett. 2010;35:3150–3152 (doi:10.1364/OL.35.003150) doi: 10.1364/OL.35.003150
- Zhang X P, Dou F, Liu H M. Molecular concentration sensor based on the diffraction resonance mode of gold nanowire gratings. Nanotechnology. 2010;21:1–7;335501
- Malyarchuk V, Hua F, Mack N H, Velasquez V T, White J O, Nuzzo R G, Rogers J A. High performance plasmonic crystal sensor formed by soft nanoimprint lithography. Opt Express. 2005;13:5669–5675 (doi:10.1364/OPEX.13.005669) doi: 10.1364/OPEX.13.005669
- Roh S, Chung T, Lee B. Overview of the characteristics of micro-and nano-structured surface plasmon resonance sensors. Sensors. 2011;11:1565–1588 (doi:10.3390/s110201565) doi: 10.3390/s110201565
- Zhang S, Bao K, Halas N J, Xu H, Nordlander P. Substrate-induced fano resonances of a plasmonic nanocube: a route to increased-sensitivity localized surface plasmon resonance sensors revealed. Nano Lett. 2011;11:1657–1663 (doi:10.1021/nl200135r) doi: 10.1021/nl200135r
- Zhang X P, Ma X M, Dou F, Zhao P X, Liu H M. A biosensor based on metallic photonic crystals for the detection of specific bioreactions. Adv Funct Mater. 2011;21:4219–4227 (doi:10.1002/adfm.201101366) doi: 10.1002/adfm.201101366
- Zhang X P, Sun B Q, Friend R H, Guo H C, Nau D, Giessen H. Metallic photonic crystals based on solution-processible gold nanoparticles. Nano Lett. 2006;6:651–655 (doi:10.1021/nl052361o) doi: 10.1021/nl052361o
- Zhang X P, Sun B Q, Guo H C, Tetreault N, Giessen H, Friend R H. Large-area two-dimensional photonic crystals of metallic nanocylinders based on colloidal gold nanoparticles. Appl Phys Lett. 2007;90:1–3;133114 doi: 10.1016/j.physletb.2007.02.069