
Abstract
A non-destructive method to determine the percent composition and relative purity of bulk solid phase mixed fullerene samples using Raman spectroscopy is described. This ratiometric method has a significant advantage in ease of use over other methods, in that the samples are analyzed in a short time, as solids in suspension, with minimal sample pre-preparation, using easy to operate instrumentation. The ratio of unique vibrational bands vs. percent composition is used to construct a calibration curve, and a detection limit estimated in the presence of chemical noise.
1. Introduction
The discovery of C60, that resulted in the 1996 Nobel prize in Chemistry for Smalley, Kroto and Curl, was first made in 1985 in a time-of-flight mass spectrometer.[Citation1] Subsequent mass production of fullerenes by Huffman, Kratschmer and co-workers [Citation2] made possible what is currently a vast and exciting area of research, as evidenced by a large number of publications devoted to fullerenes. The reactivity of fullerenes is an area of immense interest for synthetic organic chemists.[Citation3] In addition, fullerenes find a wide variety of applications that include material science [Citation4] and pharmacology.[Citation5]
The ability to determine the purity of materials is of perhaps greater critical importance to the burgeoning field of nanotechnology than conventional bulk scale chemistry. The mass production of fullerenes by the heating graphite under helium results in a mixture of C60, C70 and large fullerenes, the precise relative concentrations of which are largely dependent on experimental conditions.[Citation6] The product mixture contains soot as well as fullerenes, and is typically analyzed via separation by high-performance liquid chromatography, followed by mass spectrometry.[Citation7] It is highly desirable to analyze the composition of such product mixtures in situ, or with minimal sample preparation. Such methods are few and far between, an example [Citation8–Citation12] being near-IR spectrophotometric determination of the composition of a mixture of fullerenes C60 and C70. Raman spectroscopy provides a method whereby one can rapidly determine the composition of a mixed fullerene sample.
We report a simple method for analyzing a mixture of C60 and C70 via Raman spectrometry. This relies on the distinct Raman spectra of these species, which can be acquired in a facile fashion using an inexpensive, portable Raman spectrometer. The advantage of our method is that it can be applied to a solid sample in situ, and would be of considerable interest as an analytical tool to large-scale producers of fullerenes.
2. Experimental
Samples of [Citation5,Citation6]-Fullerene-C70 (98%) and [Citation5,Citation6]-Fullerene-C60 (Sublimed, 99.9%) were obtained from Sigma-Aldrich (St. Louis, MO) and used without further purification. Ultrapure water was prepared by a reverse osmosis Myron L Company: Series 750 HYDRO water purification system. All samples were massed on an analytical balance (Denver Instrument Company – A-160), placed into capped 1 mL glass vials (VWR International, West Chester, PA), 0.200 mL of pure water added, and mixed by a Vortex Genie-2 (Scientific Industries). Spectra were collected on an Advantage NIR 785 nm Raman Spectrometer (Delta Nu, Laramie, WY). The spectrometer's operating parameters were as follows: laser power, low (10 mW); resolution, low; baseline, on; integration time, 1 second and averages, 16. The samples were manually rotated in the sample holder during spectral acquisition.
For the construction of the standard curve, the initial sample contained the stock Fullerene-C60 (99.9%) and 0.200 mL of DI water. Masses of C70 were added in increments of ∼5% by mass to the C60 sample until the mass percent of 50% C60–C70 was obtained. Spectra were obtained after each addition. A second vial was prepared by the additions of 0.200 mL DI water and stock Fullerene-C70 (98%), but with mass additions of ∼5% by mass of C60, until the mass by percent reached 50% C60–C70. Spectra were obtained after each addition.
To test the robustness of the method, a sample of mixed C60–C70 was prepared as above, and its spectrum recorded. Masses of graphitic carbon were added to the sample to ∼11% and ∼20% graphitic carbon, and spectra taken as previously described. To test the robustness of the method in the presence of a constant contaminate, samples with a constant 2% by mass of graphite were prepared, and the relative mass percentage of C60 and C70 were varied, and spectra acquired as above.
3. Results and discussion
3.1. Comparison of spectra
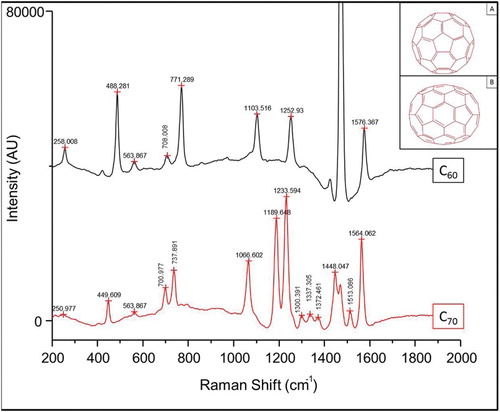
The Raman spectra of C60 and C70 show many similar features, but are unique in several vibrational bands, as shown in . This is expected due to the structural similarly between the two molecules, see in , inset. In effect, C70 is similar to C60, save for the addition of a band of hexagonal faces about its equator. This is reflected in the Raman spectrum, where the band at 1462 cm−1 for C60 is absent for C70, and a “new” band at ∼1448 cm−1 appears, and is likely a shift of the pentagonal “pinch” mode. Several of the peaks in the data are slightly shifted from the solid-state values. This is likely due to interactions between the nanotubes and the aqueous environment, similar to shifts in peaks observed in solvated nanotubes.[Citation9]
Figure 1. Raman spectra and structure (inset) of C60 and C70 fullerenes. The Raman spectra of the two fullerenes are expected to be highly similar, given the extensive structural similarities between the two molecules. There exist a sufficiency of unique spectral features specific to the vibrational modes to readily distinguish between C60 and C70.
3.2. Sampling methodology
A common nuisance in Raman spectroscopy is the presence of a broad background continuum, or “hump”, often of indeterminate origin. This is partially controlled by the application of baseline subtraction methods, here implemented by the spectrometer control software. This spectral noise can come from fluorescence (e.g. of the glass container, sample matrix or sample itself) or, as more probably the case here, from photothermal emission due to excitation from the laser. Indeed, broad band photon emission originating at laser focal point is visible to the naked eye from dry fullerene samples when acquiring Raman spectra from this instrument. Significant gains in the signal-to-noise ratio were realized in this experiment by the addition of a small volume of water to the sample vial. It is likely that the high specific heat of water provides an effective heat sink, lowering the effective temperature below which photothermal emission occurs. Modest improvements in signal quality were also achieved by manually rotating the sample vial in the holder during the course of spectral acquisition. Similar methods have been used in Raman spectroscopy, but often involved mechanical spinners and high spin rates.
3.3. Construction of the calibration curve
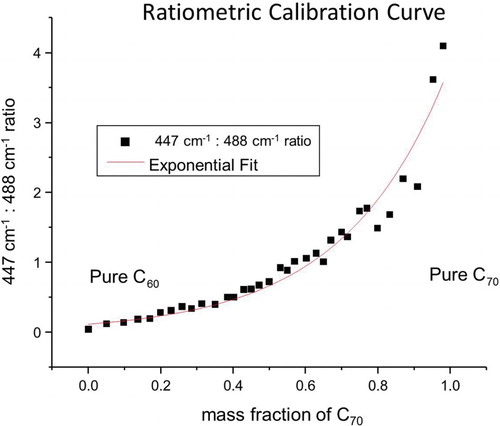
Raman spectroscopy is an incredibly useful analytical tool because it is able to provide both quantitative and qualitative information about a sample. Raman spectroscopy is a vibrational technique, in many way complementary to IR absorbance, but with several distinct advantages. Raman spectroscopy is a scattering technique, and can readily be used on opaque and solid samples, unlike IR absorbance spectroscopy. The exact intensity of Raman scattering from a particular vibrational mode is a complex matter, but, generally, will increase as the number of scatters increases. The vibrational modes for every molecule are characteristic of that molecule, and can act as spectroscopic fingerprint for identification. Although all fullerenes are structurally similar, there are several Raman bands for C60 and C70 that do not significantly overlap and are thus free of spectral congestion. For purposes of convenient illustration, two peaks that lie close together were chosen for analysis, although any spectroscopically distinct peaks could be used for construction of the calibration curve. shows the peak at 488.3 cm−1characteristic of C70 increasing as the mass fraction of C70 is increased. Likewise, the peak at 447.8 cm−1, unique to C60, decreases as the mass fraction of C70 increases. The curves were offset so that the valley (463.7 cm−1) between the peaks at 447.8 and 488.3 cm−1 was the same for all spectra. A calibration curve can thus be created by plotting the ratio of selected scattering peaks unique to C60 and C70 vs. mass percent or other measures of concentration. shows that a nonlinear curve is generated. However, an exponential curve was readily fit to the data using a graphical analysis software package (Origin 6.1, OriginLab Corp., Northampton, MA). Analysis of the spectroscopic data results in a best-fit line with the equation y = 0.1265e3.3989x and a very reasonable fit (R2 = 0.98).
Figure 2. Raman spectra of varying mass fractions of C60 and C70 mixtures. Spectra are offset to be centered at 463.7 cm−1. The arrows indicate the direction of the change in the peaks at 447.8 and 488.3 cm−1 as the mass fraction of C70 increases from 0% to 100%. The 447.8 cm−1 band is unique to C60, and decreases as the relative mass fraction of C70 increases. The 488.3 cm−1 peak is specific to C70, and increases as the mass percent of C70 increases.
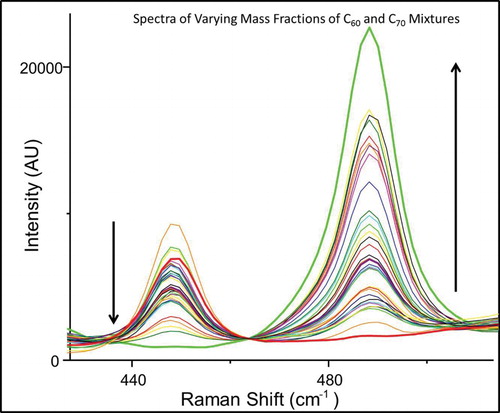
Figure 3. Ratiometric calibration curve. The ratio of the relative (to intensity 463.7 cm−1) peak intensity between the 447.8 and 488.3 cm−1 is plotted as a function of mass fraction of C70. An exponential function was fit to the data with an equation y = 0.1265e3.3989x, with an R2 value of 0.98.
This ratiometric method is preferred because Raman spectra will frequently be superimposed on a broad continuum baseline. The spectrometer's software will correct for this broad baseline “hump”, however the exact function used to subtract the baseline is not always immediately accessible. Therefore, one expects variation in the absolute peak intensities even between sample runs, however, the ratio of one peak to another should depend systemically only on the relative number of each sort of scatterers in the laser's focal spot. These ratios were stable (<1% variation) between spectra taken up to weeks apart.
3.4. Application in the presence of a contaminant
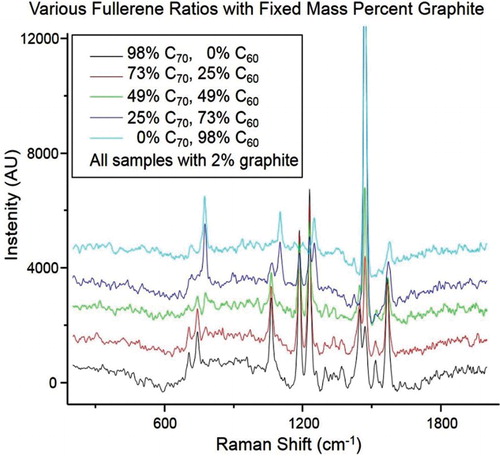
Spectra were obtained of a mixture of fullerenes in the presence of graphitic carbon to test the robustness of this method, and to estimate a limit of detection. demonstrates very useable spectra at ∼11% mass of contaminant. The limit of detection is reached at ∼20% mass contaminant, estimated as 3σ signal-to-noise ratio. Using the calibration curve generated above, the neat mixture is 53% C70. The application of the calibration curve to the spectra of the mixture with 11% mass of contaminant shows that a 51% C70, an error of 2% C70, in good agreement with the ratios determined for the neat sample. Similarly, spectra were obtained of varying mass ratios of fullerenes in the presence of a constant mass percent of the contaminant, as shown in . Here, a steady 2% by mass of graphite was used with decreasing mass percentages (∼100%, 75%, 50%, 25% and 0%) of C70 with a corresponding increase in the mass percent of C60. Peaks associated with C70 diminish and those unique to C60 increase as the mass ratios change from 98% C70 to 98% C60.
Figure 4. Spectra of fullerene mixture in the presence of graphitic carbon. Spectra were collected of a neat fullerene mixture, and after the addition of graphite to the 11% and 20% mass to simulate a carbon contaminate. The 3σ limit of detection is reached when the sample contains 20% by mass of the graphitic carbon. The peak ratios for the neat sample (0.780) agree favorably with that of the 11% by mass contaminant sample (0.730), indicating a mass fraction of 53% and 51% C70, respectively.
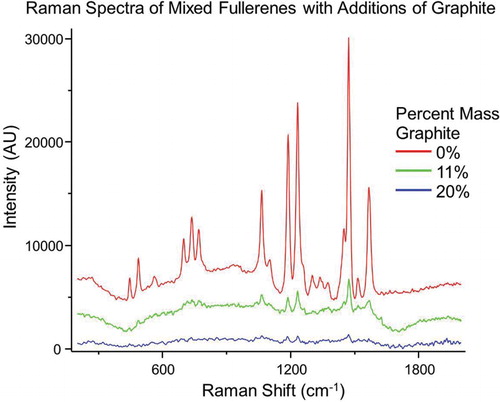
Figure 5. Spectra of various fullerene ratios in the presence of a fixed percent mass of graphitic carbon. Mass ratios of 98%, 73%, 49%, 25% and 0% C70 in the presence of 2% by mass graphite and the 0%, 25%, 49%, 73% and 98% C60 were prepared to show how the peak ratios vary with mass percent of fullerenes, even in the constant presence of a contaminant. Spectra have been offset for clarity. Peaks associated with C70 diminish and those unique to C60 increase as the mass ratios change from 98% C70 to 98% C60.
4. Conclusion
In conclusion, we have demonstrated a simple method for the determination of the relative composition of fullerene mixtures using Raman spectroscopic analysis. We anticipate that this method can be extended to other fullerene systems, for example, higher order fullerenes, multicomponent systems and nanotubes.
Acknowledgements
This work was supported by the National Science Foundation [TUES 1043847]; the University System of Georgia Board of Regents [Stem 2 Initiative] and the University of West Georgia, Department of Chemistry.
References
- Kroto HW, Heath JR, O'Brien SC, Curl RF, Smalley RE. C60: buckminsterfullerene. Nature. 1985;318:162–163. doi: 10.1038/318162a0
- Krätschmer W, Lamb LD, Fostiropoulos K, Huffman DR. Solid C60: a new form of carbon. Nature. 1990;347:354–358. doi: 10.1038/347354a0
- Nierengarten J, Holler M, Deschenaux R. Fullerene containing dendrimers: synthesis and properties. RSC Nanosci Nanotechnol. 2012;20:162–191.
- Stara IG, Stary I. Synthesis of extended polyaromatic hydrocarbons: graphite, fullerene, and carbon nanotube substructures. Sci Synth. 2010;45b:1115–1146.
- Martin N, Solladie N, Nierengarten J. Advances in molecular and supramolecular fullerene chemistry. Electrochem Soc Interface. 2006;15:29–33.
- Tzirakis MD, Orfanopoulos M. Radical reactions of fullerenes: from synthetic organic chemistry to materials science and biology. Chem Rev. 2013;113:5262–5321. doi: 10.1021/cr300475r
- Lin CM, Lu TY. C60 fullerene derivatized nanoparticles and their application to therapeutics. Recent Pat Nanotechnol. 2012;6:105–113. doi: 10.2174/187221012800270135
- Montañez MI, Ruiz-Sanchez AJ, Perez-Inestrosa E. A perspective of nanotechnology in hypersensitivity reactions including drug allergy. Curr Opin Allergy Clin Immunol. 2010;10:297–202. doi: 10.1097/ACI.0b013e32833b1f17
- Talyzin A, Jansson U. C60 and C70 solvates studied by Raman spectroscopy. J Phys Chem B. 2000;104:5064–5071. doi: 10.1021/jp993658b
- Aoyama S, Mieno T. Effects of gravity and magnetic field in production of C60 by a DC arc discharge. Jpn J Appl Phys Part 2. 1999;38:L267–L269. doi: 10.1143/JJAP.38.L267
- Jinno K, Sato Y, Nagashima H, Itoh K. Separation and identification of higher fullerenes by high-performance liquid chromatography coupled with electrospray ionization mass spectrometry. J Microcolumn Sep. 1998;10:79–88. doi: 10.1002/(SICI)1520-667X(1998)10:1<79::AID-MCS11>3.0.CO;2-H
- Tran CD, Grishko VI, Challa S. Near-infrared spectrophotometric determination of compositions of fullerene samples. Spectrochim Acta A Mol Biomol Spectrosc. 2005;62:38–41. doi: 10.1016/j.saa.2004.12.002