
ABSTRACT
Clinical guidelines have recently advised combination therapy involving immunotherapy (IO) and tyrosine kinase inhibitors (TKI) as the first-line therapy approach for advanced renal cell carcinoma (RCC). Nevertheless, there is currently no available biomarker that can effectively distinguish the progression-free survival (PFS). RNA-sequencing and immunohistochemistry were conducted on our cohort of metastatic RCC patients, namely ZS-MRCC, who received combination therapy consisting of IO and TKI. We further applied RNA-sequencing, immunohistochemistry, and flow cytometry to examine the immune cell infiltration and functionality inside the tumor microenvironment of high-risk localized RCC samples. SPP1 expression was significantly higher in non-responders to IO-TKI therapy. Elevated levels of SPP1 were associated with poor PFS in both the ZS-MRCC cohort (HR = 2.73, p = .018) and validated in the JAVELIN Renal 101 cohort (HR = 1.61, p = .004). By multivariate Cox analysis, SPP1 was identified as a significant independent prognosticator. Furthermore, there existed a negative correlation between elevated levels of SPP1 and the presence of GZMB+CD8+ T cells (Spearman’s ρ= −0.48, p < .001). Conversely, SPP1 expression is associated with T cell exhaustion markers. A significant increase in the abundance of Tregs was observed in tumors with high levels of SPP1. Additionally, a machine-learning-based model was constructed to predict the benefit of IO-TKI treatment. High SPP1 is associated with therapeutic resistance and unfavorable PFS in IO-TKI therapy. SPP1 expression have also been observed to be indicative of malfunction and exhaustion in T cells. Increased SPP1 expression has the potential to serve as a potential biomarker for treatment selection of metastatic RCC.
Introduction
Renal cell carcinoma (RCC) is one of the most common solid malignancies worldwide.Citation1,Citation2 Advanced, unresectable, or metastatic RCC (mRCC) leads to cancer-related mortality.Citation1,Citation2 As the first immunotherapy (IO) regimen, high-dose interleukin-2 (IL-2) was approved for patients with metastatic RCC.Citation3 However, high-dose IL-2 only achieved a response rate between 5–9%.Citation3 In recent years, Immune checkpoint inhibitors (ICIs) have emerged as novel IO regimens, with higher response rates and better survival in solid tumors. Recently, the combination of ICI and tyrosine kinase inhibitors (TKI) has been recommended as the first-line treatment for advanced RCC by clinical guidelines.Citation4 Currently, drug resistance is the main obstacle to IO-TKI therapy, with the underlying mechanisms of IO-TKI resistance yet to be fully understood ,Citation5–7
Osteopontin (OPN), encoded by the Secreted Phosphoprotein 1 (SPP1) gene, is a member of the integrin-binding glycophosphoprotein family.Citation8 SPP1 may be a valuable biomarker to track cancer development and can be a predictor of survival, since it is typically overexpressed in many types of malignancies.Citation9–11 As an important regulator of autophagy, apoptosis, stemness, energy metabolism, and drug transport, SPP1 may contribute to resistance to radiation therapy and chemotherapy.Citation12,Citation13 SPP1 also mediates signaling pathways in cancer resistance, including phosphoinositide 3-kinase (PI3K)/AKT signaling pathway,Citation14 mitogen-activated protein kinase (MAPK) signaling pathway,Citation15 and epidermal growth factor receptor (EGFR) signaling pathway.Citation16
SPP1 is expressed in most immune cells including T cells, B cells, NK cells, NKT cells, macrophages, dendritic cells, monocytes, neutrophils, and eosinophils.Citation17 In the tumor microenvironment, SPP1/CD44 was found to be a potential immune checkpoint and contributed to CD8+ T cell suppression and tumor immune evasion.Citation18 SPP1/CD44 was also found to promote the recruitment of tumor-associated macrophages and suppress T cell activation.Citation19 Moreover, SPP1 is also highly expressed in myeloid-derived suppressor cells (MDSCs), a heterogeneous population of immature myeloid cells.Citation20 Expression of SPP1 on MDSCs leads to suppression of both T cells and natural killer cells.Citation21 However, the involvement and mechanism of SPP1 in the tumor microenvironment (TME) is still incompletely understood yet.
In this study, we aimed to explore the prognostic value of SPP1 in RCC under IO-TKI therapy. We also intended to explore its correlation with the tumor microenvironment of RCC. We further intended to build a consensus model for predicting IO-TKI therapy benefits, compared with TKI monotherapy, in advanced RCC.
Materials and methods
Study cohorts and data collection
The study has received approval from the Clinical Research Ethics Committee of Zhongshan Hospital, Fudan University (B2021–119), and adhered to the principles outlined in The Declaration of Helsinki. Informed consent was acquired from each participant.
The ZS-MRCC cohort consisted of 51 patients with mRCC who underwent treatment with a combination of IO-TKI at Zhongshan Hospital, Fudan University between January 2017 and December 2020. The inclusion criteria consisted of diagnosis of mRCC, treatment with IO-TKI therapy, absence of a history of other malignancies, and the availability of tumor sample. Following the exclusion of 6 patients due to unavailable tissue samples or loss of follow-up, a total of 45 patients were deemed eligible for inclusion in the study. Clinical and pathologic data were collected retrospectively from medical records, while information on treatment, response, and survival was also obtained retrospectively. Therapeutic response and disease progression were assessed according to the RECIST 1.1 criteria.Citation22 Briefly, the ZS-MRCC cohort consisted of 55.6% male and 44.4% female participants, with 17.8% classified as favorable IMDC risk group, 68.9% as intermediate IMDC risk group, and 13.3% as poor IMDC risk group. Additionally, 4.4% achieved complete response (CR), 31.1% achieved partial response (PR), 35.6% had stable disease (SD), and 28.9% experienced progressive disease (PD).
In addition to the aforementioned, 43 samples of high-risk localized RCC (HRRCC) previously described in our prior research were obtained.Citation23 After excluding three patients due to unavailable tissue samples or failure to pass sample quality control, a total of 40 patients were deemed eligible for inclusion in the study. Clinical and pathological data were then retrospectively collected from the patients’ medical records. The study’s inclusion criteria comprised patients meeting the following criteria: available tumor sample of pT2a with Grade 3 or 4, N0, M0; pT2b with any Grade, N0, M0; pT3/T4 with any Grade, N0, M0; or any T Stage with any Grade, N1, M0, who underwent radical nephrectomy without neo-adjuvant therapy.
The JAVELIN-101 cohort consisted of 726 individuals diagnosed with metastatic RCC. These patients were divided into two treatment groups: IO-TKI (n = 354) and TKI monotherapy (n = 372). The patients were included in the JAVELIN Renal 101 clinical trial.Citation5 Data on clinical, pathologic, RNA-seq, somatic mutations, and follow-up were obtained from prior research conducted by Robert J. Motzer et. al.Citation5
The TCGA-KIRC cohort consisted of 530 patients diagnosed with clear cell renal cell carcinoma (RCC) from the Cancer Genome Atlas project. Clinical, pathologic, and RNA-seq data were obtained from the UCSC Xena browser (https://xena.ucsc.edu/).Citation24
RNA-sequencing and data processing
The process of total RNA isolation was conducted utilizing the MagBeads Total RNA Extraction Kit (MAJORIVD). The purification of total RNA was conducted using the RNAClean XP Kit (Beckman Coulter) and the RNase-Free DNase Set provided by QIAGEN. The VAHTS Universal V6 RNA-sequencing Library Prep Kit for Illumina (Vazyme) was used for library preparation. The sequencing was carried out by NovaSeq 6000 (Illumina). The construction and sequencing of the library were conducted by Shanghai Biotechnology Corp. in Shanghai, China. The sequencing data was normalized to FPKM and read count value.
Hematoxylin & eosin (H&E) staining and immunohistochemistry
Formalin-fixed paraffin-embedded surgical specimens of surgically resected tissues of HRRCC patients were obtained and prepared for histological assessment. Hematoxylin and eosin (H&E) staining was conducted in accordance with the manufacturer’s guidelines for pathological assessment. Tumor-infiltrating lymphocytes (TILs) were characterized as mononuclear cells, comprising lymphocytes and plasma cells while excluding polymorphonuclear leukocytes and granulocytes, and were assessed on H&E stained sections.
Primary antibodies for immunohistochemistry utilized in the study are documented in Table S1. The immunohistochemistry procedure was performed following the methodology as previously described.Citation25 Digital images were captured using the PANNORAMIC® 250 Flash III DX (3DHISTECH Ltd.) and analyzed with the CaseViewer application (3DHISTECH Ltd.). The quantification of various immune related markers, including CD8, GZMB, CD163, CD4, FOXP3, CD68, CD56, CD86, IFNγ, PD1, PD-L1, CTLA4, and αSMA was determined as the average number of cells per square millimeter. The quantification of CD34+ microvessel density (MVD) was determined as the average number of microvessels per square millimeter. Ki67 expression was assessed by the proportion of tumor cells exhibiting positive Ki67 expression in the nucleus. In order to minimize the influence of intratumoral and inter-observer heterogeneity, quantification procedures were conducted across six randomly selected fields by three independent researchers who were blinded to patient data. Subsequently, the average value was computed for subsequent analysis.
Flow cytometry
The flow cytometry procedures were conducted in the high-risk localized RCC samples according to previously established methods.Citation26 Briefly, peripheral blood samples were obtained and white blood cells were isolated with the addition of RBC Lysis Buffer (Thermo Fisher Scientific). The RCC tissues were obtained following surgical excision tissues, subsequently fragmented, and subjected to enzymatic digestion by collagenase IV and DNase I (Sigma). The resulting mixture was passed through a 70-μm strainer and treated with RBC lysis solution (Thermo Fisher Scientific). Following the blockage of Fc receptors, the process of staining was carried out using antibodies tagged with fluorescent markers specific to the cell membrane at 4°C for 30 minutes. To examine intracellular proteins, fluorochrome-labeled antibodies were employed after treatment with Intracellular Fixation & Permeabilization Buffer (Thermo Fisher Scientific). The flow cytometry data were acquired using the BD LSRFortessa™ X-20. Subsequently, the data were processed and analyzed using Flowjo v10.0 software developed by Tree Star. Comprehensive information regarding antibodies can be found in Table S1.
Bioinformatics approaches
The bioinformatics analyses were executed using the R software platform (https://www.r-project.org/). Survival analyses were conducted by the “survival” and “survminer” packages. Differential gene expression was assessed using the “edgeR” R package, followed by Gene Set Enrichment Analysis (GSEA) on TCGA cohort RNA-seq data utilizing MSigDB’s hallmark gene sets with the “clusterProfiler” R package. The forest plots were generated by the “forestplot” package. The waterfall plot was generated using the “ComplexHeatmap” and “ggplot2” programs. The random forest model was implemented using the “randomForestSRC” and “ggRandomForests” packages.
Statistical analysis
The categorical variables were assessed using chi-square test. Wilcoxon signed ranks test was employed to compare continuous variables across different groups. Spearman’s correlation test was utilized for correlational analysis. Continuous gene expression values were typically divided into high- and low-expression groups based on the median value. Survival analysis was conducted using Kaplan-Meier analysis with log-rank regression. Cox proportional hazard models were employed for prognostic analysis. Data processing was conducted using R software (https://www.r-project.org/).
Results
Elevated SPP1 expression correlated with resistance to IO-TKI therapy
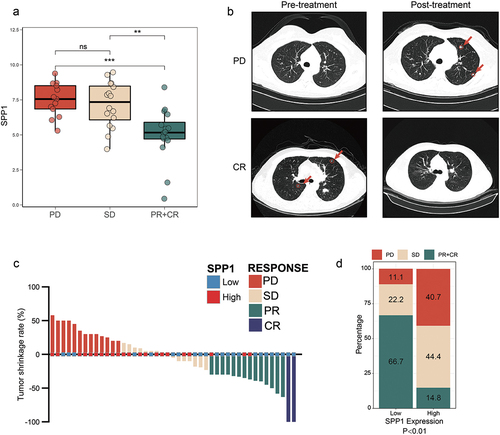
It is widely recognized that IO-TKI therapy exhibits a response in only a subset of patients, and currently lacks a clinically accessible prognostic biomarker. The data obtained in our study provided evidence supporting the clinical benefit of IO-TKI in patients with metastatic RCC (). As previously mentioned, our study focused on the tumor microenvironment and SPP1 has been implicated in the suppression of CD8+ T cells and tumor evasion of the immune response. Thus, we examined the expression of SPP1 in tissue samples obtained from both non-responders and responders. Based on the RECIST 1.1 criteria, the therapeutic response was categorized into four groups: CR, PR, SD, or PD (). In the cohort of ZS-MRCC, there was an observed increase in the expression of SPP1 among those who did not respond to IO-TKI therapy, as compared to responders (PD vs PR+CR, p < .001; SD vs PR+CR, p < .01. ). The presentative chest computed tomographies of PD and CR patients were showed in . The metastases were marked by red circles and arrows. Based on the classification of tumors into high and low SPP1 groups using a cutoff of 40% SPP1 expression, which was calculated by ‘survminer’ package in R. It was observed that tumors with low SPP1 expression were more likely to experience remission, as illustrated in . In comparison to the high SPP1 group, the low SPP1 group exhibited a significant tendency toward achieving complete or partial response (CR+PR) at a rate of 66.7% compared to 14.8% (, p < .01).
Figure 1. SPP1 expression associated with clinical benefits of IO-TKI therapy in RCC.
Elevated SPP1 indicated poor survival of IO/TKI therapy
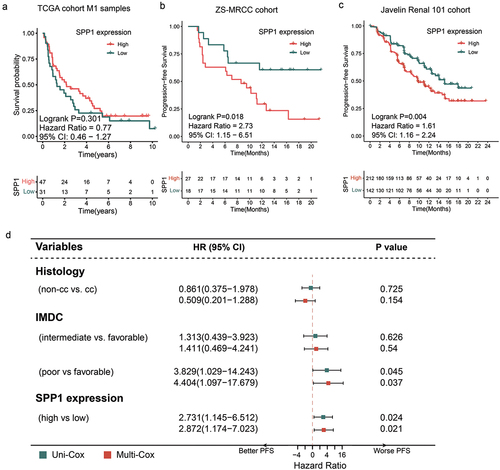
There was no observed statistically significant difference in survival probability between patients with low SPP1 expression and those with high SPP1 expression in the TxNxM1 RCC cohort from TCGA (p = .301, ). This phenomenon may be attributed to the inclusion of patients at various stages of the disease and the utilization of treatment guideline that differ from contemporary clinical practices. Returning to IO-TKI treatment, in our ZS-MRCC cohort, it was shown that a high level of SPP1 was indicative of a lower progression-free survival (PFS) rate (Log-rank p = .018, ). Additionally, it was found that a greater SPP1 level was associated with an increased risk of disease progression (Cox regression hazard ratio (HR) 2.731, 95% confidence interval (CI) 0.145–6.512, p = .024, ). In order to reduce potential bias arising from additional prognostic markers, such as tumor histology (categorized as non-clear cell RCC and clear cell RCC) and International mRCC Database Consortium (IMDC) risk category (categorized as favorable, intermediate, and poor), a multivariate Cox regression analysis was conducted. The study provided evidence that SPP1 exhibited independent prognostic value for IO-TKI therapy, as indicated by an HR of 2.872 (95% confidence interval: 1.174–7.023, p = .021, ). In the JAVELIN Renal 101 cohort, the presence of elevated SPP1 levels was also found to be associated with a significantly shorter PFS (Log-rank p = .004, ). Based on the findings, it can be inferred that an increased level of SPP1 may serve as a potential prognosticator of unfavorable outcomes in the context of IO-TKI therapy.
Figure 2. Prognostic value of SPP1 expression for IO-TKI therapy in metastatic RCC.
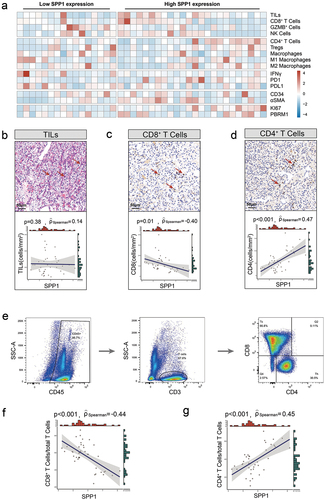
The relationship between SPP1 expression and T cell infiltration
The efficacy of immunotherapy may be contingent upon the tumor microenvironment state. Therefore, the association between SPP1 and components and biomarkers of the TME, including CD8+ cells, CD4+ cells, and Macrophages, as well as immune checkpoint points, were assessed using IHC in the high-risk localized RCC samples (). The mean number of cells/mmCitation2 was used to calculate the density of CD8+ T cells, GZMB+ cells, NK cells (CD56), CD4+ T cells, Tregs (FOXP3), Macrophages (CD68), M1-macrophages (CD86), M2-macrophages (CD163), IFNγ+ cells, PD1+ cells, PD-L1+ cells, CTLA4+ cells, and αSMA+ cells. The CD34+ microvessel density (MVD) was quantified by calculating the average number of microvessels per square millimeter. The quantification of Ki67 expression was determined by calculating the proportion of tumor cells exhibiting positive Ki67 expression within the nucleus. The PBRM1 expression was assessed using the H-score algorithm, which is determined by multiplying the expression category (0 for negative, 1 for weak, 2 for intermediate, and 3 for strong) by the percentage of tumor cells showing positive expression. While there was no observed association between tumor-infiltrating lymphocytes and SPP1 expression (p = .38, ), the application of Spearman’s correlation analysis revealed a negative connection between CD8+ cells and SPP1 expression (Spearman’s ρ=-0.40, p = .01, ), and a positive correlation between CD4+ cells and SPP1 expression (Spearman’s ρ = 0.47, p < .001, ). Flow cytometry was subsequently conducted to ascertain the presence of CD8+ and CD4+ T cells infiltration (). Consistent with the results obtained from IHC, a statistically significant inverse correlation was established between SPP1 and CD8+ T cells (Spearman’s ρ=-0.44, p < .001, ). Additionally, a positive correlation was found between SPP1 with CD4+ T cells (Spearman’s ρ = 0.45, p < .001, ).
Figure 3. Association between SPP1 and T cell infiltration in RCC.
SPP1 correlated with dysfunctional CD8+ T cells
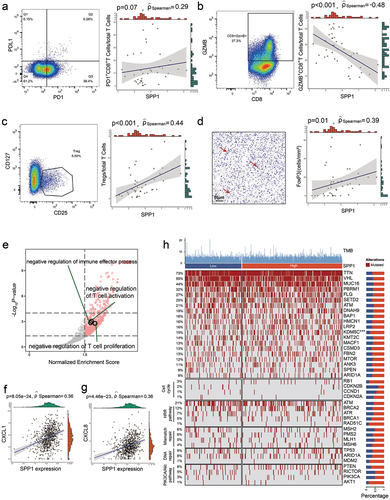
T cells play a vital role as regulators in the fight against tumors. However, T cells undergo a condition of malfunction or exhaustion characterized by prolonged expression of inhibitory receptors and a different transcriptional profile that differs from that of functional effector or memory T cells. Hence, flow cytometry was employed to further assess the functional condition of tumor-infiltrating lymphocytes. A negative correlation was seen between the quantity of cytotoxic GZMB+CD8+ T cells and the expression of SPP1 (Spearman’s ρ=-048., p < .001, ), while a positive correlation was seen between the quantity of PD1+CD8+ T cells and the expression of SPP1 (Spearman’s ρ = 0.29, p = .07, ).
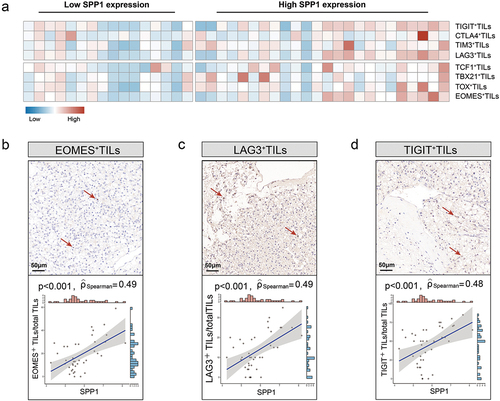
Figure 4. SPP1 is associated with T cell dysfunction and tregs infiltration in RCC.
The findings of the study demonstrated a significant association between the expression of SPP1 and the presence of malfunctioning CD8+ T cells. Additionally, immunohistochemistry was employed to examine the level of T cell exhaustion (). A noteworthy positive correlation was seen between EOMES (Spearman’s ρ = 0.49, p < .001, ), LAG3 (Spearman’s ρ = 0.49, p < .001, ), TIGIT (Spearman’s ρ = 0.48, p < .001, ) and SPP1. The findings of this study suggested a possible association between SPP1 and the mechanisms underlying T cell exhaustion.
Figure 5. SPP1 is related with T cell exhaustion in RCC.
Immunosuppressive tumor-infiltrating cells, including regulatory T cells (Tregs) and macrophages, are considered potential regulatory mechanisms involved in the process of T cell exhaustion. The present study investigated the association between Treg, macrophages, and the expression of SPP1. A significant association was observed between Tregs (CD4(+), CD25(+), CD127(-/low) cells) and SPP1 levels, as determined by flow cytometry (Spearman’s ρ = 0.44, p < .001, ). This correlation was further validated using formalin-fixed paraffin-embedded tissues, where FoxP3 expression was assessed by immunohistochemistry (Spearman’s ρ = 0.39, p = .01, ). In contrast, our findings did not reveal any significant correlation between macrophages and SPP1 expression, as determined by both flow cytometry and IHC. Besides, through GSEA analysis performed by the ‘clusterProfiler’ package, we found that negative regulation of T cell proliferation, negative regulation of T cell activation, and negative regulation of immune effector process were enriched in high-SPP1 samples (). Additionally, the association between SPP1 and suppressive factor was assessed in RCC. A significant positive connection was observed between CXCL1 (Spearman’s ρ = 0.36, p = 8.05e − 24) and CXCL8 (Spearman’s ρ = 0.36, p = 4.46e − 23) ().
Correlation between SPP1 and RCC mutations
The Javelin renal 101 cohort was utilized to evaluate the correlation between SPP1 and tumor-driving mutations (). The only mutation that exhibited a statistically significant association with SPP1 expression was the KDM5C mutation (p < .001, ).
Integrated risk model for RCC treatment selection
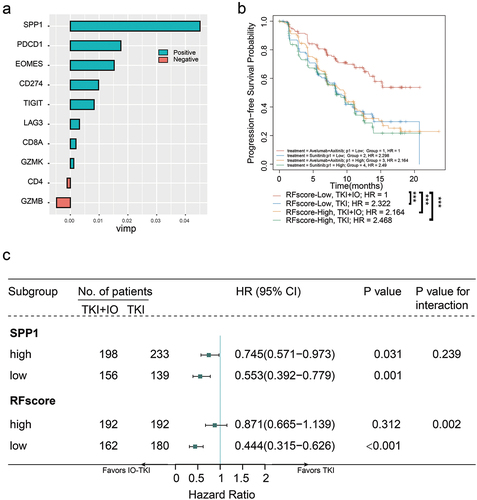
The implementation of treatment selection strategies that took into account molecular subtypes has the potential to enhance survival outcomes in patients with metastatic RCC who are treated with IO-TKI treatment. The current state of IO-TKI combo therapy lacks a predictive biomarker. The random forest method was utilized in this study to develop a novel risk model for the purpose of selecting between IO-TKI and TKI monotherapy treatments. The integrated expression of genes, namely SPP1, PD1, EOMES, PDL1, TIGIT, LAG3, GZMK, CD8A, CD4, and GZMB, was incorporated into the random forest model (RFscore) as depicted in . The subgroup of patients with a low RFscore who received IO-TKI treatment had a more positive outcome when compared to the other three groupings of patients (p < .001, ). A univariate Cox regression analysis was conducted to examine the relationship between RFscore subgroups and PFS in the avelumab+axitinib arm compared to the sunitinib arm. The results indicated that the low RFscore subgroup in the avelumab+axitinib arm had a significant tendency toward longer PFS compared to the sunitinib arm (HR 0.444, 95% CI 0.315–0.626, p < .001, p-value for interaction = 0.002, ). Conversely, the high RFscore subgroup did not demonstrate prognostic value in therapy selection (HR 0.871, 95% CI 0.665–1.139, p = .312, ). The findings suggested that the RFscore has the potential to assist in identifying a subgroup of mRCC patients who probably extended progression-free survival when treated with IO-TKI combined therapy. In summary, the integrated RFscore has the potential to serve as a predictive tool for assessing the benefit of IO-TKI treatment in metastatic RCC patients.
Figure 6. An integrated risk score model for IO-TKI benefit versus TKI monotherapy.
Discussion
SPP1 is an immune-modulating molecule commonly expressed in most immune cells,Citation17 but the involvement and mechanism of SPP1 in the tumor microenvironment are still incompletely understood. In the study, SPP1 was related to poor prognosis in two IO-TKI treated RCC cohorts. SPP1 overexpression also indicated IO-TKI resistance. Moreover, SPP1 was associated with suppressed CD8+ T cell function in the tumor microenvironment.
The recent clinical trials including JAVELIN 101,Citation5 KEYNOTE 426,Citation6 CheckMate 9ER,Citation27 and CLEARCitation28 showed the prior role of IO-TKI therapy in advanced RCC, compared with sunitinib. However, only a subgroup of patients responds to IO-TKI therapy, and no biomarker is clinically available. When conducting a biomarker study, PDL1 must be a primary metric to consider due to its direct association with immunotherapy. The investigation of Javelin Renal 101 indicated that the presence of PD-L1 did not yield a statistically significant effect on PFS in the combined therapy. Nonetheless, individuals with PD-L1+ tumors in the sunitinib arm exhibited a reduced median PFS relative to those with PD-L1- tumors.Citation29 The observations of the KEYNOTE-426 trial corroborated the outcomes of Javelin Renal 101, which assessed the combination of pembrolizumab and axitinib versus sunitinib. They proposed that the detection of PD-L1 on tumor cells or immune cells may not serve as a reliable prognostic indicator for favorable results in RCC.Citation6 On the contrary, a contrasting phenomenon was observed in other trials.Citation7,Citation30 These results demonstrated the challenges of biomarker research, particularly in IO-TKI therapy, due to its multiple confounding factors, including different characterized cohort and different compounds. Moreover, previous studies have not identified mutations or tumor mutational burden (TMB) that were significantly correlated with responses to immunotherapy ,Citation29–31 It has been observed that decreased expression of MHC-I was linked to a decrease in PFS in patients with RCC treated with a combination of IO-TKI.Citation29 However, the absence of supporting evidence may suggest that no specific mutations were associated with poor outcomes in the treatment of RCC.
In addition to next-generation sequencing, researchers explored an alternative method involving histologic slides. The presence of a 1000-μm wide invasive margin (IM) at the interface between malignant and adjacent normal tissue was found to be linked to both combination therapy and TKI monotherapy.Citation29 The presence of CD8+ cells in both the tumor center and IM may serve as indicators of immune cell activity and potentially influence PFS. In the context of immunotherapy, the efficacy of TKI agents may be compromised by hindered CD8+ T cell migration or altered cytotoxic cell function. However, the evaluation of histological slides utilizing H&E or IHC presents difficulties, such as tumor heterogeneity and uncertainty of observation of pathologists, which may result in divergent interpretations and conclusions.
An alternative method for developing prognostic factors involved the construction of pathway signatures using single-sample gene set enrichment analysis (ssGSEA), least absolute shrinkage and selection operator (LASSO) regression, or machine learning techniques. These approaches relied on RNA sequencing data. For instance, our research indicated that pathway signatures involving alternative complement, Heme Oxygenase-1 (HMOX1), and RUNX Family Transcription Factor 3 (RUNX3) pathway signatures were associated with a negative response to IO-TKI therapy,Citation23,Citation32,Citation33 Nevertheless, this particular signature encompassed a large number of genes, offering insight into a prognosis-related signaling pathway rather than a specific gene with potential for novel treatment development. Moreover, the feasibility of RNA sequencing for all patients, particularly those in underdeveloped regions, is hindered by cost and sample limitation of accessibility. Alternatively, single-gene prognostic factors can be assessed using IHC, a cost-effective method that enables analysis of needle biopsy samples. Based on this strategy, we identified significant potential prognostic factors, such as CDK5, PYCR1, and ADAM9 ,Citation34–36 Specifically, CDK5 was found to be associated with T cell exhaustion. Nevertheless, the signaling pathways associated with each gene differed, underscoring the necessity for prospective validation to enhance the reliability and reproducibility of these biomarkers.
In the current study, SPP1 is a valuable biomarker for cancer development and survival ,Citation9–11 and it contributes to the therapeutic resistance of radiation therapy and chemotherapy in tumors.Citation12,Citation13 Previous study has indicated that the expression of SPP1 is associated with poor progression-free survival, rather than overall survival or disease-specific survival.Citation37 Nevertheless, the study cohort comprises just 23.7% of metastatic cases. In the present study, we found no statistically significant disparity in survival probability between patients with low SPP1 expression and those with high SPP1 expression in the TxNxM1 RCC cohort from TCGA (p = .301, ). SPP1 is also related to central signaling pathways of cancer resistance, including PI3K/AKT signaling pathway,Citation14 MAPK signaling pathway,Citation15 and EGFR signaling pathway.Citation16 In the current study, SPP1 was associated with therapeutic resistance and poor PFS in two independent cohorts of advanced RCC (). SPP1 also predicted benefit of IO-TKI combination therapy in RCC (). These results demonstrated that SPP1 could be a potential prognostic factor, for IO-TKI resistance and PFS in RCC.
SPP1 is an immune-modulating molecule commonly expressed in most immune cells.Citation17 In the tumor microenvironment, SPP1/CD44 is a potential immune checkpoint for CD8+ T cell suppression.Citation18 In the current study, SPP1 was also demonstrated to be associated with CD8+ T cell exhaustion (). The correlation between SPP1 and CD8+ T cell suppression could be potentially due to the recruitment of tumor-associated macrophages,Citation19 and MDSCs.Citation20 However, the mechanism of SPP1 for immune evasion still needs further investigation.
Based on the findings of the present research, a statistically significant correlation was identified between Tregs and SPP1 expression levels (). Several studies have provided evidence that the augmentation of Tregs promotes the evasion of tumors from the immune system. Tregs have the ability to suppress the activation of self-reactive CD4+ T cells and so prevent the initiation of autoimmunity by effector CD8+ T cells. The proliferation or activation of Tregs significantly hampers the immune response against tumors.Citation38 Clinically, there is a correlation between the augmentation of Tregs within the TME of breast, gastric, ovarian, pancreatic, and hepatocellular carcinomas and an unfavorable prognosis. Mechanistically, Tregs possess the capacity to impede various anti-tumor immune responses and additionally facilitate the regeneration of angiogenesis within the tumor microenvironment.Citation39 Nevertheless, several studies have also reported that the accumulation of Tregs in colorectal cancers and head and neck malignancies is correlated with a positive prognosis.Citation40,Citation41 Several factors contribute to the apparent inconsistencies observed in these results, including the function of Tregs, the infiltration of cytotoxic T cells, and the immunogenicity of tumor cells.
It remained uncertain whether KDM5C mutation contributes to the regulation of osteogenesis related gene expression and its downstream function. A previous study demonstrated that the deletion of KDM5C in conventional knockout mice led to a notable impairment in osteogenic differentiation, by reduced mRNA levels of osteogenic markers such as SPP1.Citation42 IHC staining further revealed decreased level of osteopontin in the trabecular bone and bone cortex of the femur in KDM5C knockout mice. The Kyoto Encyclopedia of Genes and Genomes (KEGG) pathway analysis revealed that KDM5C knockout cells exhibited enrichment in multiple signaling pathways associated with bone development, including PI3K-AKT, WNT, HIPPO, HIF1α, and Transforming growth factor-β (TGFβ) signaling pathways. However, the findings were validated in cellular experiments of breast cancer, revealing that the downregulation of KDM5C resulted in decreased expression levels of CXCL1, CXCL2, CXCL3, and CXCL8.Citation43 Tumors with altered KDM5C exhibited a notably elevated TMB and were correlated with a significantly increased level of CD8+ T cell infiltration and T effector signature.Citation44 Furthermore, the absence of KDM5C in RCC enhanced tumorigenic potential through the alteration of glycogen metabolism and suppression of ferroptosis.Citation45 The frequency of KDM5C mutations varied between high and low SPP1 groups in current study, warranting further investigation into the potential relationship between them.
The major limitation of the study was the retrospective design and the limited sample size. It is an observational study based on the next-generation sequencing. Despite the IHC and flow cytometry were employed to confirm alterations in the TME, the absence of biological experiments to elucidate the underlying mechanisms restricted the overall significance of the study. It has been shown that OPN was significantly upregulated in both myeloid-derived suppressor cells with polymorphonuclear morphology (PMN-MDSCs) and tumor cells, which were key constituents of the tumor microenvironment.Citation18 OPN has the ability to directly inhibit the proliferation and IFNγ production of CD8+ T cells, which were the main effector cells responsible for immune surveillance and the elimination of malignant cells. The transcriptome sequencing analysis conducted in this study evaluated the bulk expression of SPP1 in tumor samples. To delve deeper into the role of SPP1 in specific cell populations, such as tumor cells or T cells, additional experiments utilizing in vitro and in vivo approaches are required. Specifically, a co-culture system involving SPP1ko RCC cells and SPP1wt T cells, or vice versa, could provide valuable insights. Additionally, the use of a conditional knockout mouse model may be beneficial for in vivo studies. Furthermore, the application of single cell sequencing techniques could further enhance the investigation. Besides, IO-IO therapy was not evaluated in the study, which needs further investigation. The detailed mechanism between SPP1 and immune evasion also needs to be clarified in the future.
Due to the more stringent inclusion criteria, there were few cohorts of investigator-initiated trial have been conducted based on the radical nephrectomy samples of mRCC patients. Through retrospective analysis of the current study, together with other published datasets, we have provided evidence to confirm the prognostic role of SPP1, defined its correlation with TME and T cell exhaustion. These findings may inform personalized therapeutic strategies for patients with mRCC and other tumor types. Moreover, the study showed the probability of combined anti-SPP1 and IO-TKI, which has no clinical application yet. We expect to investigate it in future studies.
Conclusion
The high expression of SPP1 has been found to be indicative of therapeutic resistance and a shorter PFS in the context of IO-TKI therapy in mRCC. There was also a correlation observed between elevated SPP1 expression and the presence of dysfunctional and exhausted CD8+ T cells in RCC. The utilization of the integrated RFscore, which combines the assessment of SPP1 expression and other immunologic factors, has the potential to provide valuable guidance in the selection of treatment between IO-TKI combination therapy and TKI monotherapy in patients with metastatic renal cell carcinoma.
Author contributions
Xianglai Xu: Data curation, Formal analysis, Investigation, Writing – original draft. Jinglai Lin: Methodology, Software. Jiahao Wang: Investigation, Writing – original draft. Ying Wang: Investigation. Yanjun Zhu: Supervision, Writing – review & editing. Jiajun Wang: Software, Supervision, Writing – review & editing. Jianming Guo: Conceptualization, Supervision, Writing – review & editing. All authors read and approved the manuscript.
Ethical statement
Approval of the research protocol by an Institutional Reviewer Board: This study was approved by Ethics Review Committees/Institutional Review Boards of Zhongshan Hospital, Fudan University (B2021–119). Informed Consent: All participants involved in this article signed informed consent.
Supplementary Table S1.doc
Download MS Word (53.5 KB)Acknowledgments
We are sincerely grateful to all authors and data collectors of the JAVELIN Renal 101 trial and the Cancer Genome Atlas database for their data sharing.
Disclosure statement
No potential conflict of interest was reported by the author(s).
Data availability statement
Data from the study can be shared with other researchers upon reasonable request, according to the data-sharing policy.
Supplementary materials
Supplemental data for this article can be accessed on the publisher’s website at https://doi.org/10.1080/21645515.2024.2350101
Additional information
Funding
References
- Hsieh JJ, Purdue MP, Signoretti S, Swanton C, Albiges L, Schmidinger M, Heng DY, Larkin J, Ficarra V. Renal cell carcinoma. Nat Rev Dis Primers. 2017;3(1):17009. doi:10.1038/nrdp.2017.9.
- Choueiri TK, Motzer RJ, Longo DL. Systemic therapy for metastatic renal-cell carcinoma. N Engl J Med. 2017;376(4):354–13. doi:10.1056/NEJMra1601333.
- Fyfe G, Fisher RI, Rosenberg SA, Sznol M, Parkinson DR, Louie AC. Results of treatment of 255 patients with metastatic renal cell carcinoma who received high-dose recombinant interleukin-2 therapy. J Clin Oncol. 1995;13(3):688–96. doi:10.1200/JCO.1995.13.3.688.
- Ljungberg B, Albiges L, Abu-Ghanem Y, Bedke J, Capitanio U, Dabestani S, Fernández-Pello S, Giles RH, Hofmann F, Hora M, et al. European association of urology guidelines on renal cell carcinoma: the 2022 update. Eur Urol. 2022;82(4):399–410. doi:10.1016/j.eururo.2022.03.006.
- Motzer RJ, Penkov K, Haanen J, Rini B, Albiges L, Campbell MT, Venugopal B, Kollmannsberger C, Negrier S, Uemura M, et al. Avelumab plus axitinib versus sunitinib for advanced renal-cell carcinoma. N Engl J Med. 2019;380(12):1103–15. doi:10.1056/NEJMoa1816047.
- Rini BI, Plimack ER, Stus V, Gafanov R, Hawkins R, Nosov D, Pouliot F, Alekseev B, Soulières D, Melichar B, et al. Pembrolizumab plus axitinib versus sunitinib for advanced renal-cell carcinoma. N Engl J Med. 2019;380(12):1116–27. doi:10.1056/NEJMoa1816714.
- Motzer RJ, Tannir NM, McDermott DF, Arén Frontera O, Melichar B, Choueiri TK, Plimack ER, Barthélémy P, Porta C, George S, et al. Nivolumab plus ipilimumab versus sunitinib in advanced renal-cell carcinoma. N Engl J Med. 2018;378(14):1277–90. doi:10.1056/NEJMoa1712126.
- Hao C, Lane J, Jiang WG. Osteopontin and cancer: insights into its role in drug resistance. Biomedicines. 2023;11(1):197. doi:10.3390/biomedicines11010197.
- Yan CH, Lv M, Li H, Song X, Yan F, Cao S, Ren X. Osteopontin is a novel prognostic biomarker in early-stage non-small cell lung cancer after surgical resection. J Cancer Res Clin Oncol. 2015;141(8):1371–8. doi:10.1007/s00432-014-1902-1.
- Zhao H, Chen Q, Alam A, Cui J, Suen KC, Soo AP, Eguchi S, Gu J, Ma D. The role of osteopontin in the progression of solid organ tumour. Cell Death Disease. 2018;9(3):356. doi:10.1038/s41419-018-0391-6.
- Wei R, Wong JPC, Kwok HF. Osteopontin – a promising biomarker for cancer therapy. J Cancer. 2017;8(12):2173–83. doi:10.7150/jca.20480.
- Huang X, Qian Y, Wu H, Xie X, Zhou Q, Wang Y, Kuang W, Shen L, Li K, Su J, et al. Aberrant expression of osteopontin and E-cadherin indicates radiation resistance and poor prognosis for patients with cervical carcinoma. J Histochem Cytochem. 2015;63(2):88–98. doi:10.1369/0022155414561329.
- Luo S-D, Chen Y-J, Liu C-T, Rau K-M, Chen Y-C, Tsai H-T, Chen C-H, Chiu T-J. Osteopontin involves cisplatin resistance and poor prognosis in oral squamous cell carcinoma. Biomed Res Int. 2015;2015:1–13. doi:10.1155/2015/508587.
- Ding K, Fan Lu, Chen S, Wang Y, Yu H, Sun Y, Yu J, Wang Li, Liu X, Liu Y, et al. Overexpression of osteopontin promotes resistance to cisplatin treatment in HCC. Oncol Rep. 2015;34(6):3297–303. doi:10.3892/or.2015.4306.
- Cui J, Wang J, Lin C, Liu J, Zuo W. Osteopontin mediates cetuximab resistance via the MAPK pathway in NSCLC cells. Onco Targets Ther. 2019;12:10177–85. doi:10.2147/OTT.S228437.
- Chakraborty S, Li L, Puliyappadamba VT, Guo G, Hatanpaa KJ, Mickey B, Souza RF, Vo P, Herz J, Chen M-R, et al. Constitutive and ligand-induced EGFR signalling triggers distinct and mutually exclusive downstream signalling networks. Nat Commun. 2014;5(1):5811. doi:10.1038/ncomms6811.
- Moorman HR, Poschel D, Klement JD, Lu C, Redd PS, Liu K. Osteopontin: a key regulator of tumor progression and immunomodulation. Cancers Basel. 2020;12(11):3379. doi:10.3390/cancers12113379.
- Klement JD, Paschall AV, Redd PS, Ibrahim ML, Lu C, Yang D, Celis E, Abrams SI, Ozato K, Liu K. An osteopontin/CD44 immune checkpoint controls CD8+ T cell activation and tumor immune evasion. J Clin Invest. 2018;128(12):5549–60. doi:10.1172/JCI123360.
- Wei J, Marisetty A, Schrand B, Gabrusiewicz K, Hashimoto Y, Ott M, Grami Z, Kong L-Y, Ling X, Caruso H, et al. Osteopontin mediates glioblastoma-associated macrophage infiltration and is a potential therapeutic target. J Clin Invest. 2019;129(1):137–49. doi:10.1172/JCI121266.
- Diaz-Montero CM, Salem ML, Nishimura MI, Garrett-Mayer E, Cole DJ, Montero AJ. Increased circulating myeloid-derived suppressor cells correlate with clinical cancer stage, metastatic tumor burden, and doxorubicin–cyclophosphamide chemotherapy. Cancer Immunol Immunother. 2009;58(1):49–59. doi:10.1007/s00262-008-0523-4.
- Ostrand-Rosenberg S, Sinha P. Myeloid-derived suppressor cells: linking inflammation and cancer. J Immunol. 2009;182(8):4499–506. doi:10.4049/jimmunol.0802740.
- Eisenhauer EA, Therasse P, Bogaerts J, Schwartz LH, Sargent D, Ford R, Dancey J, Arbuck S, Gwyther S, Mooney M, et al. New response evaluation criteria in solid tumours: revised RECIST guideline (version 1.1). Eur J Cancer. 2009;45(2):228–47. doi:10.1016/j.ejca.2008.10.026.
- Wang J, Zhang S, Wang Y, Zhu Y, Xu X, Guo J. Alternative complement pathway signature determines immunosuppression and resistance to immunotherapy plus tyrosine kinase inhibitor combinations in renal cell carcinoma. Urol Oncol. 2023;41(1):51.13–23. doi:10.1016/j.urolonc.2022.09.009.
- Goldman MJ, Craft B, Hastie M, Repečka K, McDade F, Kamath A, Banerjee A, Luo Y, Rogers D, Brooks AN, et al. Visualizing and interpreting cancer genomics data via the xena platform. Nat Biotechnol. 2020;38(6):675–8. doi:10.1038/s41587-020-0546-8.
- Wang J, Liu L, Bai Q, Ou C, Xiong Y, Qu Y, Wang Z, Xia Y, Guo J, Xu J, et al. Tumor-infiltrating neutrophils predict therapeutic benefit of tyrosine kinase inhibitors in metastatic renal cell carcinoma. Oncoimmunology. 2019;8(1):e1515611. doi:10.1080/2162402X.2018.1515611.
- Xu X, Wang Y, Chen Z, Zhu Y, Wang J, Guo J. Unfavorable immunotherapy plus tyrosine kinase inhibition outcome of metastatic renal cell carcinoma after radical nephrectomy with increased ADAM9 expression. Immunogenetics. 2022;75(2):133–43. doi:10.1007/s00251-022-01292-3.
- Choueiri TK, Powles T, Burotto M, Escudier B, Bourlon MT, Zurawski B, Oyervides Juárez VM, Hsieh JJ, Basso U, Shah AY, et al. Nivolumab plus cabozantinib versus sunitinib for advanced renal-cell carcinoma. N Engl J Med. 2021;384(9):829–41. doi:10.1056/NEJMoa2026982.
- Motzer R, Alekseev B, Rha S-Y, Porta C, Eto M, Powles T, Grünwald V, Hutson TE, Kopyltsov E, Méndez-Vidal MJ, et al. Lenvatinib plus pembrolizumab or everolimus for advanced renal cell carcinoma. N Engl J Med. 2021;384(14):1289–300. doi:10.1056/NEJMoa2035716.
- Motzer RJ, Robbins PB, Powles T, Albiges L, Haanen JB, Larkin J, Mu XJ, Ching KA, Uemura M, Pal SK, et al. Avelumab plus axitinib versus sunitinib in advanced renal cell carcinoma: biomarker analysis of the phase 3 JAVELIN renal 101 trial. Nat Med. 2020;26(11):1733–41. doi:10.1038/s41591-020-1044-8.
- McDermott DF, Huseni MA, Atkins MB, Motzer RJ, Rini BI, Escudier B, Fong L, Joseph RW, Pal SK, Reeves JA, et al. Clinical activity and molecular correlates of response to atezolizumab alone or in combination with bevacizumab versus sunitinib in renal cell carcinoma. Nat Med. 2018;24(6):749–57. doi:10.1038/s41591-018-0053-3.
- Braun DA, Hou Y, Bakouny Z, Ficial M, Sant’ Angelo M, Forman J, Ross-Macdonald P, Berger AC, Jegede OA, Elagina L, et al. Interplay of somatic alterations and immune infiltration modulates response to PD-1 blockade in advanced clear cell renal cell carcinoma. Nat Med. 2020;26(6):909–18. doi:10.1038/s41591-020-0839-y.
- Xu X, Zhang S, Wang Y, Zhu Y, Wang J, Guo J. HMOX1 pathway signature predicts clinical benefit from immunotherapy plus tyrosine kinase inhibitor therapy in advanced renal cell carcinoma. Cancer Med. 2023;12(9):10512–25. doi:10.1002/cam4.5787.
- Wang J, Zhang S, Wang Y, Zhu Y, Xu X, Guo J. RUNX3 pathway signature predicts clinical benefits of immune checkpoint inhibition plus tyrosine kinase inhibition in advanced renal cell carcinoma. BMC Urol. 2024;24(1):8. doi:10.1186/s12894-023-01356-w.
- Xu X, Wang Y, Chen Z, Zhu Y, Wang J, Guo J. Favorable immunotherapy plus tyrosine kinase inhibition outcome of renal cell carcinoma patients with low CDK5 expression. Cancer Res Treat. 2023;55(4):1321–36. doi:10.4143/crt.2022.1532.
- Xu X, Wang Y, Hu X, Zhu Y, Wang J, Guo J. Effects of PYCR1 on prognosis and immunotherapy plus tyrosine kinase inhibition responsiveness in metastatic renal cell carcinoma patients. Neoplasia. 2023;43:100919. doi:10.1016/j.neo.2023.100919.
- Xu X, Wang Y, Chen Z, Zhu Y, Wang J, Guo J. Unfavorable immunotherapy plus tyrosine kinase inhibition outcome of metastatic renal cell carcinoma after radical nephrectomy with increased ADAM9 expression. Immunogenetics. 2023;75(2):133–43. doi:10.1007/s00251-022-01292-3.
- Rabjerg M. Identification and validation of novel prognostic markers in renal cell carcinoma. Dan Med J. 2017;64(10).
- Nishikawa H, Kato T, Tawara I, Saito K, Ikeda H, Kuribayashi K, Allen PM, Schreiber RD, Sakaguchi S, Old LJ, et al. Definition of target antigens for naturally occurring CD4(+) CD25(+) regulatory T cells. J Exp Med. 2005;201(5):681–6. doi:10.1084/jem.20041959.
- Chaudary N, Hill RP. Hypoxia and metastasis. Clin Cancer Res. 2007;13(7):1947–9. doi:10.1158/1078-0432.CCR-06-2971.
- Ladoire S, Martin F, Ghiringhelli F. Prognostic role of FOXP3+ regulatory T cells infiltrating human carcinomas: the paradox of colorectal cancer. Cancer Immunol Immunother. 2011;60(7):909–18. doi:10.1007/s00262-011-1046-y.
- Bron L, Jandus C, Andrejevic‐Blant S, Speiser DE, Monnier P, Romero P, Rivals J-P. Prognostic value of arginase-II expression and regulatory T-cell infiltration in head and neck squamous cell carcinoma. Int J Cancer. 2013;132(3):E85–93. doi:10.1002/ijc.27728.
- Li Y, Ding L, Zhang Y, Zhou B, Wai Man GC, Wang M, Li J, Liu Y, Lin W, Wang H, et al. Histone demethylase Kdm5c regulates osteogenesis and bone formation via PI3K/Akt/HIF1α and Wnt/β-catenin signaling pathways. Genes Dis. 2024;11(1):64–6. doi:10.1016/j.gendis.2023.02.041.
- Xiao Q, Wang C-Y, Gao C, Chen J-D, Chen J-J, Wang Z, Ju L-G, Tang S-B, Yao J, Li F, et al. Regulation of KDM5C stability and enhancer reprogramming in breast cancer. Cell Death Disease. 2022;13(10):843. doi:10.1038/s41419-022-05296-5.
- Chen XJ, Ren AQ, Zheng L, Zheng ED. Predictive value of KDM5C alterations for immune checkpoint inhibitors treatment outcomes in patients with cancer. Front Immunol. 2021;12:664847. doi:10.3389/fimmu.2021.664847.
- Zheng Q, Li P, Zhou X, Qiang Y, Fan J, Lin Y, Chen Y, Guo J, Wang F, Xue H, et al. Deficiency of the X-inactivation escaping gene KDM5C in clear cell renal cell carcinoma promotes tumorigenicity by reprogramming glycogen metabolism and inhibiting ferroptosis. Theranostics. 2021;11(18):8674–91. doi:10.7150/thno.60233.