
ABSTRACT
Informal urban communities (IUCs) in sub-Saharan Africa constitute some two-thirds of SSA cities. IUCs are often associated with lower-quality housing, low-income populations, low car ownership, and poor mobility infrastructure. As such, most IUC dwellers rely on shared mobility modes that are unsafe and inconvenient. The current study examines potential and perceived access in terms of travel distance and time to six selected socioeconomic activity types in selected IUCs in Kumasi-Ghana, and Dar es Salaam-Tanzania. This was underpinned by evaluating residents’ perception of ease of access to workplace in relation to demographics, neighborhood characteristics, transport services characteristics, and travel characteristics. The applied multinomial logistic regression identified factors relating to age, education, income, travel time, road condition, access to major roads, travel modes, community location, inclusivity, safety, and affordability as strong indicators to enhance travel experiences. Across all activity types, the potential travel time underestimates the perceived travel time by 133% in Kumasi-Ghana, and 50% in Dar es Salaam-Tanzania. The overall access to socioeconomic activities based on travel distance and times was found to be relatively more favorable in Kumasi-Ghana than those in Dar es Salaam-Tanzania.
1. Introduction
Transport access has been widely recognized as a key enabler of the social and economic welfare of populations. Access to input materials and markets is important for businesses (Quang et al., Citation2013), while the accessibility of individuals to work, health, education, social networks, leisure and other services is vital to assessing the welfare of populations (Falavigna & Hernandez, Citation2016; Gutiérrez, Citation2009; Hernandez, Citation2018; Oviedo Hernandez & Titheridge, Citation2016; Zhang & Thill, Citation2016). Access to socioeconomic opportunities has been linked to social exclusion with related implications on well-being and quality of life (Bocarejo S & Oviedo H, Citation2012; Geurs & Ritsema van Eck, Citation2001; Lättman et al., Citation2018; Parkhurst & Meek, Citation2014; Preston & Rajé, Citation2007; Pyrialakou et al., Citation2016). Addressing access to opportunities is a critical component of the Sustainable Development Goals (SDGs), particularly Goal 11 – ‘Make cities and human settlements inclusive, safe, resilient and sustainable’, and Target 11.2 – ‘By 2030, provide access to safe, affordable, accessible and sustainable transport systems for all, improving road safety, notably by expanding public transport, with special attention to the needs of those in vulnerable situations, women, children, persons with disabilities and older persons (United Nations, 2015)’. That is, improving access will facilitate access to safe, affordable, accessible and sustainable transport systems for all.
Access to socioeconomic opportunities in Sub-Sahara African (SSA) cities is often achieved through shared mobility, usually in the form of paratransit minibuses, powered two-wheelers, and motorized tricycle. While access is a widespread challenge in SSA cities, the problem is more heightened in Informal Urban Communities (IUCs) and for socially differentiated groups such as caregivers, women, children, people with disabilities, and older persons (Lucas, Citation2022; Lucas et al., Citation2019; Porter et al., Citation2020). IUCs constitute a significant portion of most SSA cities, yet they are not often the focus of major planning and investment opportunities. According to the UN-Habitat (Citation2014), SSA has one of the highest proportions of about 72% of urban population living in IUCs. IUCs are typically associated with lower-quality or informal housing, overcrowded areas lacking safe water, sanitation, and tenure security (Fuentes & Pirzkall, Citation2020; Mwamba & Peng, Citation2020; Roy & Roy, Citation2010; Stacey & Lund, Citation2016; UN-Habitat & IHS-Erasmus University Rotterdam, Citation2018). Also, IUCs are often characterized by low-income populations, low car ownership, and poor mobility infrastructure (e.g. road network). This implies that to satisfy their mobility needs, the majority of IUC dwellers rely on public and shared transport in the form of paratransit minibus (e.g. Trotro in Ghana and Dala dala in Tanzania), motorcycle (e.g. Okada in Ghana and Boda boda in Tanzania), and three-wheeler taxis (e.g. Pragia). Both motorcycle and tricycle taxis have been widely recognized to be crash-prone and associated with injuries, crime, and illegality (Bishop et al., Citation2019; Cassius et al., Citation2021; Evans et al., Citation2018). The pervasive use of motorcycle and tricycle taxis has been facilitated by their low cost and have been popular among the low-income populations (Bishop et al., Citation2019; Cassius et al., Citation2021).
However, the underlying need for the use of motorcycle and tricycle taxis has been to achieve access to social (e.g. healthcare), economic (e.g. workplace) and cultural (e.g. place of worship) opportunities. The widespread use of motorcycle and tricycle taxis is in itself an indicator of mobility related social exclusion and unequal access to opportunities. Aside from bicycles which have shorter travel range and carrying capacity, motorcycle and tricycle taxis are among the existing mobility options that are cheaper to afford due to income constraints. That is, the access to opportunities offered by motorcycle and tricycle taxis is tightly linked to livelihood and welfare of communities. In most SSA cities, this access to opportunities is unequally distributed with high levels of disparity mostly embedded within IUCs. Unequal access has implications on the extent to which local residents can reach work, healthcare, education and other essential socioeconomic activities for deprived communities. But for socially differentiated groups such as caregivers, women, children, young people, older persons, people with disabilities and unemployed, their access can be heightened and severely impacted. That is, by interrogating how different population groups perceive their access to opportunities, these can be incorporated into policy measures to enhance the welfare of residents in IUCs.
Accordingly, this study examines IUCs residents’ perception of ease of access to workplace in relation to factors including demographics, neighborhood characteristics, transport services characteristics, and travel characteristics. This is achieved by applying a multinomial logistic regression model to identify the factors that can enhance the travel experiences of residents in selected IUCs in Kumasi-Ghana and Dar es Salaam-Tanzania. This was further underpinned by evaluating the potential and perceived access in terms of travel distance and travel time to six selected activity types: workplace, healthcare, education (or school), shopping (marketplace), place of worship, and family/friends visit. It is widely recognized that access to opportunities may be potential (or nominal) when a population demand exists in space and time for available service destination(s) and considered realized (or effective) when all barriers have been overcome to receive or actualize the service (Guagliardo, Citation2004; Lättman et al., Citation2018). The differences between potential and perceived access to opportunities and their relations to the performance of mobility infrastructure have been widely recognized (Campbell et al., Citation2019; Fried et al., Citation2020; Lättman, Olsson, et al., Citation2016). However, for IUCs in SSA cities it is not known the extent of the disparities between potential and perceived access, and the factors that underlie or influence these differences in travel experiences.
In addition, the comparative nature of this study is unique in using selected IUCs in Kumasi-Ghana and Dar es Salaam-Tanzania. It is widely recognized that SSA cities face similar challenges in relation to their mobility and access to opportunities (Behrens et al., Citation2016; Klopp, Citation2021). However, mobility and access are always context specific requiring the need to interrogate the local underlying drivers that underpin the transport system. The selected cities, Kumasi-Ghana and Dar es Salaam-Tanzania present compelling differences and commonalities which imply that interesting findings are likely through a comparative analysis. Kumasi, the second largest city of Ghana has an estimated population density of 4132 persons per square kilometre, where about 45% of the population live in informal settlements. It may be described as the quintessential rapidly urbanizing African city, being surrounded by sprawling peri-urban development. In Kumasi, the paratransit minibus dominates the transport modal share with about 62% share of transport mode, while buses represent as low as 9.9% of the mode share. Dar es Salaam is currently Africa’s fifth most populous city with a population density of 4,300 people per square kilometre, where about 70% of the population live in informal settlements. Informal minibuses dominate the transport mode share in Dar es Salaam, where commuters travel as far as 30 km on the arterial roads, which connect the central business district and the residential areas at the fringes (Andreasen & Møller-Jensen, Citation2017; Kiunsi, Citation2013; Nkurunziza et al., Citation2012; Olvera et al., Citation2003). The high population density in both cities portends significant ramifications for urban transport accessibility, as evident through increased pressure on transport services and infrastructure (low speeds, high travel time, long queues, etc.), as well as elevated usage of motorcycle and tricycle taxis.
2. Material and methods
2.1. Study area
The study was carried out in selected IUCs in Kumasi-Ghana, and Dar es Salaam-Tanzania that are presented in respectively. In Kumasi-Ghana, the selected study communities are Sawaba, Aboabo, Asawase, Anloga, and TUC-Dakodwon. The communities Sawaba, Aboabo and Asawase are in Asokore Mampong municipal where they all share boundaries with Aboabo in the middle. These three communities are associated with high usage of motorized three-wheeler taxis; limited paratransit usage; deteriorated access roads with narrow width and un-tarred roadways; encroachment on the right of way of roads by parked trucks and uncontrolled development; high migrant populations usually from northern area of Ghana where motorized two- and three-wheelers are predominant; high road traffic congestion leading to long queues; lower-quality housing, overcrowded areas; low car ownership. The community in Anloga is located in Oforikrom municipal where it is associated with high usage of Trotro (minibus); a paratransit terminal; a market; deteriorated access roads with very narrow widths; encroachment on the right of way of roads; high migrant populations; high-dense settlements; high road traffic congestion; lower-quality housing and low car ownership. The community is bounded in the west by the western by-pass from Anloga Junction to Asokwa, which blocks a direct access to the community. TUC-Dakodwon is a tiny IUC located in the Kumasi Metropolis where it is associated with a taxi terminal, no through access, high proportion of migrant population; high-dense settlements; lower-quality housing and low car ownership. Overall, all the study communities in Kumasi-Ghana have contiguous road connections with limited access at some locations. Most of the road networks are inaccessible by automobile or are much deteriorated such that only operators of two and three wheelers ply them.
Figure 1. Study area in Kumasi-Ghana showing the study communities and administrative units.
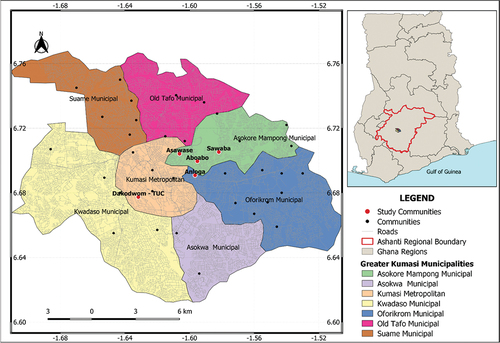
Figure 2. Study area in Dar es Salaam-Tanzania showing study communities and administrative units.
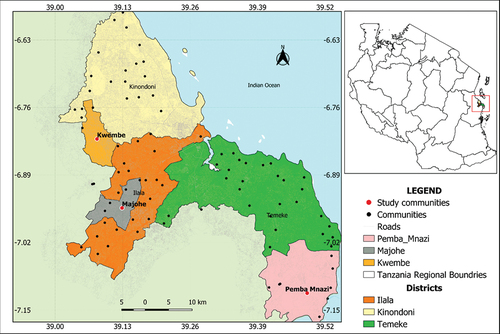
In Dar es Salaam-Tanzania, the study communities are Majohe in Ilala District, Kwembe in Ubungo District and Pemba Mnazi in Kigamboni District. Majohe ward has a population density of 2250 persons per square kilometer, is associated with high usage of motorized three-wheelers, motorcycles and worn-out paratransit minibuses that operate with low reliability and crossed by a commuter rail network which offers services early morning and evening peak-hours only. Kwembe ward has a population density of 1504 persons per square kilometer is characterized by steep slopes terrain and shrubs separating streets. Among several human activities, pastoralist activities are very common in Kwembe ward. Motorized tricycles (commonly known as Bajaj) and powered-two wheelers (i.e. Bodaboda) are the only means of transport that connect Kwembe ward with other destinations and major routes with paratransit minibuses. Pemba Mnazi ward has a population density of 73 persons per square kilometer where it is at the shore of the Indian Ocean and is characterized by communities that predominantly engage in fisheries, pastoral and farming activities. Paratransit minibus routes are accessible only in the peripheral parts of the ward. Commuters on the inside parts of the ward only use Bodaboda and informal taxis to get around. The ward contains poor roads, swamp areas and people living in lower-quality housing.
2.2. Study approach and data sources
A questionnaire survey was carried out to collect travel time and related information to accessing the six selected activity types: workplace, healthcare, education (or school), shopping (marketplace), place of worship, and family/friends visit. These activities were selected because they are among the most widely used essential daily activities carried out by the majority of the population globally (Gaglione et al., Citation2022; Moreno et al., Citation2021). The data collection instrument was based on a semi-structured questionnaire guide having close- and open-ended questions which were designed to facilitate the consultation process. The data collection instrument focused on the following themes: background demographics, neighborhood characteristics, transport services characteristics and travel characteristics to reaching the six selected activity types.
The background demographics variables included sex, household size, age, education, employment type, income type, and net monthly income. The variables for neighborhood characteristics included level of community planning, condition of roads, level of proximity of buildings, and the level of access to major roads. The variables for transport characteristics included regular travel mode, level of traffic, rational for choice of travel mode, whether travel is stressful, reason for stressful travel, whether travel mode choice affects travel, whether community affects travel, whether travel affects income, whether travel affects health, whether travel affects safety, and travel affordability. The other variables for travel characteristics relate specifically to travel to workplace that included travel mode, travel time, travel cost, travel frequency, and perceived ease of access to workplace.
The statistically estimated sample sizes based on population data are 400 for Kumasi-Ghana and 790 for Dar es Salaam-Tanzania. The actual resulting completed responses in Kumasi-Ghana was 600 and 1189 in the case of Dar es Salaam-Tanzania. In both cities, the sample sizes were disaggregated based on proportion of the population in each study community. The questionnaire was pre-tested in-person in the study communities before formally administering them to participants. A paper-based approach and electronic-based system based on KoboToolbox were used to collect participant responses due to security concerns in some cases. All residents who were 18 years and above were eligible to participate in the field survey. Both weekdays and weekends were used to particularly include workers who are only available at home on the weekends. In Kumasi-Ghana, the field survey was carried out from June – July 2022, whereas in Dar es Salaam-Tanzania it was carried out from July – August 2022. The survey questions were administered in-person in the identified study communities in Kumasi-Ghana and Dar es Salaam-Tanzania. Institutional Review Board, the HuSSREC, Humanities and Social Sciences Research Ethics Committee approved the study protocol (Ref: HuSSREC/AP/18/VOL. 1). The resulting data were compiled electronically, coded, and analyzed using descriptive statistics and multinomial logistic regression to summarize the findings. In addition, selected secondary data on mobility and travel characteristics, and the built environment were gathered to complement the primary data. Both data sets were integrated and analyzed to estimate the indicators of objective and perceived access. The estimated access indicators were in turn correlated and examined against sociodemographic variables and neighborhood characteristics to establish their relationships.
2.2.1. Estimation of perceived travel time – user-reported travel time
The perceived travel time to activities was directly obtained from the questionnaire data. It was based on the travel time reported by respondents in accessing any of the six selected activities. The user-reported travel time was estimated as the total time spent from leaving home or origin to the final destination (e.g. workplace). In the case of public transport, this time includes travel time to access the transport station/stop, wait time, and exit time to access the final destination. Where multiple modes of transport were used, and these are recorded as part of a single trip. The travel time to access any of the selected six activities was categorized into five (5) classes: ≤5 mins; 6–15 mins; 16–30 mins; 31-60 mins; >60 mins, corresponding to travel time codes 1, 2, 3, 4 and 5, respectively. The travel time codes were summarized statistically to describe the findings.
2.2.2. Estimation of objective travel distance and time
For each origin and destination compiled, its general travel distance and time were estimated using Openrouteservice (ORS). The travel distance and time were based on the distance or time spent traveling on the road network from the origin location to the destination using a car under typical traffic conditions or walking for cases which apply. The estimated travel time is an approximation of in-vehicle time because vehicle stopping time for passengers to board (or embark), and alight from the vehicle at stops along the routes were not accounted for or included. Also, access time, waiting time and egress time were not included. The coordinate values for origin and destination pairs were supplied as input into Openrouteservice (ORS) [https://openrouteservice.org/] to estimate the travel distance and time along the route. ORS is a free web service that uses publicly available geographic data from OpenStreetMap to provide travel directions, travel distance, travel time, and travel-related information. The estimated travel times were obtained in minutes for each route, whereas the travel distances were obtained in kilometers.
3. Results and discussion
3.1. Summary statistics of primary data
As noted, the survey data focused on respondents’ background demographics, neighborhood characteristics, transport services characteristics, and travel characteristics. The specific variables under each of these categories are presented in , showing the percentage count of responses in Kumasi-Ghana and Dar es Salaam-Tanzania. The findings from these variables are compared for the two cities in the following sections.
Table 1. Summary of variables that were used to describe respondents’ background demographics, neighborhood characteristics, transport services characteristics, and travel characteristics in Kumasi-Ghana and Dar es Salaam-Tanzania.
3.1.1. Background demographics
As presented, there were more female respondents than males in Kumasi-Ghana whereas the opposite is true in the case of Dar es Salaam-Tanzania. According to the 2021 Ghana Statistical Services Population and Housing Census, the Kumasi city-wide area has 48.1% males and 51.9% females. Whereas information based on the 2022 Population and Housing Census for Tanzania Mainland, Kinondoni municipality has 48.3% males and 51.7% females. That is, the male-female ratio of respondents in the IUCs matches quite well in Kumasi-Ghana, while there are slight variations in the case of Dar es Salaam-Tanzania. In both cities, the predominant household size is 4–7 members where in general there are relatively larger household sizes in Kumasi-Ghana. The respondents were relatively younger in Kumasi-Ghana where the largest age group was 18–24 years compared to Dar es Salaam-Tanzania which has 25–35 years as the largest age group. Both cities have similar levels of education with the largest proportion of 42% corresponding to primary/junior high school level in Dar es Salaam-Tanzania, and 35% corresponding to senior high school level in Kumasi-Ghana. Information on employment status showed distinct differences between the two cities with relatively higher employment in Kumasi-Ghana compared to those in Dar es Salaam-Tanzania. However, income types looked more stable in Dar es Salaam-Tanzania where about 22% earned regular income in comparison to those in Kumasi-Ghana where 39% earned seasonal or irregular income. Information on the net monthly income shows that income distribution in Kumasi-Ghana is relatively symmetrical about the mean, whereas the distribution in the case of Dar es Salaam-Tanzania is skewed towards the lowest income group.
3.1.2. Neighborhood characteristics
In terms of community planning, respondents perceived their communities to be relatively planned in Kumasi-Ghana with about 28% and 52% corresponding to well-planned and poorly planned, respectively, in comparison to Dar es Salaam-Tanzania where about 10% and 55% correspond to well-planned and unplanned, respectively. Also, road conditions where perceived to be relatively of better in Kumasi-Ghana than those in Dar es Salaam-Tanzania. The proximity of buildings is perceived to be relatively higher in Kumasi-Ghana than Dar es Salaam-Tanzania. There is relatively shorter walking time to access to major roads in Kumasi-Ghana with about 64% corresponding to less than 5 minutes of travel time in comparison to 54% corresponding to 6–15 minutes travel time in the case of Dar es Salaam-Tanzania.
3.1.3. Transport services characteristics
The mix of regular travel modes in both cities is similar for minibus and walking but with distinct differences for taxis, private car, motorcycle, tricycle and bicycle. For example, there is higher motorcycle usage in Dar es Salaam-Tanzania, whereas there is higher tricycle usage in Kumasi-Ghana. The level of traffic is perceived to be considerably lower in Dar es Salaam-Tanzania than in Kumasi-Ghana. The rationale for the choice of travel mode is quite noteworthy with the largest group of 41% considering safety as a priority in Kumasi-Ghana, whereas about 49% considered cost in the case of Dar es Salaam-Tanzania. Generally, more respondents about 48% considered their regular travels to be stressful in Dar es Salaam-Tanzania than in Kumasi-Ghana where about 42% do not consider it to be stressful. The reasons chosen for stressful travel were similar in both cities where the leading factors include not reliable, not available when needed, not easily accessible and too expensive.
Considerable proportion of respondents indicated that their choice of travel mode affects their travel with a relatively higher percentage in Dar es Salaam-Tanzania than in Kumasi-Ghana. A higher percentage of about 51% in Kumasi-Ghana perceived that their travel is inclusive to accommodate the needs of children, older persons and persons with disabilities than in Dar es Salaam-Tanzania where 54% indicated not inclusive. Respondents in both cities indicated that their travels affect their income with a relatively higher percentage of about 67% in Dar es Salaam-Tanzania than 60% in the case of Kumasi-Ghana. Also, respondents in both cities indicated that their travels affect their health with a relatively higher percentage of about 52% in Dar es Salaam-Tanzania than Kumasi-Ghana with about 39%. Relatedly, a higher percentage of about 56% in Dar es Salaam-Tanzania indicated that their travels affect their safety than in Kumasi-Ghana with about 45%. In terms of travel affordability, both cities have similar values where the largest percentage of about 45% indicated neutral in Dar es Salaam-Tanzania, and about 43% indicated not affordable in Kumasi-Ghana.
3.1.4. Travel characteristics to workplace
Specifically for travel to workplace, the modes used by respondents in both cities are similar, while also different for some modes. Dar es Salaam-Tanzania has more varied modes in comparison to Kumasi-Ghana. Walking is the most popular mode in both cities while minibus has similar proportions in both cities. As was in the case of regular travel, Dar es Salaam-Tanzania has higher proportion of motorcycle usage, while Kumasi-Ghana has higher proportion of tricycle usage. Relatedly, usage of private cars and bicycle are relatively higher in Dar es Salaam-Tanzania while Kumasi-Ghana has a higher usage of taxis. Respondents in Dar es Salaam-Tanzania consistently spent longer travel times to work in comparison to those in Kumasi-Ghana. In Kumasi-Ghana, the largest proportion of about 45% spent about 5 minutes whereas about 34% being the largest proportion in Dar es Salaam-Tanzania spent 6–15 minutes. By cost of travel to workplace, respondents in both cities spent no money with about 62% in the case of Kumasi-Ghana and about 43% in the case of Dar es Salaam-Tanzania. Based on the distribution of travel costs, the dispersion is skewed towards lower costs in Dar es Salaam-Tanzania while in Kumasi-Ghana it is near-symmetrical around the average travel cost. In both cities, the frequencies of travel to workplace are similar where their largest proportions are about 87% and 38% in Kumasi-Ghana and Dar es Salaam-Tanzania, respectively. Finally, the distributions of the perceived ease of access to workplace in both cities are insightful. In Kumasi-Ghana, the distribution is strongly skewed towards strongly agree, whereas it is symmetrical around neutral in the case of Dar es Salaam-Tanzania.
3.2. Statistical analysis – multinomial logistic regression
Different studies have used Multinomial Logistic Regression (MNLR) to examine the relationships between a response variable and a set of independent variables. MNLR addresses classification problems where the outcome variable being predicted is nominal and has more than two categories that do not have a given rank or order. That is, as an extension of logistic regression, MNLR handles multiple outcome categories, making it suitable for problems with more than two distinct outcomes. It has the capability to predict the probabilities of the different possible outcomes of a given set of independent variables that are categorical or continuous. This study considered the respondents’ perceived ease of access to workplace as ordered, increasing from strongly disagree to strongly agree. The MNLR was used to estimate the factors contributing to the increasing or decreasing order of the response variable (i.e. perceived ease of access).
The reference level for perceived ease of access was set to 1 = strongly disagree. The predictor or independent variables are based on the key sub-categories: (a) background demographics (Age, Education, and Monthly income); (b) travel characteristics to workplace (Travel mode, Travel time, Travel cost and Travel frequency); (c) neighborhood characteristics (Community planning, Road condition, and Access to major road); (d) transport services characteristics (Rationale for mode choice, Is travel stressful?, Mode choice affects travel, Community affects travel, Travel is inclusive, Travel affects income, Travel affects health, Travel affects safety and Travel affordability). The MNLR analysis was carried out separately each for Kumasi-Ghana data and Dar es Salaam-Tanzania data.
The resulting MNLR model fit for both cities are presented in , together with the model coefficients in for Kumasi-Ghana, and for Dar es Salaam-Tanzania. The model fit results for Kumasi-Ghana shows that the likelihood ratio chi-square of 324 with a p-value <0.001 indicating that the model fits significantly better than no predictor model. The R2 McF is 0.364, indicating that the model accounts for 36.4% of the total deviance in the response variable that the model explains. In the case of model fit for Dar es Salaam-Tanzania, likelihood ratio chi-square is 363 with a p-value <0.001 indicating that the model fits significantly better than no predictor model. The R2 McF is 0.267, indicating that the model accounts for 26.7% of the total deviance in the response variable that the model explains.
Table 2. Model fit measures for the multinomial logistic regression output for Kumasi-Ghana, and Dar es Salaam-Tanzania data sets.
Table 3. Model coefficients for the multinomial logistic regression output [SE denotes the standard error] for Kumasi-Ghana data.
Table 4. Model coefficients for the multinomial logistic regression output [SE denotes the standard error] for Dar es Salaam-Tanzania data.
The coefficients in the model indicate the logarithm of the probability of respondent’s perceived ease of travel to the reference level (strongly disagree) for various other levels. Positive coefficients indicate that the event is more likely at that level of the predictor than at the reference level of the factor. Negative coefficients indicate that the event is less likely at that level of the predictor than at the reference level. The p-value determines whether the association between the response and each predictor term in the model is statistically significant. The null hypothesis is that the predictor coefficient is equal to zero implying that there is no association between the predictor and the response. Using a significance level of 0.05, a number of predictor variables can be identified to have a considerable association with the response.
In the case of the Kumasi-Ghana with model coefficients presented in , the findings are summarized in the following. Focusing on the cases relating to Agree – Strongly disagree and Strongly agree – Strongly disagree; they represent user perceptions that are far from each other. That is, strongly agree is the farthest opposite to strongly disagree which is the reference, followed by agree. Using the 5-point Likert scale, the selected preferences represent the most distinct differences possible. Accordingly, our analysis aims to determine whether the preference differences are statistically significant and for which predictor variables. When considering Agree – Strongly disagree, the predictors: Travel time – workplace, Access to major road, Travel affects health, Travel affects safety, Travel affordability have considerable influence/association with p-value of 0.036, 0.049, 0.011 and 0.017, respectively. In the case of Strongly agree – Strongly disagree, the following variables have considerable influence including Travel time – workplace (p-value = 0.002), Travel affects health (p-value = 0.019), and Travel affects safety (p-value = 0.048). That is, when evaluating the perceived ease of access to workplace in Kumasi-Ghana, the above predictor variables identified are crucial to boost the travel experience of respondents.
Similarly, in the case of Dar es Salaam-Tanzania with model coefficients presented in , the following are notable observations. For the case of Agree – Strongly disagree, several variables were found to have considerable influence including Education (p-value = 0.004), Monthly income (p-value = 0.024), Travel time – workplace (p-value <0.001), Access to major road (p-value = 0.038), Mode choice affects travel (p-value = 0.046), Travel is inclusive (p-value = 0.035), Travel affects safety (p-value = 0.029) and Travel affordability (p-value = 0.029). When considering Strongly agree – Strongly disagree, the predictors with strong association include Age (p-value = 0.041), Education (p-value = 0.047), Travel time – workplace (p-value = 0.052), Road condition (p-value = 0.013), Community affects travel (p-value = 0.039) and Travel is inclusive (p-value = 0.030). Essentially, the above predictor variables identified are crucial to enhancing the perceived ease of access to workplace in Dar es Salaam-Tanzania.
3.3. Access to selected socioeconomic activities in Ghana and Tanzania
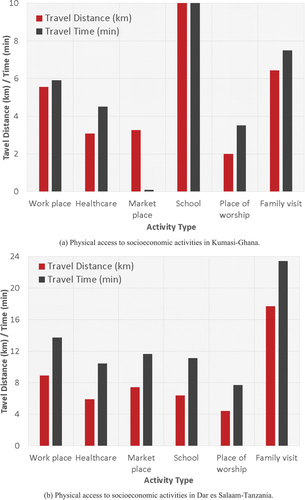
Based on the physical access to the various activity types, the estimated travel distances and times are presented in for Kumasi-Ghana and Dar es Salaam-Tanzania. In Kumasi-Ghana, the increasing order of travel distance is place of worship, healthcare, marketplace, workplace, family visit and school. In terms of travel time, the increasing order is marketplace, place of worship, healthcare, workplace, family visit and school. In either travel distance or time, access to school is the most difficult, followed by family visit and then workplace. Overall, access to place of worship and market are the most favorable in Kumasi-Ghana based on travel distance and time. In the case of Dar es Salaam-Tanzania, the increasing order for both travel distance and time is place of worship, healthcare, school, marketplace, workplace and family visit. That is, travel distances directly translate to similar travel times in the case of access to the selected activity types in Dar es Salaam-Tanzania. It is notable that there are considerable differences in both travel distances and times for both cities, where the values are generally lower (i.e. better access) in the case of Kumasi-Ghana in comparison to Dar es Salaam-Tanzania.
Figure 3. Overall average of objective travel distances and times for the selected activities in the study communities in Kumasi-Ghana and Dar es Salaam-Tanzania.
The estimated objective travel times are further examined in comparison to the perceived (i.e. user-reported) travel time. The two measurements were compared to estimate their differences for the various activity types: workplace, healthcare, marketplace, school, place of worship and family visit. The perceived travel times were coded as follows: 1 for 0–5 minutes; 2 for 6–15 minutes; 3 for 16–30 minutes; 4 for 31–60 minutes; 5 for >> 60 minutes. Accordingly, the objective travel times were converted into travel time codes to match those obtained from the user-reported case. The comparison between the objective and perceived travel times to activities is presented in for Kumasi-Ghana and Dar es Salaam-Tanzania. In the case of Kumasi-Ghana, the median travel time for all the various activity types is the same, which is 1 for 0–5 minutes in the case of objective access. That is, all the activity types can be accessed within 5 minutes of travel time based on the objective travel time estimation. For the perceived travel time, the median travel times change by activity type. Workplace, marketplace, healthcare and place of worship have the same median travel time of 2 for 6–15 minutes, whereas school and family visit have the same median travel time of 3 for 16–30 minutes. The results show that the objective travel time consistently underestimates the perceived travel time across all the activity types.
Figure 4. Comparison between the overall median values for objective and user-reported travel times for the selected activities in the study communities in Kumasi-Ghana and Dar es Salaam-Tanzania.
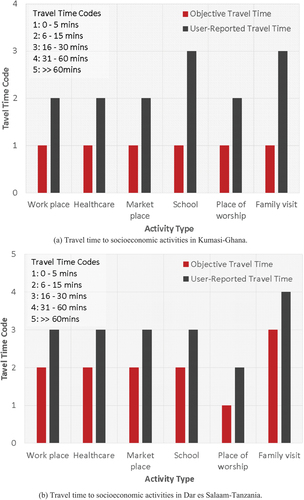
In the case of Dar es Salaam-Tanzania, the median travel time for all the various activity types is not the same but ranges from 1 to 3 (0–30 minutes) in the case of objective travel time. The activity types: workplace, healthcare, market and school have the same median travel time of 6–15 minutes, whereas place of worship is 0–5 minutes and family visit is 16–30 minutes. For perceived travel time, the median travel time also changes by activity type. Workplace, marketplace, healthcare and school have the same median travel time of 16–30 minutes, and place of worship have the median travel time of 6–15 minutes, whereas family visits have the largest median travel time of 31–60 minutes. Again, the results show that the objective travel time consistently underestimates the perceived travel time across all the activity types.
Consistently, the objective travel time is higher for Dar es Salaam-Tanzania than in Kumasi-Ghana across all activities except for access to school. Overall, the difference between the travel distances to activities for Kumasi-Ghana and Dar es Salaam-Tanzania is about 4.6 km. That is, the objective travel distance is about 4.6 km higher in Dar es Salaam-Tanzania than those in Kumasi-Ghana across all the selected activity types. In relation to perceived travel time, the overall median travel time across all activities for Kumasi-Ghana is 6–15 minutes, and for Dar es Salaam-Tanzania is 16–30 minutes. In both objective and perceived cases, the travel times are consistently higher in Dar es Salaam-Tanzania in comparison to Kumasi-Ghana. Accordingly, the overall travel performance is relatively favorable in Kumasi-Ghana than in Dar es Salaam-Tanzania on the basis of objective and perceived distances and times.
3.4. Summary of findings and implications
The study communities were characterized on the basis of background demographics, neighborhood characteristics, transport services characteristics and travel characteristics to workplace. The demographic properties for both cities show larger household sizes, younger population, lower education levels, lower and irregular income and high levels of unemployment. On the basis of neighborhood properties, the study communities are poorly planned, characterized by poor road conditions and limited access to major roads. Overall, it is noteworthy that each city is characterized by relatively distinct characteristics on the basis of demographics, neighborhood characteristics, transport services characteristics, and travel characteristics. For example, each city has distinct distribution of transport modes where there is higher usage of motorcycles in Dar es Salaam-Tanzania and higher usage of tricycles in Kumasi-Ghana. In the case of rationale for the choice of travel mode, safety was the highest priority in Kumasi-Ghana whereas travel cost was the utmost importance in Dar es Salaam-Tanzania. However, commonalities were identified for both cities, such as walking being the most dominant mode, comparable usage of minibus and proportionate perception of travel impact on income, health and safety. This is consistent with findings showing that walking and cycling are the predominant modes in Africa, where 78% of people walk for transport in Africa every day (Lucas et al., Citation2019; Walker et al., Citation2022).
Relatedly, the MNLR analysis provided further insight into the perceived ease of access to workplace in context with predictor variables on background demographics, neighborhood characteristics, transport services characteristics and travel characteristics to workplace. The findings in the case of Kumasi-Ghana showed that perceived ease of access to workplace is influenced by factors including Travel time to workplace, Access to major road, Travel affects health, Travel affects safety and Travel affordability. However, the perceived ease of access to workplace in Dar es Salaam-Tanzania was found to be predicated on several factors including Age, Education, Monthly income, Travel time to workplace, Road condition, Access to major road, Mode choice affects travel, Community affects travel, Travel is inclusive, Travel affects safety, and Travel affordability. Similar findings were obtained by Okafor et al. (Citation2023) showing that safety perception of users accessibility to socioeconomic activities is influenced by socio-demographic and neighborhood characteristics in Accra-Ghana.
The findings relating to travel distances and travel times to accessing the six selected socioeconomic activities are insightful for both cities. Overall, access to the six selected socioeconomic activities is relatively favorable based on travel distances and times in the case of Kumasi-Ghana compared to Dar es Salaam-Tanzania. Excess commuter travel time for Dar es Salaam-Tanzania has been reported in Bwire and Zengo (Citation2020) showing an average commuting distance of about 14.18 km for public transport. Relatedly, the dominance of minibus usage by commuters, and long travel durations from the outskirts to central Dar es Salaam have been observed in various studies (Andreasen & Møller-Jensen, Citation2017; Kiunsi, Citation2013; Nkurunziza et al., Citation2012; Olvera et al., Citation2003). It is notable that access to school, which is an activity largely carried out by young people, is considerably poor in comparison to all other activities in Kumasi-Ghana. A key commonality for both cities is access to places of worship that have been found to be the most accessible. This finding has implications where places of worship can be put to multiple use cases for community activities. That is, if places of worship are highly accessible in IUCs then they hold a prospect in ‘chrono-urbanism’, which envisions multiple uses or functions for a place with the capability to offer flexibility based on the time of day (DiMarino et al., Citation2023; Mouratidis, Citation2018; Patricios, Citation2002).
These findings were further underpinned by user-reported travel times to the six selected socioeconomic activities in both cities. The comparisons between the user-reported and objective travel times showed that access is still much faster in Kumasi-Ghana in comparison to Dar es Salaam-Tanzania. However, for both cities the objective travel times are consistently lower than the user-reported travel times across all the six selected socioeconomic activities. In Kumasi-Ghana, the overall underestimation of the user-reported travel time by the objective travel is 133% across all six socioeconomic activities, whereas in Dar es Salaam-Tanzania the estimated value is 50%. That is, there is a relatively higher agreement between the objective and user-reported travel times in Dar es Salaam-Tanzania than in the case of Kumasi-Ghana. The user-reported travel as an indicator of users’ experience of mobility infrastructure, and its level of disparity from the objective travel time are crucial. These disparities are surrogate indication of the performance of mobility infrastructure used to accessing socioeconomic activities. That is, the objective travel time which relates to the designed performance of mobility infrastructure needs users’ perception and experience of the facility in providing the overall evaluation.
Thus, an integration of the objective and perceived travel times is crucial to provide a comprehensive understanding of the performance of mobility infrastructure used in accessing socioeconomic activities. This is in agreement with findings that emphasize the merging of potential and realized access times (Dumedah et al., Citation2023; Klopp, Citation2021; Lättman et al., Citation2018). Also, it is reasonably assumed that the objective travel time will under-estimate the user-reported travel time (Lättman, Friman, et al., Citation2016; Lättman et al., Citation2018; J. Ryan & Pereira, Citation2021; M. Ryan et al., Citation2016). However, the exact differences between objective and perceived cases have not been comprehensively quantified for a diverse range of activities in IUCs across SSA. Thus, this finding is crucial such that this study has quantified the level of bias to be expected for any objective travel time in Kumasi-Ghana and Dar es Salaam-Tanzania. Practically, the disparities of objective and perceived travel times provide an understanding of the user experience in comparison to the performance of the mobility infrastructure in both cities. As evidence of inquiry, it provides a scaling framework to estimate the user experience based on any objective prediction in Kumasi-Ghana and Dar es Salaam-Tanzania.
4. Conclusions
In summary, this study examined access disparities by determining residents’ potential and perceived access in terms of travel distance and travel time to six selected socioeconomic activities in selected IUCs in Kumasi-Ghana, and Dar es Salaam-Tanzania. Our findings are particularly salient for conceptual development and inform relevant transport policy decisions and appraisal of mobility infrastructure towards enhancing travel experiences to socioeconomic activities for IUC residents. The study findings necessitate adopting appropriate measures to enhance the travel experiences of IUC residents in accessing basic socioeconomic opportunities. For example, 15-Minute City – a concept of an urban setup where residents can access basic services within 15-minutes of active transport from their homes (Moreno et al., Citation2021; Pozoukidou & Chatziyiannaki, Citation2021). The travel distances found for both Kumasi-Ghana and Dar es Salaam-Tanzania are those that can easily be covered by active transport, especially by bicycle. In reference to the factors identified, strategies should target enhancing mobility infrastructure in communities, promote proper community planning, and modify public transport to accommodate the needs of vulnerable groups and persons with different abilities. Also, action is needed to promote travel safety, injury prevention, improve school travel, and revise travel fares to account for equity. Local and national governments in Ghana, Tanzania, and SSA countries with similar challenges should consider these findings towards enhancing the travel experiences of their residents.
There remain additional questions for future investigations. The perceived travel time was based on user-reported cases that can be subjective in some cases. A future study should consider using GPS-assisted travel application for sample individuals to more accurately estimate the actual travel time to accessing services. Additionally, further studies should examine in greater detail the challenges with specific travel modes, opportunities for integrating a variety of transport services and their impact on travel experience of residents. Future studies could benefit from detailed contextual variables, particularly those relating to the transport system and the built environment. It is acknowledged that the size of the study communities and their corresponding sample sizes were relatively different in both cities. Though they are statistically representative, this can influence the comparative results and our interpretation of the findings. The perceived travel time was based on user-reported values which can be affected by the ability of participants to recall their past experiences. Participants’ preference for certain activities such as place of worship and family visit could influence them in providing relatively favorable responses. These have the potential to introduce inconsistency in the reported values across their access to various activities. Nonetheless, the study findings are valuable to enhancing the travel experiences and access to basic socioeconomic opportunities in the selected cities and extendable to SSA cities.
Conflict of interest or financial disclosures
None
Disclosure statement
No potential conflict of interest was reported by the author(s).
Additional information
Funding
References
- Andreasen, M. H., & Møller-Jensen, L. (2017). Access to the city: Mobility patterns, transport and accessibility in peripheral settlements of Dar es Salaam. Journal of Transport Geography, 62, 20–25. https://doi.org/10.1016/j.jtrangeo.2017.05.005
- Behrens, R., McCormick, D., & Mfinanga, D, R. Behrens, D. McCormick, & D. Mfinanga. (Eds.). (2016). Paratransit in African cities: Operations, regulation and reform (1st ed.). Earthscan Routledge.
- Bishop, T., Barber, C., Adu, J., Afukaar, F., Rettie, N., Krasnolucka-Hickman, A., Divall, D., & Porter, G. (2019). Enhancing understanding on safe motorcycle and three-wheeler use for rural transport, Country Report: Ghana. ReCAP for DFID. https://www.gov.uk/research-for-development-outputs/enhancing-understanding-on-safe-motorcycle-and-three-wheeler-use-for-rural-transport-country-report-ghana
- Bocarejo S, J. P., & Oviedo H, D. R. (2012). Transport accessibility and social inequities: A tool for identification of mobility needs and evaluation of transport investments. Journal of Transport Geography, 24, 142–154. https://doi.org/10.1016/j.jtrangeo.2011.12.004
- Bwire, H., & Zengo, E. (2020). Comparison of efficiency between public and private transport modes using excess commuting: An experience in Dar es Salaam. Journal of Transport Geography, 82, 102616. https://doi.org/10.1016/j.jtrangeo.2019.102616
- Campbell, K. B., Rising, J. A., Klopp, J. M., & Mbilo, J. M. (2019). Accessibility across transport modes and residential developments in Nairobi. Journal of Transport Geography, 74, 77–90. https://doi.org/10.1016/j.jtrangeo.2018.08.002
- Cassius, S., El Deeb, N., Sorour, M., & Turner, S. (2021). Future of paratransit and shared mobility: Mapping report. Institute for Transportation & Development Policy. https://www.itdp.org/publication/future-of-paratransit-and-shared-mobility-mapping-report/
- DiMarino, M., Tomaz, E., Henriques, C., & Chavoshi, S. H. (2023). The 15-minute city concept and new working spaces: A planning perspective from Oslo and Lisbon. European Planning Studies, 31(3), 598–620. https://doi.org/10.1080/09654313.2022.2082837
- Dumedah, G., Abass, K., Gyasi, R. M., Forkuor, J. B., & Novignon, J. (2023). Inefficient allocation of paratransit service terminals and routes in Ghana: The role of driver unions and paratransit operators. Journal of Transport Geography, 111, 103643. https://doi.org/10.1016/j.jtrangeo.2023.103643
- Evans, J., O’Brien, J., & Ng, B. C. (2018). Towards a geography of informal transport: Mobility, infrastructure and urban sustainability from the back of a motorbike. Transactions of the Institute of British Geographers, 43(4), 674–688. https://doi.org/10.1111/tran.12239
- Falavigna, C., & Hernandez, D. (2016). Assessing inequalities on public transport affordability in two Latin American cities: Montevideo (Uruguay) and Córdoba (Argentina). Transport Policy, 45, 145–155. https://doi.org/10.1016/j.tranpol.2015.09.011
- Fried, T., Tun, T. H., Klopp, J. M., & Welle, B. (2020). Measuring the sustainable development goal (SDG) transport target and accessibility of Nairobi’s matatus. Transportation Research Record, 2674(5), 196–207. https://doi.org/10.1177/0361198120914620
- Fuentes, N. M., & Pirzkall, H. C. P. (2020). Slum upgrading and placemaking: Improving informal settlements and creating places. Revista Brasileira de Planejamento e Desenvolvimento, 9(2), 285. Article 2. https://doi.org/10.3895/rbpd.v9n2.8906
- Gaglione, F., Gargiulo, C., Zucaro, F., & Cottrill, C. (2022). Urban accessibility in a 15-minute city: A measure in the city of Naples, Italy. Transportation Research Procedia, 60, 378–385. https://doi.org/10.1016/j.trpro.2021.12.049
- Geurs, K. T., & Ritsema van Eck, J. R. (2001). Accessibility measures: Review and applications. Evaluation of accessibility impacts of land-use transportation scenarios, and related social and economic impact. Universiteit Utrecht-URU. https://rivm.openrepository.com/handle/10029/259808
- Guagliardo, M. F. (2004). Spatial accessibility of primary care: Concepts, methods and challenges. International Journal of Health Geographics, 3(1), 3. https://doi.org/10.1186/1476-072X-3-3
- Gutiérrez, J. (2009). Transport and Accessibility. In R. Kitchin & N. Thrift (Eds.), International encyclopedia of human geography (pp. 410–417). Elsevier. https://doi.org/10.1016/B978-008044910-4.01030-0.
- Hernandez, D. (2018). Uneven mobilities, uneven opportunities: Social distribution of public transport accessibility to jobs and education in Montevideo. Journal of Transport Geography, 67, 119–125. https://doi.org/10.1016/j.jtrangeo.2017.08.017
- Kiunsi, R. (2013). A review of traffic congestion in Dar es Salaam City from the physical planning perspective. Journal of Sustainable Development, 6(2). Article 2. https://doi.org/10.5539/jsd.v6n2p94
- Klopp, J. M. (2021). Chapter seven - from “para-transit” to transit? Power, politics and popular transport. In R. H. M. Pereira & G. Boisjoly (Eds.), Advances in transport policy and planning (Vol. 8, pp. 191–209). Academic Press. https://doi.org/10.1016/bs.atpp.2021.07.002
- Lättman, K., Friman, M., & Olsson, L. E. (2016). Perceived accessibility of public transport as a potential indicator of social inclusion. Social Inclusion, 4(3), 36–45. Article 3. https://doi.org/10.17645/si.v4i3.481
- Lättman, K., Olsson, L. E., & Friman, M. (2016). Development and test of the perceived accessibility scale (PAC) in public transport. Journal of Transport Geography, 54, 257–263. https://doi.org/10.1016/j.jtrangeo.2016.06.015
- Lättman, K., Olsson, L. E., & Friman, M. (2018). A new approach to accessibility – Examining perceived accessibility in contrast to objectively measured accessibility in daily travel. Research in Transportation Economics, 69, 501–511. https://doi.org/10.1016/j.retrec.2018.06.002
- Lucas, K. (2022). Transport poverty and social divisions in African Cities: An introduction. In R. A. Acheampong, K. Lucas, M. Poku-Boansi, & C. Uzondu (Eds.), Transport and mobility futures in Urban Africa (pp. 87–94). Springer International Publishing. https://doi.org/10.1007/978-3-031-17327-1_6
- Lucas, K., Jennings, G., Zuidgeest, M., Behrens, R., Venter, C., Mitullah, W., & Thornton, B. (2019). Transport Social Exclusion Five African Cities. Volvo Research and Education Foundation (VREF).
- Moreno, C., Allam, Z., Chabaud, D., Gall, C., & Pratlong, F. (2021). Introducing the “15-minute city”: Sustainability, resilience and place identity in future post-pandemic cities. Smart Cities, 4(1), 93–111. Article 1. https://doi.org/10.3390/smartcities4010006
- Mouratidis, K. (2018). Is compact city livable? The impact of compact versus sprawled neighbourhoods on neighbourhood satisfaction. Urban Studies, 55(11), 2408–2430. https://doi.org/10.1177/0042098017729109
- Mwamba, J. S., & Peng, Z. (2020). Analysis of informal urban settlement upgrading: The Case of Ng’ombe slum upgrading in Zambia. Current Urban Studies, 8(4), 509–532. Article 4. https://doi.org/10.4236/cus.2020.84028
- Nkurunziza, A., Zuidgeest, M., Brussel, M., & Van den Bosch, F. (2012). Spatial variation of transit service quality preferences in Dar-es-Salaam. Journal of Transport Geography, 24, 12–21. https://doi.org/10.1016/j.jtrangeo.2012.06.001
- Okafor, S., Bullard, C., Dumedah, G., Adanu, E. K., Adams, C. A., & Jones, S. (2023). The influence of socio-demographic and neighborhood characteristics on residents’ safety perception of active mobility in Accra, Ghana. Urban, Planning and Transport Research, 11(1), 2276398. https://doi.org/10.1080/21650020.2023.2276398
- Olvera, L. D., Plat, D., & Pochet, P. (2003). Transportation conditions and access to services in a context of urban sprawl and deregulation. The case of Dar es Salaam. Transport Policy, 10(4), 287–298. Article 4. https://doi.org/10.1016/S0967-070X(03)00056-8
- Oviedo Hernandez, D., & Titheridge, H. (2016). Mobilities of the periphery: Informality, access and social exclusion in the urban fringe in Colombia. Journal of Transport Geography, 55, 152–164. https://doi.org/10.1016/j.jtrangeo.2015.12.004
- Parkhurst, G., & Meek, S. (2014). The effectiveness of park-and-ride as a policy measure for more sustainable mobility. In Parking Issues and Policies (Vol. 5, pp. 185–211). Emerald Group Publishing Limited. https://doi.org/10.1108/S2044-994120140000005020
- Patricios, N. N. (2002). Urban design principles of the original neighbourhood concepts. Urban Morphology, 6(1), 21–36. https://doi.org/10.51347/jum.v6i1.3900
- Porter, G., Abane, A., & Lucas, K. (2020). User diversity and mobility practices in Sub-Saharan African Cities: Understanding the needs of vulnerable populations. The state of knowledge and research. (Mobility and Access in African Cities (MAC) Initiative, p. 38). Volvo Research and Educational Foundations (VREF).
- Pozoukidou, G., & Chatziyiannaki, Z. (2021). 15-minute city: Decomposing the new urban planning Eutopia. Sustainability, 13(2), 928. Article 2. https://doi.org/10.3390/su13020928
- Preston, J., & Rajé, F. (2007). Accessibility, mobility and transport-related social exclusion. Journal of Transport Geography, 15(3), 151–160. https://doi.org/10.1016/j.jtrangeo.2006.05.002
- Pyrialakou, V. D., Gkritza, K., & Fricker, J. D. (2016). Accessibility, mobility, and realized travel behavior: Assessing transport disadvantage from a policy perspective. Journal of Transport Geography, 51, 252–269. https://doi.org/10.1016/j.jtrangeo.2016.02.001
- Quang, N. N., Quang, N. Q., Zuidgeest, M. H. P., Bosch, F. H. M., van den Sliuzas, R. V., & Van Maarseveen, M. F. A. M. (2013, September 9–12). Using accessibility indicators to investigate urban growth and motorcycles use in Ha Noi City, Vietnam. Proceedings of the Eastern Asia Society for Transportation Studies: Towards a Harmonized Transportation Society : The 10th EASTS Conference (pp. 9–20. https://research.utwente.nl/en/publications/using-accessibility-indicators-to-investigate-urban-growth-and-mo
- Roy, A., & Roy, M. (2010). Reengineering an urban slum: A case study of Dharavi, India. International Journal of Sustainable Society, 2(4), 420. https://doi.org/10.1504/IJSSOC.2010.036945
- Ryan, J., & Pereira, R. H. M. (2021). What are we missing when we measure accessibility? Comparing calculated and self-reported accounts among older people. Journal of Transport Geography, 93, 103086. https://doi.org/10.1016/j.jtrangeo.2021.103086
- Ryan, M., Lin, T., Xia, J., CECILIA, & Robinson, T. (2016). Comparison of perceived and measured accessibility between different age groups and travel modes at Greenwood Station, Perth, Australia. European Journal of Transport and Infrastructure Research, 16(2), 406–423. https://espace.curtin.edu.au/handle/20.500.11937/39015
- Stacey, P., & Lund, C. (2016). In a state of slum: Governance in an informal urban settlement in Ghana*. The Journal of Modern African Studies, 54(4), 591–615. https://doi.org/10.1017/S0022278X16000586
- UN-Habitat. (2014). The State of African Cities 2014: Re-Imagining sustainable urban transitions. Nairobi: United Nations Human Settlements Program. United Nations (UN).
- UN-Habitat & IHS-Erasmus University Rotterdam. (2018). The State of African Cities 2018—The Geography of African Investment | UN-Habitat [ HS/053/18E]. United Nations Human Settlements Programme (UN-Habitat). https://unhabitat.org/the-state-of-african-cities-2018-the-geography-of-african-investment
- Walker, J., Tuniz, J., Bosch, L., Cigut, T., & United Nations Environment Programme, & United Nations Human Settlements Programme. (2022). Walking and Cycling in Africa: Evidence and Good Practice to Inspire Action. United Nations Environment Programme (UNEP), The United Nations Human Settlements Programme (UN-Habitat) and the Walk21 Foundation. https://wedocs.unep.org/20.500.11822/40071
- Zhang, W., & Thill, J.-C. (2016). Accessibility and Spatial Interaction, edited by Ana Condeço-Melhorado, Aura Reggiani, and Javier Gutiérrez. 2014. NECTAR Series on Transportation and Communications Networks Research. Cheltenham, U.K. and Northampton, Massachusetts: Edward Elgar. 256. ISBN: 9781782540724. $120.00. Journal of Regional Science, 56(1), 178–180. https://doi.org/10.1111/jors.12245