
 ?Mathematical formulae have been encoded as MathML and are displayed in this HTML version using MathJax in order to improve their display. Uncheck the box to turn MathJax off. This feature requires Javascript. Click on a formula to zoom.
Abstract
Objective
To describe the diagnostic and prognostic performance, and longitudinal trajectories, of potential biomarkers of neuroaxonal degeneration and neuroinflammation in amyotrophic lateral sclerosis (ALS).
Methods
This case-control study included 192 incident ALS patients, 42 ALS mimics, 114 neurological controls, and 117 healthy controls from Stockholm, Sweden. Forty-four ALS patients provided repeated measurements. We assessed biomarkers of (Citation1)neuroaxonal degeneration: neurofilament light (NfL) and phosphorylated neurofilament heavy (pNfH) in cerebrospinal fluid (CSF) and NfL in serum, and (Citation2)neuroinflammation: chitotriosidase-1 (CHIT1) and monocyte chemoattractant protein 1 (MCP-1) in CSF. To evaluate diagnostic performance, we calculated the area under the curve (AUC). To estimate prognostic performance, we applied quantile regression and Cox regression. We used linear regression models with robust standard errors to assess temporal changes over time.
Results
Neurofilaments performed better at differentiating ALS patients from mimics (AUC: pNfH 0.92, CSF NfL 0.86, serum NfL 0.91) than neuroinflammatory biomarkers (AUC: CHIT1 0.71, MCP-1 0.56). Combining biomarkers did not improve diagnostic performance. Similarly, neurofilaments performed better than neuroinflammatory biomarkers at predicting functional decline and survival. The stratified analysis revealed differences according to the site of onset: in bulbar patients, neurofilaments and CHIT1 performed worse at predicting survival and correlations were lower between biomarkers. Finally, in bulbar patients, neurofilaments and CHIT1 increased longitudinally but were stable in spinal patients.
Conclusions
Biomarkers of neuroaxonal degeneration displayed better diagnostic and prognostic value compared with neuroinflammatory biomarkers. However, in contrast to spinal patients, in bulbar patients neurofilaments and CHIT1 performed worse at predicting survival and seemed to increase over time.
1. Introduction
In amyotrophic lateral sclerosis (ALS) there are no established biomarkers to definitely diagnose or to reliably predict prognosis (Citation1). However, there are potential candidates including the most widely used neurofilament light chain (NfL) as well as phosphorylated neurofilament heavy chain (pNfH) (Citation2–4). Neurofilaments (NFs) are biomarkers of neuroaxonal degeneration and elevated levels are found in the cerebrospinal fluid (CSF) and blood of ALS patients compared with ALS mimics, patients with other neurological disorders, and healthy individuals (Citation3, Citation5–8). Higher levels of NFs have been linked to faster disease progression and shorter survival in ALS patients (Citation6, Citation9–12). In longitudinal studies, NFs have been reported to be stable over time since ALS diagnosis (Citation13–17). Decreasing NfL levels have, in contrast, been used as an indicator of effect in clinical trials (Citation18, Citation19), and tofersen was recently approved merely based on decreases in NfL (Citation20).
In recent years, evidence of neuroinflammation in ALS has emerged (Citation21, Citation22). Proteomics of CSF have led to the identification of proteins involved in neuroinflammatory processes, with CHIT1, a biomarker of microglia activation, being the most studied (Citation17, Citation23). The chemokine monocyte chemoattractant protein-1 (MCP-1) is another protein related to myeloid activation that is also likely elevated in the CSF of ALS patients (Citation9, Citation16). Few studies have however described CHIT1 and MCP-1 trajectories over time since ALS diagnosis.
Most previous studies on ALS biomarkers have relied on analyses of CSF, but the introduction of more sensitive methods that allow much lower concentrations to be measured in blood, such as single-molecule array (Simoa), now facilitate tracking of dynamic changes over time (Citation24). Still, variable estimates of how well NfL correlates between CSF and blood from ALS patients have been reported (Spearman’s rho: 0.62 to 0.84) (Citation15,Citation25–28).
In this study we aimed to compare the diagnostic and prognostic performance, as well as the longitudinal trajectories, of potential biomarkers reflecting neuroaxonal degeneration (NfL and pNfH) and neuroinflammation (CHIT1 and MCP-1) in both CSF and blood of ALS patients and controls.
2. Materials and methods
2.1. Study design and participants
We conducted a case-control study, and a longitudinal study of ALS patients, in Stockholm, Sweden. Study participants were prospectively recruited between March 2016 and March 2021 at the Karolinska ALS Clinical Research Center (ALS CRC), a tertiary clinic that cares for all ALS patients in Stockholm. Of all 381 individuals diagnosed with motor neuron disease (MND) during this time period, 192 ALS patients consented and were included in the study (Figure S1). Of these, 44 patients provided repeated measurements, and were included in the analysis of longitudinal trajectories of the biomarkers. Survival status was noted from the date of diagnosis until the date of death or invasive ventilation, or until 8 February 2023, whichever came first.
Individuals evaluated at the ALS CRC with suspicion of ALS, but who were diagnosed with other diseases (not MND), were recruited as ALS mimics (n = 42) (). We also included 114 patients with other neurological diseases as neurological controls, grouped as patients with inflammatory diseases (multiple sclerosis [MS], chronic inflammatory demyelinating polyneuropathy [CIDP], or paraproteinemic demyelinating polyneuropathy [PDN]) (INC; n = 80) or non-inflammatory diseases (normal pressure hydrocephalus, headache, spinal stenosis, hypersomnia, etc.) (NINC; n = 34) (Table S1). Siblings and partners of the ALS patients were included as healthy controls (n = 117).
Table 1 List of ALS mimics.
2.2. Clinical data
Functional disability was assessed using the revised ALS Functional Rating Scale (ALSFRS-R). Baseline progression rate was calculated as 48 minus the ALSFRS-R score at diagnosis divided by the number of months from onset to diagnosis. Longitudinal progression rate was calculated as the ALSFRS-R score at diagnosis minus the ALSFRS-R score at last visit divided by number of months between the two measurements (time between diagnosis and last ALSFRS-R score; median: 16.3 months; interquartile range: 8.1–27.0 months). At diagnosis, patients were also evaluated using the revised El Escorial Criteria (Citation29) and classified using King’s clinical staging system (King’s) (Citation30). Signs of frontotemporal degeneration (FTD) at diagnosis were based on a combination of clinical observations by the neurologist and cognitive screening tools (Edinburgh Cognitive and Behavioral ALS Scale and Montreal Cognitive Assessment).
Among the ALS patients, there were no missing data on clinical characteristics including site of onset, ALSFRS-R, progression rate, King’s, revised El Escorial criteria, body mass index (BMI), and signs of FTD at diagnosis. However, there were missing data on C9orf72 status (missing n = 44; 22.9%).
2.3. Sample collection and measurements
Blood and CSF were collected from ALS patients within 90 days after diagnosis. Samples were collected from ALS mimics and some neurological controls (CIDP, PDN and all NINCs) during the diagnostic work-up, and from MS controls at variable times during the disease course. CSF was obtained through lumbar puncture using polypropylene tubes and centrifuged for ten minutes at 400 g at room temperature. Blood was drawn into serum separator tubes and EDTA tubes (for plasma) and centrifuged for ten minutes at 2000 g at room temperature. All samples were aliquoted within two hours, directly frozen and then stored in −80 °C.
The measurements of NFs, CHIT1 and MCP-1 in CSF were based on sandwich enzyme-linked immunoassay (ELISA) techniques. We used commercially available ELISA kits: pNfH from Euroimmun, Lübeck, Germany; NfL from UmanDiagnostics, Sweden; CHIT1 from CircuLex, MBL, Japan; MCP-1 from R&D Systems, Minneapolis, MN, USA. Serum and plasma NfL were measured using a Simoa assay (Quanterix, Billerica, MA). The CSF was diluted 2-10-fold depending on the assay. Twenty-four readings of pNfH (one mimic, 10 INC, nine NINC, and four healthy controls) and 15 readings of CHIT1 (13 ALS patients, one mimic, and one healthy control) were below the detection limits of the assays. These were assigned the value of the lower limit of quantification (pNfH 62.5 ng/L and CHIT1 141 ng/L). Intra- and inter-assay variability was below 10%.
Neurofilaments were measured in all participants. CHIT1 and MCP-1 were measured in all ALS patients, all ALS mimics, and 13 healthy controls. In 83 of 114 neurological controls and nine of 117 healthy controls, plasma was analyzed instead of serum. To enable comparisons between plasma and serum measurements, a separate cohort of 126 controls was used as reference to compare serum and plasma concentrations of NfL, concluding that serum concentration was 11% higher than the corresponding value in plasma (Figure S2). Therefore, serum NfL for these neurological and healthy controls was estimated by calculating the plasma NfL concentrations times 1.11.
2.4. Statistical analysis
Pearson’s -test was used to determine differences in proportions of categorical variables between groups. Due to non-normality of the continuous variables, Mann-Whitney U test was applied to test differences between groups whereas Spearman’s rank correlation (rho) was used to calculate correlations between continuous variables. Diagnostic performance of the biomarkers was evaluated with Area Under the Curve (AUC) and Receiver Operating Characteristics (ROC) curves, with adjustment for age at measurement. To compare the AUCs, tests for equality between AUCs were performed (Citation31). Youden index was used to derive the optimal cutoff for each biomarker from the ROC curves, giving equal weight to sensitivity and specificity (Citation32). Because data were non-normally distributed, quantile regression was applied to make inferences on the median longitudinal progression rates, instead of the more common linear model. Cox proportional hazard regression was used to analyze the risk of death in relation to biomarker levels, with time since measurement as underlying time scale. The proportional hazards assumption was met for all Cox models. For both quantile regression and Cox model, biomarker concentrations were divided into tertiles, and adjustments were made for sex, age at diagnosis, site of onset, classification according to the revised El Escorial criteria, diagnostic delay, baseline ALSFRS-R, baseline progression rate, BMI, and signs of FTD at diagnosis (Citation33, Citation34). Due to incompleteness in C9orf72 status, it was adjusted for in a separate sensitivity analysis. A genotype of the CHIT1 gene causes lower levels of CHIT1 in CSF and serum (Citation35, Citation36). The prevalence of homozygous carriers of this genotype is estimated at 3–9% in European populations (Citation11, Citation35, Citation37, Citation38), i.e. in the same range as the number of study participants with undetectable CHIT1 concentrations in our study (n = 16; 6.5%). Therefore, CHIT1 values <200 ng/L (n = 13 ALS patients, one mimic, and two healthy controls) were dropped in separate sensitivity analyses. Repeated measurements of the biomarker concentrations were analyzed among 44 ALS patients, using a linear regression model with cluster-robust standard errors. In all analyses, we set statistical significance at 5%. We performed the analyses in Stata software, version 16 (StataCorp, College Station, TX).
2.5. Protocol approvals and registrations
This study was approved by the Swedish Ethical Review Authority (Dnrs 2014/1815-31/4, 2017/1895-31/1, 2009/2107-31/2, 2017/952-31). The study followed the ethical principles of the Declaration of Helsinki.
3. Results
3.1. Participant characteristics
ALS patients differed from ALS mimics with regard to sex (female 44.8% vs. 23.8%; p = 0.01) but not age (median 67.6 years vs. 71.2 years; p = 0.20), and from neurological and healthy controls in age (median 51.0 years and 50.5 years, respectively; p < 0.001 for both) but not sex (53.5% and 39.1%, respectively; p = 0.14 and 0.61, respectively) (). The characteristics of the ALS patients in our study were similar to the characteristics of all ALS patients diagnosed at ALS CRC during the same period (Table S2).
Table 2 Characteristics of study participants and biomarker concentrations at diagnosis (in ng/L).
3.2. Biomarker concentrations and correlations
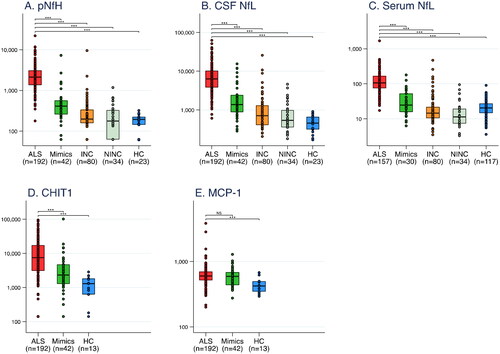
All biomarker concentrations were higher among ALS patients at time of diagnosis compared with all other groups, except for MCP-1 (; ; Table S1). Comparing spinal and bulbar patients, there was no difference in any biomarker at time of diagnosis (p = 0.57, 0.79, 0.19, 0.13, and 0.61 for pNfH, CSF NfL, serum NfL, CHIT1, and MCP-1, respectively).
Figure 1 Box plots for biomarker concentrations in ALS patients, ALS mimics, and different control groups. Note: Biomarker concentrations are shown on a logarithmic scale in ng/L. Differences are calculated using Mann–Whitney U test. *** p < 0.001. NS: Not statistically significant. INC: Inflammatory neurological controls. NINC: Non-inflammatory neurological controls. HC: Healthy controls. pNfH: phosphorylated neurofilament heavy. NfL: neurofilament light. CHIT1: chitotriosidase-1. MCP-1: monocyte chemoattractant protein-1.
Among ALS patients, NfL and pNfH concentrations correlated strongly with each other, whereas inflammatory biomarkers demonstrated weaker correlations with each other and with NFs (; Figure S3). Correlations were generally weaker in bulbar than in spinal patients.
Table 3 Correlation matrix of biomarkers measured in ALS patients at the time of diagnosis.
3.3. Diagnostic performance
AUC was higher for pNfH compared with CSF NfL (p = 0.007) for differentiating ALS patients from ALS mimics (; Figure S4). When assessing study participants who provided both CSF and serum measurements, there was no difference between serum NfL and pNfH (p = 0.81), or between serum NfL and CSF NfL (p = 0.27). AUCs for NFs were higher than for CHIT1 and MCP-1 (p < 0.001 for all comparisons). Combining pNfH, CSF NfL, CHIT1 and MCP-1 did not improve the diagnostic performance compared with pNfH alone (p = 0.53). AUCs comparing bulbar and spinal patients separately were similar for all biomarkers.
Table 4 Area under the curve (AUC) for differentiating ALS patients from ALS mimics, adjusted for age at measurement, together with optimal cutoffs (estimated with Youden index) and their sensitivity and specificity.
3.4. Prognostic performance
Comparing low to high concentrations of NFs, there was an increase in predicted median longitudinal progression rates, and risk of death, in both simple and multivariable models, although the multivariable progression rate model was not significant for pNfH (; Table S3; Kaplan-Meier curves in Figure S5). Serum NfL performed particularly well, both for progression rate and survival. For CHIT1 and MCP-1, there was an increased risk of death by comparing low to medium concentrations. Adding all CSF biomarkers into a multivariable Cox model and using backward elimination, pNfH and CHIT1 emerged as strongest predictors of death (Table S4). Only minor changes were detected in the models additionally adjusted for C9orf72 status (Table S5).
Figure 2 Predicting longitudinal progression rate and survival among ALS patients. (A-B) Quantile regression models predicting median longitudinal progression rate in relation to biomarker levels (medium and high versus low), in simple (A) and multivariable (B) analyses. (C-D) Cox proportional hazards regression models predicting survival with biomarker levels (medium and high versus low), in simple (C) and multivariable (D) analyses. Note: 192 patients with CSF and 157 patients with serum. In multivariable analyses the following variables were adjusted for: sex, age at diagnosis, BMI at diagnosis, site of onset, El Escorial diagnostic criteria, diagnostic delay, baseline ALSFRS-R, baseline progression rate, and sign of FTD at diagnosis. Biomarker concentrations were divided into tertiles, with low/medium/high concentrations. pNfH: phosphorylated neurofilament heavy. NfL: neurofilament light. CHIT1: chitotriosidase-1. MCP-1: monocyte chemoattractant protein-1.
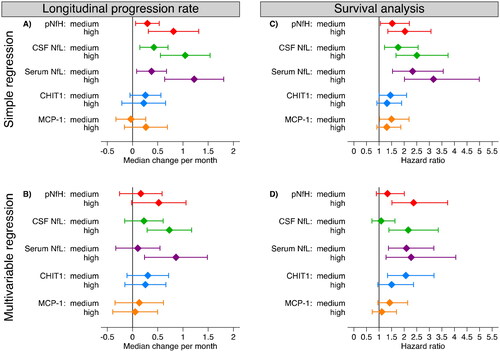
When comparing bulbar and spinal patients, NFs and CHIT1 seemed to predict survival better for spinal patients (Table S6). In spinal patients, serum NfL performed particularly well (hazard ratio [HR] in the multivariable analysis comparing low to medium concentrations 4.39 [95% CI 2.35–8.20], and HR comparing low to high 3.29 [95% CI 1.55–6.97]). The only biomarker with a statistically significant hazard ratio for bulbar patients after multivariable adjustment was pNfH (HR comparing low to high 2.47 [95% CI 1.11–5.35]). The longitudinal progression rate could not be predicted by any biomarker when stratifying the analysis by site of onset.
3.5. Longitudinal analysis
In a longitudinal analysis with a median follow-up of 1.1 year (range: one month to 3.9 years), including ALS patients with at least two measurements, there was no clear temporal change in any biomarker after controlling for age at diagnosis (; ). However, when analyzing bulbar and spinal patients separately, NFs and CHIT1 increased over time in those with bulbar onset. Levels were stable among spinal patients, except for pNfH that decreased over time, but with a low coefficient of determination. There were two patients with follow-up time longer than three years. Restricting the follow-up time to three years did not change the results. In a post-hoc analysis, applying a non-parametric bootstrap quantile regression model on the median change, the results were similar to the above analysis (Table S7).
Figure 3 Temporal patterns per biomarker for each ALS patient from date of first sampling and with mean change (assuming a linear model, from the longitudinal analysis in ), for spinal and bulbar onset patients separately (all measured in ng/L). pNfH: phosphorylated neurofilament heavy. NfL: neurofilament light. CHIT1: chitotriosidase-1. MCP-1: monocyte chemoattractant protein-1.
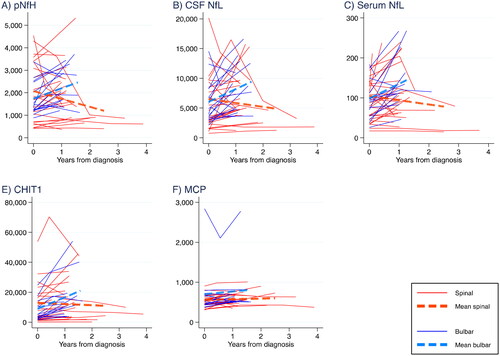
Table 5 Number of samples (a) and temporal changes of biomarker concentrations per year after ALS diagnosis (b), for all patients and for spinal and bulbar onset patients (mean annual change in ng/L per year).
3.6. Sensitivity analysis of CHIT1
In a sensitivity analysis, study participants with very low CHIT1 concentrations (<200 ng/L; n = 16) were removed. This yielded slightly stronger results for CHIT1 in all analyses except for temporal trends (Tables S8-S11).
4. Discussion
In this case-control study including 192 incident ALS cases from a tertiary clinic in Stockholm, Sweden, biomarkers of neuroaxonal degeneration performed better than biomarkers of neuroinflammation as potential diagnostic and prognostic biomarkers, and the performance of serum NfL was comparable to that of CSF NfL. However, there were substantial differences between bulbar and spinal patients.
Diagnostic performance was better for pNfH compared with CSF NfL, as reported by some studies (Citation26, Citation39–41), although others have shown similar performance (Citation6, Citation11, Citation28, Citation42). Importantly, serum NfL and CSF NfL showed comparable performance, as previously reported (Citation25, Citation26, Citation28, Citation42). CHIT1 could also discriminate ALS patients from mimics, but performed less well than NFs and worse than previously reported, even when excluding CHIT1 concentrations <200 ng/L (Citation9, Citation43–45). We failed to show elevated concentrations of MCP-1 in ALS patients compared with mimics, and MCP-1 could not differentiate ALS patients from mimics, contrasting one previous (and smaller) study (Citation9). Combining biomarkers did not improve diagnostic performance, which has also been reported before (Citation44).
We present an optimal cutoff in differentiating ALS patients from ALS mimics for pNfH of 726 ng/L, which is in the upper range of previously reported cutoffs (460-768 ng/L) (Citation6, Citation7, Citation39–41). Our cutoff for CSF NfL of 2,588 ng/L is in concordance with many previous studies (Citation6, Citation25, Citation26, Citation39). For serum NfL, our cutoff was 56.4 ng/L. Earlier studies on NfL in blood found cutoffs between 62 and 97 ng/L in serum (Citation14, Citation42, Citation46), and between 32.7 and 95.4 ng/L in plasma (Citation25, Citation26). Such wide range is possibly dependent on the diagnoses included in the mimics groups.
As previously reported (Citation6, Citation9–12), we found that NFs were good predictors for both progression rate and survival. Serum NfL was found to perform particularly well, consistent with findings of two earlier studies (Citation12, Citation26). CHIT1 and MCP-1 did not reliably predict survival or progression rate. However, when adding all CSF biomarkers in a multivariable Cox model and using backward elimination, pNfH and CHIT1 emerged as the strongest predictors. Also, combining pNfH and CHIT1 provided lower Akaike Information Criterion (AIC) (Citation47) than with pNfH alone, indicating that both biomarkers of neurodegeneration and neuroinflammation carry predictive information. Additionally, when merely analyzing spinal patients CHIT1 performed well in the survival analysis. Previous studies on the predictive value of CHIT1 show inconsistent results, probably due to small sample size, different adjustment for covariables, and inclusion of a low proportion of deceased patients (Citation9, Citation11, Citation12, Citation43–45, Citation48, Citation49).
In the longitudinal analysis of 44 ALS patients, we found no overall temporal change in any biomarker, in line with earlier studiesCitation13–17.
Interestingly, we found substantial differences between bulbar and spinal patients in several of our analyses. Compared with spinal patients, in bulbar patients, 1) NFs and CHIT1 performed worse at predicting survival (with a particular advantage of serum NfL in spinal patients, and of pNfH in bulbar patients), 2) correlations between biomarkers were slightly weaker at the time of diagnosis, and 3) NFs and CHIT1 seemed to increase over time. All biomarkers seemed stable over time since diagnosis in spinal patients, except for pNfH, which showed decreasing concentration over time but with a low R2. This suggests a difference in how these biomarkers are expressed and/or leaked into the CSF and blood depending on site of onset.
The difference in serum NfL and CSF NfL correlation between spinal and bulbar patients could be explained by lower BMI in bulbar patients. Lower BMI is associated with higher serum NfL concentrations (Citation50, Citation51), also in our study (serum NfL and BMI: Spearman’s rho −0.25; p = 0.001; posthoc analysis). Upon generating a NfL/BMI ratio and running Spearman’s rank-order correlation, Spearman’s rho in spinal patients stayed nearly unchanged on 0.82, but increased from 0.65 to 0.77 in bulbar patients, i.e. close to that in spinal patients.
4.1. Strengths and limitations
The strengths of this study are a relatively large sample size with incident ALS cases only, and almost complete data on patient characteristics. Also, there were no differences in clinical characteristics between our patient sample and all incident ALS patients in Stockholm during the same period, indicating good generalizability. Furthermore, the very high number of deceased patients during follow-up strengthens the validity of the survival analysis.
There are several limitations in our study. We did not test for the specific genotype associated with very low CHIT1 levels. However, we explored the potential bias by performing a sensitivity analysis removing all patients with CHIT1 concentrations <200 ng/L. Results were in general more striking after removal of these samples. C9orf72 status is often reported as predictor of ALS survival (Citation9, Citation33, Citation52). We had a high degree of incompleteness in C9orf72 status (22.9%), but in sensitivity analyses further adjusting for C9orf72 status, we did not find evidence of strong confounding effect. For some of our neurological (85% of INCs; 26.9% of NINCs) and healthy (7.8%) controls, NfL was analyzed in plasma instead of serum, although we had serum analyzed for all ALS patients and all ALS mimics. Plasma levels were converted to serum levels using a separate cohort as reference. This could potentially have affected the analyses of INCs and NINCs. Our primary comparison group was ALS mimics. In this group, we included all persons who were were evaluated at the ALS CRC with the suspicion of ALS, but who were diagnosed with other diseases or symptoms unrelated to MND. Therefore, the comparison group contains a wide range of diagnoses, which possibly impedes a comparison to other studies. However, our cutoffs are similar to other studies, indicating that this might not be a large limitation. ALS patients were generally older than the neurological and healthy controls, and because neurofilament concentrations correlate positively with age (although this relationship is possibly not so strong among ALS patients) (Citation2, Citation51, Citation53–55), comparisons with neurological and healthy controls could have been affected. However, ALS patients were similar in age to the ALS mimics, which was the primary comparison group of this study. Patients included in the longitudinal analysis of biomarkers had lower progression rate, lived longer, and displayed lower NF concentrations compared with patients in the entire cohort (Table S12). As a result this analysis does not pertain to all ALS patients. Also, the longitudinal analysis had low sample size, generating wide confidence intervals, but this is to some extent alleviated by the stable results across biomarkers. Finally, due to difficulties in collecting CSF, the number of healthy controls with CSF was very limited.
5. Conclusions
In conclusion, biomarkers of neuroaxonal degeneration outperformed biomarkers of neuroinflammation as potential diagnostic and prognostic biomarkers in ALS. Importantly, the diagnostic performance of serum NfL was comparable to CSF NfL, indicating that serum NfL could be analyzed instead of CSF NfL in the diagnostic work-up of ALS. Also, the differences in NFs in bulbar versus spinal patients suggest that NFs should possibly be approached differently in these groups in clinical practice, research, and clinical trials.
Supplemental Material
Download PDF (1 MB)Acknowledgements
We are immensely thankful to all study participants for their contributions to this study.
Disclosure statement
Ulf Kläppe reports no disclosures.
Stefan Sennfält reports no disclosures.
Anikó Lovik reports no disclosures.
Anja Finn reports no disclosures.
Ulrika Bofaisal reports no disclosures.
Henrik Zetterberg has served at scientific advisory boards and/or as a consultant for Abbvie, Acumen, Alector, Alzinova, ALZPath, Annexon, Apellis, Artery Therapeutics, AZTherapies, CogRx, Denali, Eisai, Nervgen, Novo Nordisk, Optoceutics, Passage Bio, Pinteon Therapeutics, Prothena, Red Abbey Labs, reMYND, Roche, Samumed, Siemens Healthineers, Triplet Therapeutics, and Wave, has given lectures in symposia sponsored by Cellectricon, Fujirebio, Alzecure, Biogen, and Roche, and is a co-founder of Brain Biomarker Solutions in Gothenburg AB (BBS), which is a part of the GU Ventures Incubator Program; all outside the submitted work.
Kaj Blennow has served as a consultant, at advisory boards, or at data monitoring committees for Abcam, Axon, Biogen, JOMDD/Shimadzu. Julius Clinical, Lilly, MagQu, Novartis, Roche Diagnostics, and Siemens Healthineers, and is a co-founder of Brain Biomarker Solutions in Gothenburg AB (BBS), which is a part of the GU Ventures Incubator Program; all outside the submitted work.
Fredrik Piehl reports no disclosures.
Ivan Kmezic reports no disclosures.
Rayomand Press reports no disclosures.
Kristin Samuelsson reports no disclosures.
Fang Fang reports no disclosures.
Caroline Ingre serves as a member of the Publication Steering Committee for Cytokinetics, a board member of the data monitoring committee of APL-ALS 206 for Apellis Pharmaceutical, a board member of the Stiching TRICALS Foundation, and has received grants from Pfizer; all outside the submitted work.
Data availability statement
Anonymized data will be made available upon reasonable requests to the corresponding author. The data are not publicly available due to privacy or ethical restrictions.
Additional information
Funding
References
- van Es MA, Hardiman O, Chio A, Al-Chalabi A, Pasterkamp RJ, Veldink JH, et al. Amyotrophic lateral sclerosis. Lancet. 2017; 390:2084–98. [InsertedFromOnlin
- Gagliardi D, Meneri M, Saccomanno D, Bresolin N, Comi GP, Corti S. Diagnostic and prognostic role of blood and cerebrospinal fluid and blood neurofilaments in amyotrophic lateral sclerosis: a review of the literature. Int J Mol Sci. 2019; 20(17): 4152.
- Forgrave LM, Ma M, Best JR, DeMarco ML. The diagnostic performance of neurofilament light chain in CSF and blood for Alzheimer’s disease, frontotemporal dementia, and amyotrophic lateral sclerosis: a systematic review and meta-analysis. Alzheimers Dement. 2019;11:730–43.
- Meyer T, Salkic E, Grehl T, Weyen U, Kettemann D, Weydt P, et al. Performance of serum neurofilament light chain in a wide spectrum of clinical courses of amyotrophic lateral sclerosis-a cross-sectional multicenter study. Eur J Neurol. 2023;30:1600–10.
- Rosengren LE, Karlsson JE, Karlsson JO, Persson LI, Wikkelsø C. Patients with amyotrophic lateral sclerosis and other neurodegenerative diseases have increased levels of neurofilament protein in CSF. J Neurochem. 1996;67:2013–8.
- Steinacker P, Feneberg E, Weishaupt J, et al. Neurofilaments in the diagnosis of motoneuron diseases: a prospective study on 455 patients. J Neurol Neurosurg Psychiatry 2016;87:12–20.
- De Schaepdryver M, Jeromin A, Gille B, Claeys KG, Herbst V, Brix B, et al. Comparison of elevated phosphorylated neurofilament heavy chains in serum and cerebrospinal fluid of patients with amyotrophic lateral sclerosis. J Neurol Neurosurg Psychiatry. 2018;89:367–73.
- Verde F, Silani V, Otto M. Neurochemical biomarkers in amyotrophic lateral sclerosis. Curr Opin Neurol. 2019;32:747–57.
- Gille B, De Schaepdryver M, Dedeene L, Goossens J, Claeys KG, Van Den Bosch L, et al. Inflammatory markers in cerebrospinal fluid: independent prognostic biomarkers in amyotrophic lateral sclerosis? J Neurol Neurosurg Psychiatry. 2019;90:1338–46.
- De Schaepdryver M, Lunetta C, Tarlarini C, Mosca L, Chio A, Van Damme P, et al. Neurofilament light chain and C reactive protein explored as predictors of survival in amyotrophic lateral sclerosis. J Neurol Neurosurg Psychiatry. 2020;91:436–7.
- Steinacker P, Feneberg E, Halbgebauer S, Witzel S, Verde F, Oeckl P, et al. Chitotriosidase as biomarker for early stage amyotrophic lateral sclerosis: a multicenter study. Amyotroph Lateral Scler Frontotemporal Degener. 2021;22:276–86.
- Thompson AG, Gray E, Verber N, et al. Multicentre appraisal of amyotrophic lateral sclerosis biofluid biomarkers shows primacy of blood neurofilament light chain. Brain Commun 2022;4:fcac029.
- Gendron TF, Daughrity LM, Heckman MG, Diehl NN, Wuu J, Miller TM, et al. Phosphorylated neurofilament heavy chain: a biomarker of survival for C9ORF72-associated amyotrophic lateral sclerosis. Ann Neurol. 2017;82:139–46.
- Verde F, Steinacker P, Weishaupt JH, Kassubek J, Oeckl P, Halbgebauer S, et al. Neurofilament light chain in serum for the diagnosis of amyotrophic lateral sclerosis. J Neurol Neurosurg Psychiatry. 2019;90:157–64.
- Benatar M, Zhang L, Wang L, Granit V, Statland J, Barohn R, et al. Validation of serum neurofilaments as prognostic and potential pharmacodynamic biomarkers for ALS. Neurology 2020;95:e59–e69.
- Huang F, Zhu Y, Hsiao-Nakamoto J, Tang X, Dugas JC, Moscovitch-Lopatin M, et al. Longitudinal biomarkers in amyotrophic lateral sclerosis. Ann Clin Transl Neurol. 2020;7:1103–16.
- Vu L, An J, Kovalik T, Gendron T, Petrucelli L, Bowser R. Cross-sectional and longitudinal measures of chitinase proteins in amyotrophic lateral sclerosis and expression of CHI3L1 in activated astrocytes. J Neurol Neurosurg Psychiatry. 350–8. 2020;91:
- Paganoni S, Macklin EA, Hendrix S, Berry JD, Elliott MA, Maiser S, et al. Trial of sodium phenylbutyrate-taurursodiol for amyotrophic lateral sclerosis. N Engl J Med. 2020;383:919–30.
- Miller TM, Cudkowicz ME, Genge A, Shaw PJ, Sobue G, Bucelli RC, et al. Trial of antisense oligonucleotide tofersen for SOD1 ALS. N Engl J Med. 2022;387:1099–110.
- U.S. Food & Drug Administration. FDA approves treatment of amyotrophic lateral sclerosis associated with a mutation in the SOD1 gene. 2023. https://www.fda.gov/drugs/news-events-human-drugs/fda-approves-treatment-amyotrophic-lateral-sclerosis-associated-mutation-sod1-gene (accessed June 25, 2023.
- McCauley ME, Baloh RH. Inflammation in ALS/FTD pathogenesis. Acta Neuropathol. 2019;137:715–30.
- Thonhoff JR, Simpson EP, Appel SH. Neuroinflammatory mechanisms in amyotrophic lateral sclerosis pathogenesis. Curr Opin Neurol. 2018;31:635–9.
- Varghese AM, Sharma A, Mishra P, Vijayalakshmi K, Harsha HC, Sathyaprabha TN, et al. Chitotriosidase - a putative biomarker for sporadic amyotrophic lateral sclerosis. Clin Proteomics. 2013;10:19.
- Kuhle J, Barro C, Andreasson U, Derfuss T, Lindberg R, Sandelius Å, et al. Comparison of three analytical platforms for quantification of the neurofilament light chain in blood samples: ELISA, electrochemiluminescence immunoassay and Simoa. Clin Chem Lab Med. 2016;54:1655–61.
- Vacchiano V, Mastrangelo A, Zenesini C, Masullo M, Quadalti C, Avoni P, et al. Plasma and CSF neurofilament light chain in amyotrophic lateral sclerosis: a cross-sectional and longitudinal study. Front Aging Neurosci. 2021;13:753242.
- Behzadi A, Pujol-Calderón F, Tjust AE, Wuolikainen A, Höglund K, Forsberg K, et al. Neurofilaments can differentiate ALS subgroups and ALS from common diagnostic mimics. Sci Rep. 2021;11:22128.
- Weydt P, Oeckl P, Huss A, Müller K, Volk AE, Kuhle J, et al. Neurofilament levels as biomarkers in asymptomatic and symptomatic familial amyotrophic lateral sclerosis. Ann Neurol. 2016;79:152–8.
- Halbgebauer S, Steinacker P, Verde F, Weishaupt J, Oeckl P, von Arnim C, et al. Comparison of CSF and serum neurofilament light and heavy chain as differential diagnostic biomarkers for ALS. J Neurol Neurosurg Psychiatry. 2022;93:68–74.
- Brooks BR, Miller RG, Swash M, Munsat TL. El Escorial revisited: revised criteria for the diagnosis of amyotrophic lateral sclerosis. Amyotroph Lateral Scler Other Motor Neuron Disord. Disord. 2000;1:293–9.
- Roche JC, Rojas-Garcia R, Scott KM, Scotton W, Ellis CE, Burman R, et al. A proposed staging system for amyotrophic lateral sclerosis. Brain. 2012;135:847–52.
- Cleves M. From the help desk: Comparing areas under receiver operating characteristic curves from two or more probit or logit models. The Stata Journal. 2002;2:301–13.
- Ruopp MD, Perkins NJ, Whitcomb BW, Schisterman EF. Youden Index and optimal cut-point estimated from observations affected by a lower limit of detection. Biom J. 2008;50:419–30.
- Westeneng H-J, Debray TPA, Visser AE, van Eijk RPA, Rooney JPK, Calvo A, et al. Prognosis for patients with amyotrophic lateral sclerosis: development and validation of a personalised prediction model. Lancet Neurol. 2018;17:423–33.
- Longinetti E, Fang F. Epidemiology of amyotrophic lateral sclerosis: an update of recent literature. Curr Opin Neurol. 2019;32:771–6.
- Boot RG, Renkema GH, Verhoek M, Strijland A, Bliek J, de Meulemeester TM, et al. The human chitotriosidase gene. Nature of inherited enzyme deficiency. J Biol Chem. 1998;273:25680–5.
- Oeckl P, Weydt P, Steinacker P, Anderl-Straub S, Nordin F, Volk AE, et al. Different neuroinflammatory profile in amyotrophic lateral sclerosis and frontotemporal dementia is linked to the clinical phase. J Neurol Neurosurg Psychiatry. 2019;90:4–10.
- Malaguarnera L, Simporè J, Prodi DA, Angius A, Sassu A, Persico I, et al. A 24-bp duplication in exon 10 of human chitotriosidase gene from the sub-Saharan to the Mediterranean area: role of parasitic diseases and environmental conditions. Genes Immun. 2003;4:570–4.
- Martinez-Merino L, Iridoy M, Galbete A, Roldán M, Rivero A, Acha B, et al. Evaluation of chitotriosidase and cc-chemokine ligand 18 as biomarkers of microglia activation in amyotrophic lateral sclerosis. Neurodegener Dis. 2018;18:208–15.
- Poesen K, De Schaepdryver M, Stubendorff B, Gille B, Muckova P, Wendler S, et al. Neurofilament markers for ALS correlate with extent of upper and lower motor neuron disease. Neurology 2017;88:2302–9.
- Rossi D, Volanti P, Brambilla L, Colletti T, Spataro R, La Bella V. CSF neurofilament proteins as diagnostic and prognostic biomarkers for amyotrophic lateral sclerosis. J Neurol. 2018;265:510–21.
- Reijn TS, Abdo WF, Schelhaas HJ, Verbeek MM. CSF neurofilament protein analysis in the differential diagnosis of ALS. J Neurol. 2009;256:615–9.
- Feneberg E, Oeckl P, Steinacker P, Verde F, Barro C, Van Damme P, et al. Multicenter evaluation of neurofilaments in early symptom onset amyotrophic lateral sclerosis. Neurology 2018;90:e22–e30.
- Thompson AG, Gray E, Thézénas M-L, Charles PD, Evetts S, Hu MT, et al. Cerebrospinal fluid macrophage biomarkers in amyotrophic lateral sclerosis. Ann Neurol. 2018;83:258–68.
- Thompson AG, Gray E, Bampton A, Raciborska D, Talbot K, Turner MR. CSF chitinase proteins in amyotrophic lateral sclerosis. J Neurol Neurosurg Psychiatry. 2019;90:1215–20.
- Abu-Rumeileh S, Vacchiano V, Zenesini C, Polischi B, de Pasqua S, Fileccia E, et al. Diagnostic-prognostic value and electrophysiological correlates of CSF biomarkers of neurodegeneration and neuroinflammation in amyotrophic lateral sclerosis. J Neurol. 2020;267:1699–708.
- Gille B, De Schaepdryver M, Goossens J, Dedeene L, De Vocht J, Oldoni E, et al. Serum neurofilament light chain levels as a marker of upper motor neuron degeneration in patients with amyotrophic lateral sclerosis. Neuropathol Appl Neurobiol. 2019;45:291–304.
- Akaike H. A new look at the statistical model identification. IEEE Trans Automat Contr. 1974;19:716–23.
- Steinacker P, Verde F, Fang L, Feneberg E, Oeckl P, Roeber S, et al. Chitotriosidase (CHIT1) is increased in microglia and macrophages in spinal cord of amyotrophic lateral sclerosis and cerebrospinal fluid levels correlate with disease severity and progression. J Neurol Neurosurg Psychiatry. 2018;89:239–47.
- Masrori P, De Schaepdryver M, Floeter MK, De Vocht J, Lamaire N, D'Hondt A, et al. Prognostic relationship of neurofilaments, CHIT1, YKL-40 and MCP-1 in amyotrophic lateral sclerosis. J Neurol Neurosurg Psychiatry. 2022;93:681–2.
- Manouchehrinia A, Piehl F, Hillert J, Kuhle J, Alfredsson L, Olsson T, et al. Confounding effect of blood volume and body mass index on blood neurofilament light chain levels. Ann Clin Transl Neurol. 2020;7:139–43.
- Benkert P, Meier S, Schaedelin S, Manouchehrinia A, Yaldizli Ö, Maceski A, et al. Serum neurofilament light chain for individual prognostication of disease activity in people with multiple sclerosis: a retrospective modelling and validation study. Lancet Neurol. 2022;21:246–57.
- Su W-M, Gu X-J, Duan Q-Q, Jiang Z, Gao X, Shang H-F, et al. Genetic factors for survival in amyotrophic lateral sclerosis: an integrated approach combining a systematic review, pairwise and network meta-analysis. BMC Med. 2022;20:209.
- Zucchi E, Bonetto V, Sorarù G, et al. Neurofilaments in motor neuron disorders: towards promising diagnostic and prognostic biomarkers. Mol Neurodegener 2020;15:58.
- Bridel C, van Wieringen WN, Zetterberg H, Tijms BM, Teunissen CE, Alvarez-Cermeño JC, et al. Diagnostic value of cerebrospinal fluid neurofilament light protein in neurology: a systematic review and meta-analysis. JAMA Neurol. 2019;76:1035–48.
- Khalil M, Teunissen CE, Otto M, Piehl F, Sormani MP, Gattringer T, et al. Neurofilaments as biomarkers in neurological disorders. Nat Rev Neurol. 2018;14:577–89.