
Abstract
Osteoarthritis (OA) is a multi-factorial chronic joint disease mainly identified by synovial inflammation, cartilage damage, and degeneration. Our study applied bioinformatics analysis to uncover the immunity in OA and tried to explore the underlying immune-related molecular mechanism. First, OA-related gene-expression profiling data were retrieved from GEO database. Then, we analysed a series of datadata with using the xCell algorithm, GEO2R, enrichment analysis of SangerBox website, CytoHubba, ROC logistic regression and correlation analysis. Finally, Nine infiltrating immune cells with differential abundance between OA and normal samples were obtained. There were 42 IODEGs in OA, and their functions were associated with immune cells and corresponding biological processes. Moreover, 5 hub genes, including GREM1, NRP1, VEGFA, FYN and IL6R, were identified. Correlation analysis demonstrated that NRP1 was negatively associated with NKT cells, NRP1 and GREM1 were positively associated with aDC, VEGFA was positively associated with CD8+ naïve T cells, while VEGFA, FYN and IL6R were negatively associated with Macrophages M1. The 5 hub genes could be employed as effective diagnostic biomarkers for OA. In addition, they may participate in OA pathogenesis via interactions with infiltrating immune cells.
Introduction
Osteoarthritis (OA) is a chronic degenerative joint disease of unknown aetiology. It is identified by articular cartilage degeneration and secondary osteoproliferation, and it clinically manifests progressive joint pain that leads to joint stiffness, limitation and even loss of function [Citation1]. On a global scale, OA is the most common amongst chronic joint diseases with the morbidity gradually increasing with age. As of 2017, OA affected 0.303 billion people, posing a major threat for human health and creating an enormous economic burden [Citation2]. Nonetheless, the pathogenesis of OA remains an open issue. To develop better preventive and treatment strategies for OA, it is necessary to clarify the potential mechanisms involved in occurrence and development of this medical condition.
OA is a highly complicated disease, and it is caused by an interplay between multiple factors, such as age, occupation, obesity, metabolic factors, and immune factors. Notably, immune factors have important implications throughout the course of OA [Citation3]. Research revealed that the infiltrating macrophages, neutrophils and lymphocytes within the synovial tissue are important in regulation of the chronic inflammatory process in OA [Citation4]. via producing a large amount of cytokine and chemokine, these infiltrating cells stimulate chondrocytes to produce matrix-degrading enzymes, accelerating cartilage breakdown and promoting the development of OA [Citation5]. In recent years, macrophage polarization and related cytokines have been extensively investigated in OA and reported to have a close relationship with the synovial and cartilage inflammation and responses to injury [Citation6]. In addition, the persistent articular cartilage damage and repair that are induced by chronic inflammation are correlated to multiple immune cells, including T lymphocytes, B lymphocytes, NK cells, and dendritic cells, etc. [Citation7–9]. In this context, there is an urgent need of systemic methods that can estimate the role of immune cells in OA and explore immune-related diagnostic biomarkers to help uncover the immune mechanisms in OA.
With the rapid development and extensive application of microarray sequencing, bioinformatics has been applied in a growing number of studies for identifying novel biomarkers for various diseases, exploring the involved epigenetic alterations, and unravelling the underlying molecular mechanisms. Existing bioinformatics research demonstrated that ZNF160 could be employed as a biomarker for diagnosis of OA [Citation10]. Infiltrating immune cells are critical for OA, but only a minority of bioinformatics studies explored their relationship. xCell algorithm is a gene signature-based method that performs cell type enrichment analysis from gene expression data for 64 immune and stromal cell types, followed by validation with extensive computer simulations and immunophenotyping [Citation11]. Therefore, it may allow for a systemic analysis of the immune cell infiltration in OA tissues.
In the present study, we firstly applied the xCell algorithm to explore the difference in immune infiltration between OA and healthy tissues. Subsequently, a series of bioinformatics analyses were used to screen out OA-related differentially expressed genes (DEGs) and investigate potential pathological mechanism of OA, including differential expression analysis, GO and KEGG enrichment analysis, protein-protein interaction (PPI) network analysis, Hub gene screening, ROC logistic regression. Finally, Spearman method was employed to analyze the relationship between the candidate biomarkers and significant infiltrating immune cells. In all, this study may help identify new biomarkers for diagnosis of OA and provide new insights into the diagnosis and immunotherapy of OA.
Methods and materials
Geo data acquisition and processing
OA-related gene expression profiling data were retrieved from GEO database (https://www.ncbi.nlm.nih.gov/geo/) based on the following criteria: (1) Homo sapiens; (2) RNA expression profiling by microarray; (3) OA and normal tissue samples. As a result, 3 eligible datasets were retrieved, including the GSE169077 [Citation12] used as the training set and the GSE55235 [Citation13] and GSE55457 [Citation13] used as the test sets. GEO2R (https://www.ncbi.nlm.nih.gov/geo/geo2r) was applied for data normalization and follow-up analysis. Basic information of selected datasets acquired from GEO was shown in . Immune-related genes were retrieved from ImmPort [Citation14] database (http://www.immport.org).
Table 1. Basic Information of selected datasets acquired from GEO.
Estimation of immune cell infiltration
xCell [Citation11] algorithm (https://xcell.ucsf.edu/) is a gene signature-based method that confers a relative infiltration score to 64 immune and stromal cell types according to the gene expression data measured by microarray sequencing. Here, the xCell algorithm was applied to estimate the specific infiltration of immune cells in OA and normal tissues. Principal component analysis (PCA) was performed to confirm whether the immune infiltrates between the groups were statistically significant. The infiltrating immune cells with p < .05 were selected and processed for correlation analysis using Spearman method.
Screening of immune-related DEGs
R packages “GEOquery” [Citation15] and “limma” [Citation16] of the interactive online tool GEO2R (https://www.ncbi.nlm.nih.gov/geo/geo2r) were applied for data normalization and screening of DEGs (|fold change| ≥1 and adj. p < .05). The immune-related and osteoarthritis-related differentially expressed genes (IODEGs) were obtained by intersecting the DEGs with the immune-related genes using the Draw Venn Diagram tool (http://bioinformatics.psb.ugent.be/webtools/Venn/). The resulting DEGs and IODEGs were visualized as Heatmaps.
Functional enrichment analysis
Gene Ontology (GO) was employed to analyze the IODEGs from three aspects: Biological Process (BP), Cellular Component (CC), and Molecular Function (MF) [Citation17]. Kyoto Encyclopaedia of Genes and Genomes (KEGG) [Citation18] was applied to explore the IODEG-related pathways and high-level biological functions. The background gene sets selected the GO annotations from SangerBox platform and the latest KEGG pathway gene annotations that were obtained from KEGG rest API (https://www.kegg.jp/kegg/rest/keggapi.html). Enrichment analysis was fulfilled with SangerBox platform [Citation19]. The maximum and minimum gene set sizes were set to 5,000 and 5, respectively, and the threshold of statistical significance was set to p-Value < .05 and FDR < 0.25.
Identification of Hub genes
PPI of IODEGs were analyzed with STRING (https://cn.string-db.org), and the PPIs with a score >0.4 were visualized as a network using Cytoscape (v3.9.1) [Citation20]. The top 15 nodes (genes) were scored with 8 algorithms as implemented by plug-in CytoHubba of Cytoscape, including Maximal Clique Centrality (MCC), Degree, Edge Percolated Component (EPC), BottleNeck, EcCentricity, Closeness, Radiality, and Betweenness. Hub genes were identified by R package “UpSet” [Citation21] of SangerBox platform and validated using the GSE55235 and GSE55457 gene sets.
Assessment of the diagnostic effectiveness of candidate biomarkers
ROC logistic regression as implemented by SPSS 20.0 was used to validate the effectiveness of the candidate biomarkers for diagnosis of OA in the GSE55235 and GSE55457 gene sets, with the area under the ROC curve (ROC-AUC) used as the criterion.
Relationship between diagnostic biomarkers and infiltrating immune cells
To gain more insight into the potential mechanism of action of infiltrating immune cells in OA, the link between the candidate diagnostic biomarkers and the infiltrating immune cells in OA was analyzed using the Spearman method (p < .05). The results were visualized with R package “ggplot2” [Citation22] (https://sourceforge.net/projects/ggplot2.mirror/) of SangerBox platform.
Data analysis and visualization
Statistical analysis and data visualization were conducted with RStudio 3.6.3, SPSS 20.0, and Sangerbox3.0 (http://vip.sangerbox.com/home.html). Spearman method was applied for correlation analysis. All data were shown as mean ± standard deviation. A p < .05 was interpreted as statistically significant.
Results
Immune cell infiltration between OA and normal samples
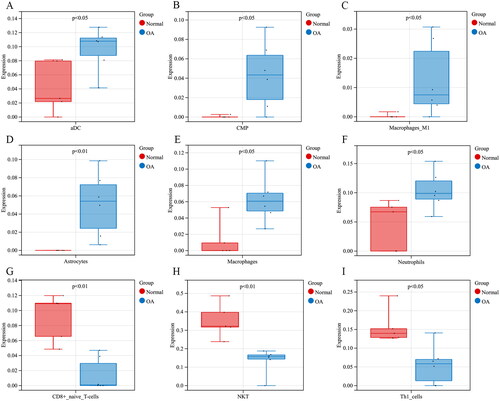
Immune cell infiltration in OA and normal tissues was firstly analysed based on GEO data. PCA analysis demonstrated that the difference in immune cell infiltration between the two sample types was statistically significant (). The specific infiltration of 64 immune cell populations was analysed by the xCell algorithm and visualized as Heatmap () and Box plot (). As analyzed, the infiltrating immune cells with the most significant differences between OA and normal tissues were dominated by aDC, Astrocytes, CD8+ naïve T cells, CMP, Macrophages, Macrophages M1, Neutrophils, NKT, and Th1 cells. The corresponding proportions of the nine immune cell populations were calculated (). Correlation analysis demonstrated that Astrocytes had the strongest positive relationship with CMP (r = 0.87), while NKT exhibited the strongest negative relationship with Neutrophils (r = −0.77) (). In comparison to the normal tissues, the OA tissues had significantly abundant aDC, Astrocytes, CMP, Macrophages, Macrophages M1, and Neutrophils (), but less abundant CD8+ naïve T cells, NKT, and Th1 cells ().
Figure 1. Immune cell infiltration in OA and normal tissues. (A) PCA of 64 immune cell types, and corresponding abundance calculated by xCell algorithm; (B) Heatmap of the 64 immune cell types; (C) Box plot of the 64 immune cell types; (D) Relative percentage of the 9 differential infiltrating immune cell types (The X-axis represents 5× normal samples and 6× OA samples, and the Y-axis represents the relative percentage of the 9 immune cell types in each sample; The coloured bars on the right represent the type of immune cells); (E) Heatmap of the 9 differential infiltrating immune cell types.
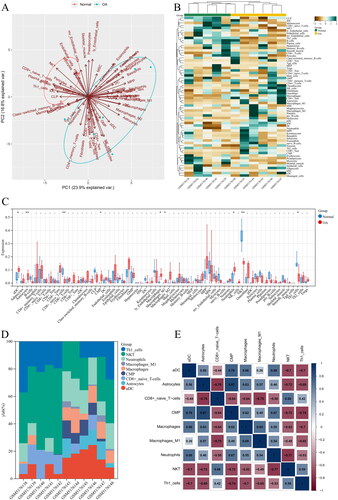
Figure 2. Up-regulated and down-regulated infiltrating immune cells in OA. Red represents the expression in normal tissues, and blue represents the expression in OA tissues. Up-regulated infiltrating immune cells in OA included (A) aDC; (B) CMP; (C) Macrophages M1; (D) Astrocytes; (E) Macrophages; (F) Neutrophils; while down-regulated infiltrating immune cells were (G) CD8+ naïve T cells;(H) NKT; (I) Th1 cells.
Iodegs between OA and normal tissues
In the GSE169077 dataset, a total of 382 DEGs were screened out between OA and normal tissues, including 166 up-regulated and 216 down-regulated genes in OA samples (). In the meantime, 1,793 immune-related genes were retrieved from the ImmPort database. IODEGs were obtained by intersecting the 382 DEGs with the 1,793 immune-related genes (). As a result, 42 IODEGs were acquired, including 23 up-regulated and 19 down-regulated genes ().
Figure 3. OA-related DEGs and IODEGs. (A) Volcano Plot of OA-related DEGs (VEGFA, FYN, IL6R, NRP1, and GREM1 were diagnostic biomarkers for OA); (B) Heatmap of OA-related DEGs; (C) Venn diagram of OA-related DEGs and immune-related genes retrieved from the ImmPort database; (D) Heatmap of 42 OA-related IODEGs.
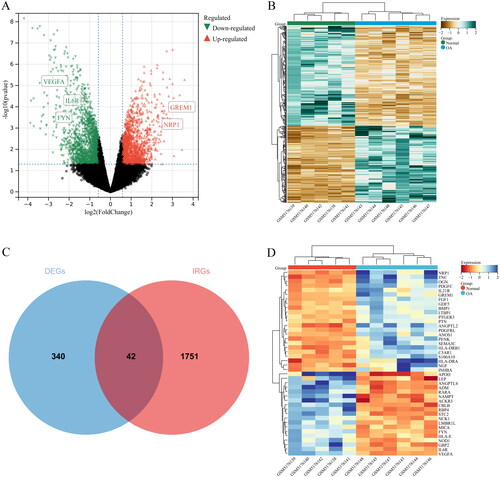
Table 2. IODEGs between OA and normal groups.
Go and KEGG pathway analysis for IODEGs
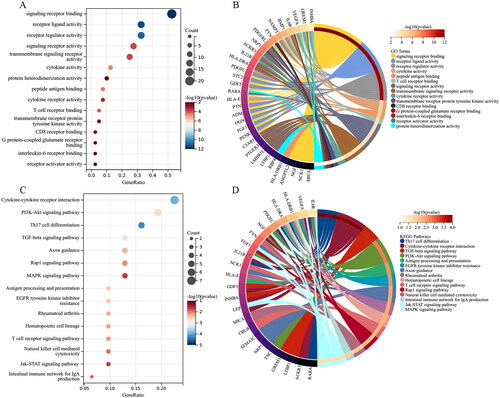
GO terms of the IODEGs were represented by BP, CC, and MF. With respect to BP, the IODEGs were mainly enriched in immune cell-related pathways, including cell surface receptor signalling pathway, regulation of immune system process, regulation of cell adhesion, and positive regulation of immune system process (); As for CC, the IODEGs were enriched in MHC protein complex, extracellular region, and extracellular matrix (); while for MF, the IODEGs were mostly enriched in signalling receptor binding, receptor ligand activity, receptor regulator activity, T cell receptor binding, and G protein-coupled glutamate receptor binding (). The most enriched KEGG pathways of the IODEGs were involved in Th17 cell differentiation, Cytokine-cytokine receptor interaction, TGF-beta signalling pathway, PI3K-Akt signalling pathway, Antigen processing and presentation, Rheumatoid arthritis, T cell receptor signalling pathway, AND Jak-STAT signalling pathway (). Collectively, the function of IODEGs was closely linked to immune cells.
Figure 4. GO terms of the IODEGs from aspects of BP and CC. (A,B) Bubble Chart and Circle Graph of GO terms of the IODEGs from aspect of BP; (C,D) Bubble Chart and Circle Graph of GO terms of the IODEGs from aspect of CC.
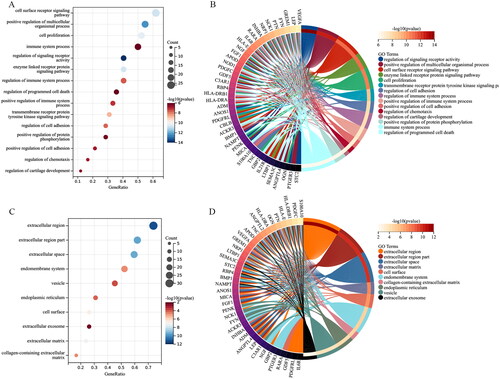
Figure 5. GO terms of the IODEGs from aspect of MF and KEGG pathways. (A,B) Bubble Chart and Circle Graph of GO terms of the IODEGs from aspect of MF; (C,D) Bubble Chart and Circle Graph of KEGG pathways of the IODEGs.
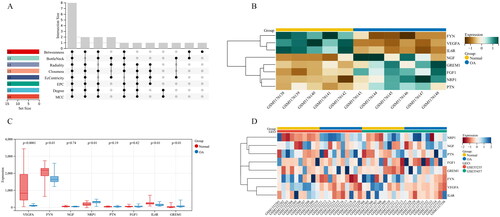
Identification and visualization of Hub genes
A PPI network of the IODEGs was generated with the STRING database and visualized by the Cytoscape (). With the 8 algorithms as implemented by the plug-in CytoHubba of the Cytoscape, the top 15 nodes (genes) were scored and visualized (). Further screening with R package “UpSet” resulted in 8 Hub genes, including VEGFA, FYN, and IL6R which showed down-regulated expression in OA, and NGF, PTN, FGF1, NRP1, and GREM1 which showed up-regulated expression. Their expression in the GSE169077 microarray dataset was visualized as Heatmap (). Expression of the 8 Hub genes was validated in the GSE55235 and GSE55457 datasets and visualized as Boxplot and Heatmap (). Consistently, VEGFA, FYN, and IL6R had significantly lower expression in OA tissues than normal tissues, while NRP1 and GREM1 reversely had remarkably higher expression in OA tissues. It could be inferred that VEGFA, FYN, IL6R, NRP1 and GREM1 could be employed as candidate biomarkers for diagnosis of OA.
Figure 6. PPI network establishment. (A) PPI of the 42 IODEGs analyzed with the STRING database; (B) PPI network visualized by the Cytoscape, where red nodes represent up-regulated genes and green nodes represent down-regulated genes.
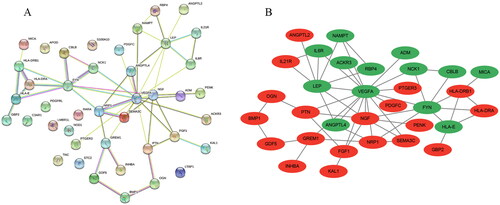
Figure 7. Screening of Hub genes based on the 8 algorithms as implemented by the plug-in CytoHubba. (A) MCC; (B) Degree; (C) EPC; (D) EcCentricity; (E) BottleNeck; (F) Closeness; (G) Radiality; (H) Betweenness. The rank of protein is indicated by colour intensity (from yellow to red), i.e. a higher rank of protein is indicated by a darker red colour.
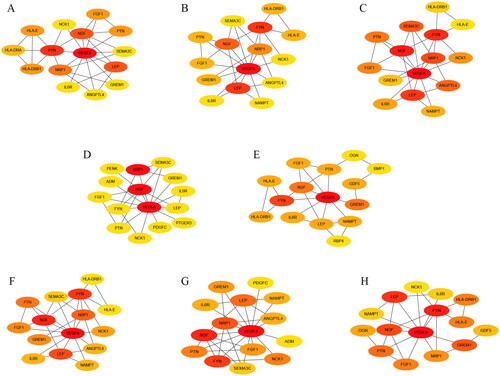
Figure 8. Identification and validation of Hub genes. (A) Identification of Hub genes with R package “UpSet”; (B) Heatmap of the 8 Hub genes in the GSE169077 datasets; (C,D) Boxplot and Heatmap of the 8 Hub genes in the GSE55235 and GSE55457 datasets.
Assessment of the diagnostic effectiveness of candidate biomarkers
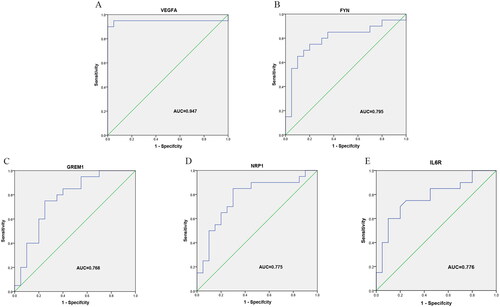
To validate the effectiveness of the 5 Hub genes in diagnosis of OA, ROC logistic regression analysis was performed based on the GSE55235 and GSE55457 datasets. AUC value >0.700 is considered as effective and highly reliable. It was found that the AUC values of VEGFA, FYN, GREM1, NRP1, and IL6R were 0.947, 0.795, 0.768, 0.775, and 0.776, respectively (), indicating good sensitivity and specificity of the 5 Hub genes in diagnosis of OA.
Figure 9. Validation of the 5 Hub genes in OA diagnosis in the GSE55235 and GSE55457 datasets with ROC curve analysis. (A) VEGFA; (B) FYN; (C) GREM1; (D) NRP1; (E) IL6R.
Relationship between diagnostic biomarkers and infiltrating immune cells in OA
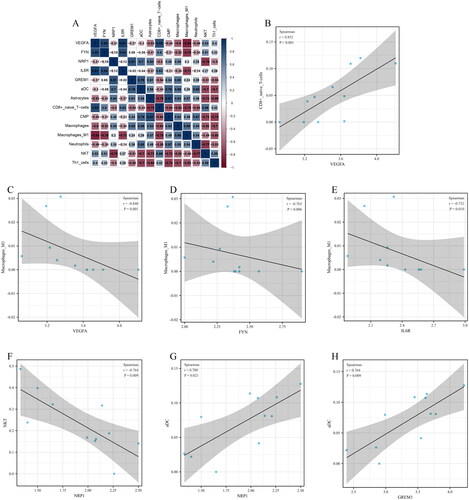
Relationship between the 5 candidate diagnostic biomarkers (VEGFA, FYN, GREM1, NRP1, and IL6R) and 9 differential infiltrating immune cell types (aDC, Astrocytes, CD8+ naïve T cells, CMP, Macrophages, Macrophages M1, Neutrophils, NKT, and Th1 cells) was analyzed, and the significant relationship pairs were identified by r > 0.70 and p < .05 (). VEGFA was significantly positively associated with CD8+ naïve T cells (r = 0.852, p < .001) (), while VEGFA (r = −0.840, p = .001), FYN (r = −0.765, p = .006), and IL6R (r = −0.732, p = .010) were negatively associated with Macrophages M1 (). In addition, NRP1 was negatively associated with NKT (r = −0.764, p = .009) (), while NRP1 (r = 0.700, p = .021) and GREM1 (r = 0.764, p = .009) were positively associated with aDC ().
Figure 10. Relationship between candidate diagnostic biomarkers and differential infiltrating immune cell types. (A) Matrixplot of correlation coefficients; (B) VEGFA-CD8+ naïve T cells; (C) VEGFA-Macrophages M1; (D) FYN-Macrophages M1; (E) IL6R-Macrophages M1; (F) NRP1-NKT; (G) NRP1-aDC; (H) GREM1-aDC.
Discussion
OA is a chronic irreversible degenerative disease that might be driven by persistent inflammation, which is resulted from congenital and adaptive immune responses and can cause irreversible synovial damage and cartilage breakdown leading to joint dysfunction [Citation23,Citation24]. Multiple studies have noted that activation and interaction of infiltrating immune cells are critical for regulation of synovitis formation and persistent cartilage damage in OA. Therefore, regulation of immune response is necessary for OA treatment [Citation25–27]. Nonetheless, no effective biomarkers for OA diagnosis are available at present due to the complicated pathogenesis of OA. High-throughput sequencing technique allows for better exploring the mechanisms underlying the occurrence and development of OA as well as looking for new effective diagnostic biomarkers. In this study, we combined the high-throughput sequencing with bioinformatics to analyse the role of infiltrating immune cells in OA and identify new effective diagnostic biomarkers.
At first, the GSE169077 dataset was obtained for analysis of infiltrating immune cells. We found that Astrocytes, M1 Macrophages, Macrophages, Common Myeloid Progenitors (CMP), Neutrophils, and aDC were more abundant in OA samples than normal samples, while CD8+ naïve T cells, Th1 cells, and NKT were less abundant in OA samples. It has been proven that macrophages and the various factors they secrete are important in regulation of joint synovial homeostasis and cartilage functioning [Citation28]. Upon dysregulation of macrophage function in synovial homeostasis, more macrophages will be recruited to the joint synovium resulting in exacerbated synovial inflammation. In the meantime, there is a trend of macrophage polarization towards the M1 phenotype in OA, which also plays a pro-inflammatory role [Citation29,Citation30]. Some studies found that suppression of macrophage M1 polarization could slow the progression of OA, and that promotion of polarization towards the M2 phenotype via the NF-κB pathway was conducive to recovery from OA [Citation31–33]. M1 macrophages are pro-inflammatory that can secrete cytokines to promote the recruitment of neutrophils and the proliferation and activation of synovial fibroblasts. The neutrophils and fibroblasts exert synergistic effects to potentiate persistent development of inflammation [Citation34]. T-cell polarization, especially CD4+ T-cell differentiation to Th1 cell, and the abnormal immune response it mediates are also involved in the occurrence and development of OA [Citation35]. It was report that CD8+ naïve T cells and NKT cells significantly changed in the peripheral blood, synovial fluid and synovium in OA patients and played a role in OA onset [Citation36,Citation37]. Dendritic cells (DC) are heterogeneous, specialized antigen presenting cells that are vital in the congenital and adaptive immunity. Mature DCs can induce the production of a large amount of inflammatory factors through increasing the expression of Toll-like receptors, promoting T-lymphocyte proliferation and subsequently leading to synovitis and cartilage degeneration [Citation38]. Our findings are basically consistent with the studies mentioned above. However, role of these immune cells in OA was only highlighted by bioinformatics, requiring further experimental validation.
To obtain more effective diagnostic biomarkers, 382 DEGs between OA and normal samples were obtained, including 42 IODEGs. GO and KEGG pathway analyses demonstrated that the IODEGs were mainly involved in inflammatory and immune responses, suggesting that the function of these IODEGs might be associated with immune cells. Subsequently, 5 Hub genes, including GREM1, NRP1, VEGFA, FYN and IL6R, were identified, and as validated by the test sets and ROC logistic regression analysis, they had good diagnostic performance. This finding made our study results more reliable. We speculated that the 5 Hub genes may play an important regulatory role in pathogenesis of OA.
GREM1 (Gremlin 1, DAN Family BMP Antagonist) can modulate the bone morphogenetic protein (BMP) signalling pathway by serving as a BMP antagonist. Previous research showed significant up-regulation of GREM1 in chondrocytes in human OA, which affected tissue remodelling by regulating the BMP activity. Additionally, it was also validated in animal models that GREM1 was positively associated with disease severity [Citation39,Citation40]. Another study revealed that the persistent inflammation and immune microenvironment in OA could also lead to GREM1 elevation, resulting in synovial hyperplasia and long-term inflammation [Citation41]. Moreover, the latest mechanistic study reported that the dysregulation of circ_SPG11 in OA could promote the IL-1β-induced chondrocyte apoptosis and extracellular matrix (ECM) degradation via increasing GREM1 expression [Citation42]. NRP1 (Neuropilin 1) is the binding receptor of Semaphorin 3 A (SEMA3A), while their binding is critical to the immunity and bone metabolism [Citation43]. Early research showed that both NRP1 and SEMA3A were highly expressed in OA cartilage, and their synergistic effects were suppressive for the effect of VEGF165 in promoting migration of chondrocytes in early OA [Citation44]. In addition, high expression levels of NRP1 and SEMA3A could also inhibit the early-stage inflammation in OA [Citation45]. Other scholars found that persistent low-grade inflammation in OA could lead to persistent high expression of NRP1 and its ligand protein upon IL-1β and TNF-α stimulation, subsequently promoting apoptosis in chondrocytes through the PI3K/Akt signalling pathway [Citation46]. Combining the studies, more experiments are warranted to clarify the role of NRP1 in OA. VEGFA (Vascular Endothelial Growth Factor A) is a homodimeric vasoactive glycoprotein critical to angiogenesis and important for inflammatory response [Citation47]. It was reported that VEGFA was an important regulator of angiogenesis during the process of endochondral bone formation. It could promote the formation and maturation of blood vessels with the cartilage, regulate the activity and maintain the survival of osteoblasts, thereby potentiating the formation of the new bone [Citation48–50]. In addition, under the regulation of upstream miR-214-3p and miR-140-5p, VEGFA could also participate in the inflammatory response in OA through reducing the cartilage and synovial damages in OA [Citation51,Citation52]. FYN (FYN Proto-Oncogene, Src Family Tyrosine Kinase) is one of the tyrosine-specific phosphotransferases. It undergoes autophosphorylation upon stimulation by multiple transmembrane receptors and plays a role in biological processes, such as inflammation and cell survival, by mediating various signalling pathways [Citation53]. A recent study suggested that effective reduction in FYN and β-catenin protein expression could decease the level of enzymes involved in ECM catabolism within the bone, thereby delaying the exacerbation of OA [Citation54]. IL-6R is the receptor protein of pro-inflammatory cytokine IL-6, and it plays an important regulatory role in inflammatory and immune responses. Research revealed that application of Let-7a inhibitor in lipopolysaccharide-induced chondrocytes could significantly reduce the expression of inflammation-related factors and increase the expression of IL-6R to promote chondrocyte viability and then decrease apoptosis [Citation55]. In addition, studies have also confirmed the related pathways of 5 Hub genes and their related effects. It was found that exosomal miR-150 derived from BMSCs inhibited TNF-α-mediated osteoblast apoptosis by regulating GREM1/NF-κB signalling pathway, thereby improving the symptoms of osteonecrosis of the femoral head [Citation56]. In breast cancer metastasis experiments, FOXO3a-driven ectopic expression of miR-29b-2/miR-338 could inhibit EMT, migration, invasion and in vivo metastasis of breast cancer by regulating VEGFA/NRP1 signalling [Citation57]. Yue et al. found that resveratrol coould also mediate the activation of NRF2 through the AKT/GSK3β/FYN signalling axis, significantly improving the osteoblast dysfunction induced by high glucose [Citation58]. Further studies had shown that circ_0016347 could regulate the function and action of osteosarcoma cells by inactivating the JAK2/STAT3 signalling pathway via the miR-661/IL6R axis [Citation59]. However, its concrete effects and correlation pathway mechanisms in the initiation and progression of OA need to be confirmed by rigorous experimental research. The current study identified that the 5 Hub genes had a potential role as a predictor of OA. Therefore, the 5 Hub genes could be considered as potential effective diagnostic biomarkers for OA.
Since both the 5 Hub genes and infiltrating immune cells identified before have a significant regulatory role in OA, we further analysed their relationship. We noted that VEGFA (r = −0.840, p = .001), FYN (r = −0.765, p = .006) and IL6R (r = −0.732, p = .010) were negatively associated with M1 macrophage. Existing studies proved that the VEGF165b secreted by macrophage would competitively inhibit VEGFA expression and downstream pathway activation, inducing more M1 macrophages and further suppressing angiogenesis and perfusion recovery of ischaemic muscle [Citation60]. Likewise, activation of FYN-related pathways could effectively improve the Nrf2-mediated redox homeostasis, thereby inhibiting macrophage infiltration [Citation61]. A study on breast cancer showed that suppression of pro-oncogenic gene MCT-1 up-regulated miR-34a expression, which inhibited IL-6R expression and promoted M1 polarization [Citation62]. This study also noted that NRP1 was positively associated with aDC (r = 0.700, p = .021) but negatively associated with NKT (r = −0.764, p = .009). In an environment rich in vascular endothelial factors, high NRP1 expression activates downstream related pathways, promoting the maturation and activation of DCs [Citation63]. In addition, NRP1 as the surface marker of Tregs is conducive to long-term interactions between Tregs and immature DCs [Citation64]. Stradner MH et al. [Citation65]found that Id2 deficiency could induce a hyporesponsive state of iNKT cells and then maintain NRP1 at a high level, thereby playing an anti-inflammatory role. Other relationship pairs we found here were first reported as potentially linked to the occurrence and development of OA, which provides new insights into relevant research fields. Collectively, we reasoned that the 5 diagnostic biomarkers may be a part of OA pathogenesis via interacting with related immune cells. Nevertheless, further experiments are in demand for validation.
In spite of the findings, this study still has some limitations. First, this is a retrospective study, and prospective studies with more samples and methods are required to validate the findings of the current study. Second, clinical information is not covered in this study. Besides, the upstream and downstream regulatory pathways of the identified biomarkers need to be further investigated. Finally, in-vivo and ex-invivo experiments, including experiments in human samples and animals, should be performed before clinical translation of the findings of the study.
To sum up, this study made a detailed analysis on OA-related immune cell infiltration and identified 5 potentially effective diagnostic biomarkers for OA (GREM1, NRP1, VEGFA, FYN and IL6R). Through a series of bioinformatics analyses, we established multiple biomarker-infiltrating immune cell relationship pairs, including VEGFA-CD8+ naïve T cells, VEGFA-Macrophages M1, FYN-Macrophages M1, IL6R-Macrophages M1, NRP1-NKT, NRP1-aDC, and GREM1-aDC. We believed that these relationship pairs played their role during the occurrence and development of OA via participating in immune responses. In all, the current study provides new insights into the immunomodulatory mechanism of OA and also a new direction for research into the diagnosis and treatment of OA.
Author contributions
Jiachen Peng, Tao Zhang and Piaotao Cheng had substantial contributions to the conception or design of the experiments and supervised the study. Piaotao Cheng, Shouhang Gong, Caopei Guo, Ping Kong, Chencheng Li and Chengbing Yang were involved in the acquisition, analysis or interpretation of data for the work. Jiachen Peng, Tao Zhang, Piaotao Cheng, Shouhang Gong, Caopei Guo, Ping Kong, Chencheng Li and Chengbing Yang drafted the work and revised it critically for important intellectual content and finally approved the version to be published. All authors agree to be accountable for all aspects of the work in ensuring that questions related to the accuracy or integrity of any part of the work are appropriately investigated and resolved.
Acknowledgments
We acknowledge the GEO database and SangerBox website for providing their platforms as well as their contributors for uploading meaningful datasets.
Disclosure statement
The authors declare that the research was conducted in the absence of any commercial or financial relationships that could be construed as a potential conflict of interest.
Data availability statement
The GSE169077, GSE55235 and GSE55457 datasets were publicly available and obtained from Gene Expression Omnibus (GEO, https://www.ncbi.nlm.nih.gov/geo/). The names of the repository and accession number(s) can be found in the online repositories.
Additional information
Funding
References
- Katz JN, Arant KR, Loeser RF. Diagnosis and treatment of hip and knee osteoarthritis: a review. Jama. 2021;325(6):568–578.
- Global, regional, and national incidence, prevalence, and years lived with disability for 354 diseases and injuries for 195 countries and territories, 1990–2017: a systematic analysis for the global burden of disease study 2017. Lancet. 2018;392(10159):1789–1858.
- Vincent TL. Targeting mechanotransduction pathways in osteoarthritis: a focus on the pericellular matrix. Curr Opin Pharmacol. 2013;13(3):449–454.
- Scanzello CR, Goldring SR. The role of synovitis in osteoarthritis pathogenesis. Bone. 2012;51(2):249–257.
- Woodell-May JE, Sommerfeld SD. Role of inflammation and the immune system in the progression of osteoarthritis. J Orthop Res. 2020;38(2):253–257.
- Zhang H, Cai D, Bai X. Macrophages regulate the progression of osteoarthritis. Osteoarthritis Cartilage. 2020;28(5):555–561.
- Li M, Yin H, Yan Z, et al. The immune microenvironment in cartilage injury and repair. Acta Biomater. 2022;140:23–42.
- Nedunchezhiyan U, Varughese I, Sun AR, et al. Obesity, inflammation, and immune system in osteoarthritis. Front Immunol. 2022;13:907750.
- Molnar V, Matišić V, Kodvanj I, et al. Cytokines and chemokines involved in osteoarthritis pathogenesis. Int J Mol Sci. 2021;22(17):9208.
- Wu ZY, Du G, Lin YC. Identifying hub genes and immune infiltration of osteoarthritis using comprehensive bioinformatics analysis. J Orthop Surg Res. 2021;16(1):630.
- Aran D, Hu Z, Butte AJ. xCell: digitally portraying the tissue cellular heterogeneity landscape. Genome Biol. 2017;18(1):220.
- Attur M, Duan X, Cai L, et al. Periostin loss-of-function protects mice from post-traumatic and age-related osteoarthritis. Arthritis Res Ther. 2021;23(1):104.
- Woetzel D, Huber R, Kupfer P, et al. Identification of rheumatoid arthritis and osteoarthritis patients by transcriptome-based rule set generation. Arthritis Res Ther. 2014;16(2):R84.
- Bhattacharya S, Dunn P, Thomas CG, et al. ImmPort, toward repurposing of open access immunological assay data for translational and clinical research. Sci Data. 2018;5(1):180015.
- Davis S, Meltzer PS. GEOquery: a bridge between the gene expression omnibus (GEO) and BioConductor. Bioinformatics. 2007;23(14):1846–1847.
- Ritchie ME, Phipson B, Wu D, et al. Limma powers differential expression analyses for RNA-sequencing and microarray studies. Nucleic Acids Res. 2015;43(7):e47–e47.
- Wilkerson MD, Hayes DN. ConsensusClusterPlus: a class discovery tool with confidence assessments and item tracking. Bioinformatics. 2010;26(12):1572–1573.
- Kanehisa M, Goto S. KEGG: Kyoto encyclopedia of genes and genomes. Nucleic Acids Res. 2000;28(1):27–30.
- Shen W, Song Z, Zhong X, et al. Sangerbox: a comprehensive, interaction-friendly clinical bioinformatics analysis platform. iMeta. 2022;1(3):e36.
- Shannon P, Markiel A, Ozier O, et al. Cytoscape: a software environment for integrated models of biomolecular interaction networks. Genome Res. 2003;13(11):2498–2504.
- Lex A, Gehlenborg N, Strobelt H, et al. UpSet: visualization of intersecting sets. IEEE Trans Visual Comput Graphics. 2014;20(12):1983–1992.
- Ito K, Murphy D. Application of ggplot2 to pharmacometric graphics. CPT Pharmacometrics Syst Pharmacol. 2013;2(10):e79.
- Kulkarni P, Martson A, Vidya R, et al. Pathophysiological landscape of osteoarthritis. Adv Clin Chem. 2021;100:37–90.
- Lin R, Deng C, Li X, et al. Copper-incorporated bioactive glass-ceramics inducing anti-inflammatory phenotype and regeneration of cartilage/bone interface. Theranostics. 2019;9(21):6300–6313.
- Mahon OR, Kelly DJ, McCarthy GM, et al. Osteoarthritis-associated basic calcium phosphate crystals alter immune cell metabolism and promote M1 macrophage polarization. Osteoarthritis Cartilage. 2020;28(5):603–612.
- Deng Z, Zhang Q, Zhao Z, et al. Crosstalk between immune cells and bone cells or chondrocytes. Int Immunopharmacol. 2021;101(Pt A):108179.
- Culemann S, Grüneboom A, Nicolás-Ávila J, et al. Locally renewing resident synovial macrophages provide a protective barrier for the joint. Nature. 2019;572(7771):670–675.
- Manferdini C, Paolella F, Gabusi E, et al. From osteoarthritic synovium to synovial-derived cells characterization: synovial macrophages are key effector cells. Arthritis Res Ther. 2016;18(1):83.
- Wood MJ, Leckenby A, Reynolds G, et al. Macrophage proliferation distinguishes 2 subgroups of knee osteoarthritis patients. JCI Insight. 2019;4(2):125325.
- Lv Z, Xu X, Sun Z, et al. TRPV1 alleviates osteoarthritis by inhibiting M1 macrophage polarization via Ca(2+)/CaMKII/Nrf2 signaling pathway. Cell Death Dis. 2021;12(6):504.
- Lu Y, Liu L, Pan J, et al. MFG-E8 regulated by miR-99b-5p protects against osteoarthritis by targeting chondrocyte senescence and macrophage reprogramming via the NF-κB pathway. Cell Death Dis. 2021;12(6):533.
- Lu J, Zhang H, Pan J, et al. Fargesin ameliorates osteoarthritis via macrophage reprogramming by downregulating MAPK and NF-κB pathways. Arthritis Res Ther. 2021;23(1):142.
- Hsueh MF, Zhang X, Wellman SS, et al. Synergistic roles of macrophages and neutrophils in osteoarthritis progression. Arthritis Rheumatol. 2021;73(1):89–99.
- Rosshirt N, Trauth R, Platzer H, et al. Proinflammatory T cell polarization is already present in patients with early knee osteoarthritis. Arthritis Res Ther. 2021;23(1):37.
- Li YS, Luo W, Zhu SA, et al. T cells in osteoarthritis: alterations and Beyond. Front Immunol. 2017;8:356.
- Eltit F, Mohammad N, Medina I, et al. Perivascular lymphocytic aggregates in hip prosthesis-associated adverse local tissue reactions demonstrate Th1 and Th2 activity and exhausted CD8(+) cell responses. Journal Orthopaedic Research. 2021;39(12):2581–2594.
- Alahdal M, Zhang H, Huang R, et al. Potential efficacy of dendritic cell immunomodulation in the treatment of osteoarthritis. Rheumatology. 2021;60(2):507–517.
- Tardif G, Hum D, Pelletier JP, et al. Differential gene expression and regulation of the bone morphogenetic protein antagonists follistatin and gremlin in normal and osteoarthritic human chondrocytes and synovial fibroblasts. Arthritis Rheum. 2004;50(8):2521–2530.
- Tardif G, Pelletier JP, Boileau C, et al. The BMP antagonists follistatin and gremlin in normal and early osteoarthritic cartilage: an immunohistochemical study. Osteoarthr Cartil. 2009;17(2):263–270.
- Huang X, Zhong L, van Helvoort E, et al. The expressions of Dickkopf-related protein 1 and Frizzled-related protein are negatively correlated to local inflammation and osteoarthritis severity. Cartilage. 2021;12(4):496–504.
- Yi J, Jin Q, Zhang B, et al. Gremlin-1 concentrations are correlated with the severity of knee osteoarthritis. Med Sci Monit. 2016;22:4062–4065.
- Ouyang X, Ding Y, Yu L, et al. Circ_SPG11 plays contributing effects on IL-1β-induced chondrocyte apoptosis and ECM degradation via miR-665 inhibition-mediated GREM1 upregulation. Clin Immunol. 2021;233:108889.
- Lepelletier Y, Moura IC, Hadj-Slimane R, et al. Immunosuppressive role of semaphorin-3A on T cell proliferation is mediated by inhibition of actin cytoskeleton reorganization. Eur J Immunol. 2006;36(7):1782–1793.
- Okubo M, Kimura T, Fujita Y, et al. Semaphorin 3A is expressed in human osteoarthritic cartilage and antagonizes vascular endothelial growth factor 165-promoted chondrocyte migration: an implication for chondrocyte cloning. Arthritis Rheum. 2011;63(10):3000–3009.
- Sumi C, Hirose N, Yanoshita M, et al. Semaphorin 3A inhibits inflammation in chondrocytes under excessive mechanical stress. Mediators Inflamm. 2018;2018:1–9.
- Sun J, Wei X, Wang Z, et al. Inflammatory milieu cultivated Sema3A signaling promotes chondrocyte apoptosis in knee osteoarthritis. J Cell Biochem. 2018;119(3):2891–2899.
- MacDonald IJ, Liu SC, Su CM, et al. Implications of angiogenesis involvement in arthritis. Int J Mol Sci. 2018;19(7):2012.
- Maes C, Carmeliet P, Moermans K, et al. Impaired angiogenesis and endochondral bone formation in mice lacking the vascular endothelial growth factor isoforms VEGF164 and VEGF188. Mech Dev. 2002;111(1–2):61–73.
- Midy V, Plouët J. Vasculotropin/vascular endothelial growth factor induces differentiation in cultured osteoblasts. Biochem Biophys Res Commun. 1994;199(1):380–386.
- Zelzer E, Mamluk R, Ferrara N, et al. VEGFA is necessary for chondrocyte survival during bone development. Development. 2004;131(9):2161–2171.
- Xiao P, Zhu X, Sun J, et al. Cartilage tissue miR-214-3p regulates the TrkB/ShcB pathway paracrine VEGF to promote endothelial cell migration and angiogenesis. Bone. 2021;151:116034.
- Cao F, Chen Y, Wang X, et al. Therapeutic effect and potential mechanisms of intra-articular injections of miR-140-5p on early-stage osteoarthritis in rats. Int Immunopharmacol. 2021;96:107786.
- Ferrao Blanco MN, Domenech Garcia H, Legeai-Mallet L, et al. Tyrosine kinases regulate chondrocyte hypertrophy: promising drug targets for osteoarthritis. Osteoarth Cartil. 2021;29(10):1389–1398.
- Li K, Zhang Y, Zhang Y, et al. Tyrosine kinase fyn promotes osteoarthritis by activating the β-catenin pathway. Ann Rheum Dis. 2018;77(6):935–943.
- Sui C, Zhang L, Hu Y. MicroRNA‑let‑7a inhibition inhibits LPS‑induced inflammatory injury of chondrocytes by targeting IL6R. Mol Med Rep. 2019;20(3):2633–2640.
- Zheng LW, Lan CN, Kong Y, et al. Exosomal miR-150 derived from BMSCs inhibits TNF-α-mediated osteoblast apoptosis in osteonecrosis of the femoral head by GREM1/NF-κB signaling. Regen Med. 2022;17(10):739–753.
- Song Y, Zeng S, Zheng G, et al. FOXO3a-driven miRNA signatures suppresses VEGF-A/NRP1 signaling and breast cancer metastasis. Oncogene. 2021;40(4):777–790.
- Xuan Y, Wang J, Zhang X, et al. Resveratrol attenuates high Glucose-Induced osteoblast dysfunction via AKT/GSK3β/FYN-Mediated NRF2 activation. Front Pharmacol. 2022;13:862618.
- Liu Y, Yuan J, Zhang Q, et al. Circ_0016347 modulates proliferation, migration, invasion, cell cycle, and apoptosis of osteosarcoma cells via the miR-661/IL6R axis. Autoimmunity. 2022;55(4):264–274.
- Ganta VC, Choi M, Farber CR, et al. Antiangiogenic VEGF(165)b regulates macrophage polarization via S100A8/S100A9 in peripheral artery disease. Circulation. 2019;139(2):226–242.
- Dong D, Zhang Y, He H, et al. Alpinetin inhibits macrophage infiltration and atherosclerosis by improving the thiol redox state: requirement of GSk3β/Fyn-dependent Nrf2 activation. Faseb j. 2022;36(4):e22261.
- Weng YS, Tseng HY, Chen YA, et al. MCT-1/miR-34a/IL-6/IL-6R signaling axis promotes EMT progression, cancer stemness and M2 macrophage polarization in triple-negative breast cancer. Mol Cancer. 2019;18(1):42.
- Oussa NA, Dahmani A, Gomis M, et al. VEGF requires the receptor NRP-1 to inhibit lipopolysaccharide-dependent dendritic cell maturation. J Immunol. 2016;197(10):3927–3935.
- Sarris M, Andersen KG, Randow F, et al. Neuropilin-1 expression on regulatory T cells enhances their interactions with dendritic cells during antigen recognition. Immunity. 2008;28(3):402–413.
- Stradner MH, Cheung KP, Lasorella A, et al. Id2 regulates hyporesponsive invariant natural killer T cells. Immunol Cell Biol. 2016;94(7):640–645.