
 ?Mathematical formulae have been encoded as MathML and are displayed in this HTML version using MathJax in order to improve their display. Uncheck the box to turn MathJax off. This feature requires Javascript. Click on a formula to zoom.
ABSTRACT
Laser surface texturing (LST) with different patterns was performed on silicon nitride (Si3N4) ceramic. Effect of patterns created by LST on coefficient of friction (COF) and surface damage under dry friction was investigated. Results indicated that fluctuation of COF decreased with the increasing loading force for both un-textured and textured samples. Under the same loading force, COF of Si3N4 ceramic with textured patterns was more stable than the samples with smoothly finished surface. The COF of textured samples was not always lower than that of un-textured samples. This may be caused by differences in the distribution of debris and the continuity of surface contact. The worn surface existed damages of plow and crack. However, peeling was observed on un-textured samples only. The surface damage of textured samples was slighter than un-textured samples. Especially under the high loading force, catastrophic damage appeared on the smooth surface. The worn surface of textured samples still maintained the similar state. This could be mainly due to the more complex friction process on the surface of textured sample. The wear rate of the frictional pair was also studied. The mechanisms of friction process for smooth and textured surface were analyzed.
1. Introduction
Silicon nitride (Si3N4) ceramic has been widely used in the fields of automotive, aerospace, electronics, and medical industries due to the excellent mechanical properties and chemical stability [Citation1–5]. The friction performance of materials is crucial for the mechanical reliability and service life of structural components. Although ceramic materials exhibit better friction performance as compared to traditional metal materials, it is still unable to meet the requirements in the rapid development of the manufacturing industry. Among many approaches to improve friction performance of Si3N4 ceramic, laser surface texturing (LST) has offered great potential with the advantages of strong adaptabilities to materials, low cost-consuming, and convenient [Citation6]. LST has been considered to be the ideally engineering approach to improve the surface properties of ceramic materials [Citation7,Citation8].
The friction performance of ceramic materials is mainly controlled by LST with diversified patterns. Joshi et al. [Citation9] performed dimples on Sialon ceramic by LST and investigated effect on the friction performance. Experimental results indicated that dimples with larger pitch were beneficial for decreasing coefficient of friction (COF). Xing et al. [Citation10] investigated effect of the linear texture and wavy texture on the friction performance of Si3N4/TiC ceramic. It was found that COF of the sample with wavy texture was lowest and the denser texture was conducive to obtain the lower COF. Jing et al. [Citation11] studied the friction performance of Al2O3 ceramic with square texture. This research confirmed that the stability of friction process was improved by introducing square texture by LST. In consideration of the friction process, which is affected by the contact state of sliding pairs, COF changes with the patterns on material surface. Even for the same type of patterns, COF also exists differently under different testing conditions. It indicates that the improvement of friction performance of materials has selectivity for patterns. Those previous studies reported on the friction performance of Si3N4 ceramic by LST are limited to the dimple patterns. Yamakiri et al. [Citation12] found that the function of dimple texture on trap debris was important for improving the friction performance. Yang et al. [Citation13] used laser with different pulse width to process dimple array and pointed out that COF of samples was close. It indicated that the friction performance was not significantly affected by pulse width. Yan et al. [Citation14] investigated effect of dimple arrays on the friction performance of Si3N4 ceramic under different lubrication environment. They found the friction performance was improved effectively under water lubrication, but the opposite effect presented under oil lubrication. Nowadays, for Si3N4 ceramic, there are few studies on multi-dimensional textures. They have been demonstrated to be effective patterns to improve the friction performance of materials, especially the triangular textures [Citation15–17] and hexagonal textures [Citation18–20]. Usually, there is no textured pattern applicable to all materials and the selection of textured patterns also varied in different application scenarios [Citation21]. For improving the friction performance, it is crucial to study the adaptability of Si3N4 ceramic to these multi-dimensional textures.
In addition to the choice of patterns, surface damage is another important aspect related to the friction process of materials. Serious surface damage of materials not only affects the service process, but also reduces lifespan. In this paper, COF of Si3N4 ceramic with different patterns by LST was investigated. Effect of different patterns on tribological behavior was studied, and surface damage and mechanism of friction process were analyzed. This study also provided references for the diverse applications of LST.
2. Experimental procedure
Si3N4 ceramic with a dimension of 15 mm × 20 mm × 5 mm (Shenzhen Hard Precision Ceramic Co., LTD., Shenzhen, China) fabricated by gas pressure sintering was used as the testing material. The sintering additive of Al2O3 was doped into Si3N4 ceramic to promote sintering. The apparent porosity was 0.02% measured by Archimedes method and the density was 3.20 g/cm3. As shown in , the Si3N4 material surface was polished with mirror finish before the application of LST. shows the schematic diagram of triangular patterns () and hexagonal patterns (), applied by LST in this study. The patterns of equilateral polygons are surrounded by the same areas of rectangle. LST patterns of Si3N4 ceramic were realized by a picosecond laser system (SLCU-11075I, Dongguan Strong Laser Advanced Equipment Co., Ltd., China) with pulse width of 10 ps, wavelength of 1064 nm, and repetition frequency of 100 kHz. The focus spot was 17 μm on machined surface and the processing parameters were laser power of 9 W, and scanning speed of 200 mm/s with the scanning times of 20. The depth of the groove in the pattern was about 50 μm. Before and after LST, all of Si3N4 samples were ultrasonic cleaned by alcohol for 20 min. The samples with un-textured patterns, triangular patterns, and hexagonal patterns were abbreviated as UP, TP, and HP, respectively.
Figure 1. SEM of the mirror-polished surface of Si3N4 ceramic: (a) Pore dispersion, (b) grain shape.
Figure 2. The schematic diagram of triangular patterns (a) and hexagonal patterns (b).
The reciprocating friction test was conducted on the ball-disk sliding friction machine (MDW-02, Jinan Yihua Tribology Testing Technology Co., LTD., Jinan, China) under dry friction. The YG6 cemented carbide (WC) ball with a diameter of 6 mm and hardness of 90 HRA was used as the frictional pair. The loading force was set as 5 N, 10 N, and 15 N for each textured pattern. The sliding distance was 6 mm at the frequency of 0.5 Hz and the sliding time was set at 30 min. Each sample was repeated three times under the same testing condition. The wear rate of WC ball can be calculated by the following formula:
where V is the wear volume of WC ball (mm3), F is the loading force (N), L is the sliding distance (m).
shows the schematic diagram of friction test. The morphology of samples after dry friction test was characterized by scanning electron microscopy (SEM, Verios G4 UC, Thermo Scientific, USA). The COF was recorded by the friction machine in real time. The elemental compositions were analyzed by energy dispersive spectroscopy (EDS) equipped with SEM.
Figure 3. The schematic diagram of friction test.
3. Results and discussion
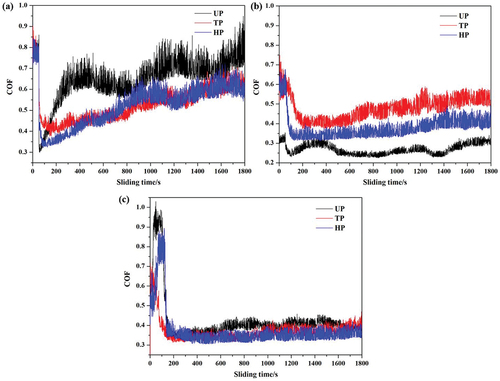
shows the COF value of Si3N4 ceramic with different LST patterns as a function of the sliding time under the different loading force. The results indicated that the fluctuation feature of COF was observed in all samples and the COF decreased with the increase in loading force. This was mainly due to the much closer contact between sample and frictional pair as the loading increased, resulting in the more stable COF. Under the same loading force, TP and HP were more conducive to obtain relatively less fluctuation in COF than UP. The lack of textured patterns on the UP led to the loading force directly applied to the entire material surface and also in close contact during the reciprocating friction. The formation of wear debris was generated in the contact areas, resulting in the more obvious fluctuation in COF. As for TP and HP with textured patterns, the generated debris could be accommodated in the grooves, thereby the fluctuation of COF was relatively reduced. The original sizes of the grooves were almost same due to the same processing parameters for LST apart from the diverse shapes. After the friction process, especially at the higher loading force, the differences in the sizes of the grooves between TP and HP were more obvious. These can be seen in the subsequent SEM images of worn tracks on samples with different patterns. At the loading force of 5 N (), COF increased significantly with the extension of sliding time for both TP and HP. Under the same testing condition, COF of UP was higher than that of TP and HP, which were relatively similar. However, COF of UP was lower than the patterned samples and COF of TP was highest at the loading force of 10 N (). The results indicated that COF of Si3N4 ceramic increased after LST. The similar phenomenon has been reported in previous study on Al2O3/TiC ceramic [Citation22]. LST has been also used to increase COF of metallic materials in needful situations [Citation23–25]. For Si3N4 ceramic employed in this study, discussions for the observed phenomena were presented in detail in the following sections. When the loading force increased to 15 N further (), COF of all samples exhibited the closest trend in comparison to the lower loads. It suggested that higher loading force on Si3N4 ceramic containing textured surface was beneficial for obtaining the lower COF.
Figure 4. COF value of Si3N4 ceramic with different LST patterns as a function of the sliding time under the different loading force: (a) 5 N, (b) 10 N, (c) 15 N.
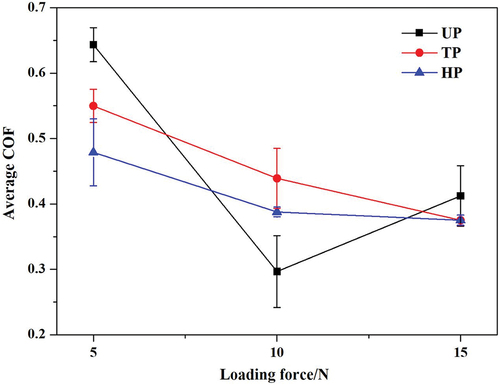
shows the average COF value as a function of the loading force plot. It can be observed that COF of UP was affected by the change of loading force most. COF of UP decreased first and then increased as the loading force increased. In contrast, COF of TP and HP presented a gradually decreasing and approaching trend. Apparently, COF of HP was less affected by the increasing loading force than that of TP. This might be attributed to the advantages of HP with more uniform distribution of patterns to improve the contact state and larger numbers of groove to store debris. HP was completely symmetrical in the direction of friction, so there was more space for debris to accommodate in the friction process. At the same time, another advantage of HP with the symmetrical structure was that the more uniform force, which was conducive to reduce the fluctuation. Therefore, a more stable COF could be obtained. In contrast, TP with an asymmetric distribution and had fewer grooves to accommodate debris, resulting in more change of COF under different loading force than that of HP. As for UP, the formed debris participated in the friction process all the time and then accumulated at the edge of sliding track due to the lack of textured patterns, so the change in COF was the most significant than that of TP and HP.
Figure 5. The average COF value as a function of the loading force plot.
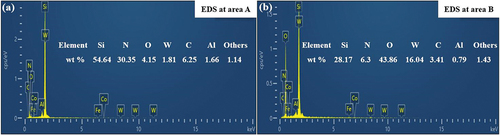
show SEM of worn surface under the different loading force of 5 N, 10 N and 15 N, respectively. Obvious differences existed at the worn areas between un-textured and textured samples. It can be observed that more significant plows existed on the UP () than TP () and HP () at the loading force of 5 N. The formation of plows was directly caused by the frictional pairs during the sliding process. There were also peelings and cracks at the worn area of UP (). The surface damages were significantly reduced on the textured samples under the same test conditions. No peelings were observed on TP and HP, and plows and cracks were much smaller than those on UP. However, as the loading force increased to 10 N, degrees of crack, peeling, and plow were weakened significantly for UP (). It indicated that the change of loading force had a remarkable impact on the surface integrity of material. For TP () and HP (), no cracks were observed, but fine debris appeared at the worn area. This phenomenon might be caused by the influence of the surface state on the distribution of debris. The generated debris were gathered at the edge of the friction trajectory of UP due to the lack of patterns to accommodate debris. For textured samples, it was easy to remove and cut some debris accumulated in the patterns and participated in the friction process. COF was usually influenced by multiple factors [Citation26] and more complex on the patterned surface of materials [Citation27]. In this study, COF increased as the result of the debris at some extents. In addition, the patterned samples led to the discontinuous contact between textured surface and frictional pair, resulting in the intermittent friction process as compared to the smooth samples without texture. This situation was significantly different from the friction process of patterned samples under lubrication which was accompanied by the presence of continuous films between the frictional pairs [Citation28]. These may be the reasons for COFs of TP and HP, which were higher than that of UP. It was not the same as the application of TP and HP on improving the friction performance of stainless steel [Citation29]. The results further confirmed the selectivity of materials toward textured patterns. Under the loading force of 15 N, surface of UP was severely damaged (). There were obvious damage features of cracks, plow, and peeling, and the surface was no longer flat with the warped fragments. It indicated that the smooth surface was not sufficient to resist the reciprocating friction under the high loading force. In contrast, textured samples with patterns exhibited significant advantages. These were reflected in lower COF and the better surface integrity of materials [Citation30]. The morphological characteristics of TP () and HP () were similar to the situation under lower loading force. It was mainly attributed to the buffering effect of patterns on the sliding process. The island contours of triangles and hexagons were incomplete, so the friction performance was affected by the change of force distribution between frictional pairs. For the textured samples, TP exhibited more obvious anisotropy in the friction process [Citation31] led to the more significant change of COF than that of HP. It was worth to note that the grooves of patterns were filled with debris. This was the important aspect of textured samples presented slighter surface damage [Citation10]. Textured patterns had a good effect on capturing debris to significantly reduce the impact on the surface of materials. In consideration of the different shape of the patterns, the sizes of the grooves changed during the friction process. At the lower loading force, the sizes of the grooves were closer between TP and HP. As the loading force increased, the differences in the sizes of the grooves were more obvious. The grooves of HP were wider than that of TP and the maximum size difference was approximately 10 μm at the loading force of 15 N. shows the EDS analysis at areas of HP under the loading force of 15 N. Area A highlighted was located in the location without patterns and was mainly composed of Si and N elements from Si3N4 ceramic (). The Al element came from the sintering aid of materials. There were small amount of W, C, and other metallic elements from the frictional pair at the sliding track. For Area B at the groove of pattern (), contents of Si, N and Al elements decreased, while the content of O element significantly increased. It was attributed to the decomposition and oxidation of Si3N4 ceramic material during LST. The formed slags of SiO2 were more susceptible to wear and accumulated in the grooves. These grooves not only contained slags of SiO2, as mentioned before, but also were filled with debris generated during the friction process. Therefore, the higher total contents of W and C elements were detected.
Figure 6. SEM of worn surface at the loading force of 5 N.
Figure 7. SEM of worn surface at the loading force of 10 N.
Figure 8. SEM of worn surface at the loading force of 15 N.
Figure 9. EDS analysis at area a and area B from HP under the loading force of 15 N in .
shows the wear rate of the WC ball under different loading force. The WC balls corresponding to UP, TP, HP are denoted as WU, WT and WH, respectively. It can be observed that the wear rate of WU exhibited the more obvious change than that of WT and WH. At the loading force of 5 N, the wear rate of WU was higher than WT and WH. The wear rates of WT and WH were close at the low loading force. As the loading force increased to 10 N, the wear rates of WT and WH increased and the former had the slightly higher wear rate. It was worth to mention that the wear rate of WU decreased and the value was lowest at this testing condition. The phenomenon was consistent with the change in the COF of UP. The wear rate of WU increased significantly as the loading force increased to 15 N. In comparison with WU, the wear rates of WT and WH were apparently lower and close. It indicated that textured samples were conducive to obtain the more stable frictional state and the better wear resistance at the higher loading force.
Figure 10. The wear rate of the WC ball under different loading force.
shows the schematic diagram, which illustrates the mechanism of friction process. For the un-textured sample (), material surface was in close contact with the frictional pair in continuous state. The generated debris was constantly rolling and gradually accumulated at the edge of the sliding track. This process was usually accompanied by the formation of surface damages with peeling, plow, and formation of crack. The friction process was more complex on the material surface after LST (). The textured patterns not only provided room to accommodate debris, but also cut them into finer pieces. Rolling still existed in the friction process, however, debris tended to accumulate within the patterns due to the capture effect. It was beneficial for reduce the surface damage of materials, so samples containing textured patterns were probably more suitable for applications under the high loading force. shows distribution of the friction force (F) on the textured samples. Here, the entire patterns were selected to analyze the differences in F between TP and HP. In the friction process, F on the surface of material was decomposed into the parallel force (FP) and vertical force (FV) when the loading force acted on the edge of TP (). The debris filled into the groove gradually under the action of FP. The resistance during the friction process mainly came from FV. Obviously, the distributions of FP and FV were reversed after passing TP led to the greater fluctuations in COF than that of HP. The friction force at edge of HP was composed of symmetrical FP/FV (). Although this was an ideal situation, the only presence of FP at the origin of HP was beneficial for reducing the debris on the sliding track. The smaller FV at the sliding track end of HP meant less resistance as compared to the same type of force in TP.
Figure 11. Schematic diagram of the mechanism of friction process: (a) Un-textured sample, (b) textured sample.
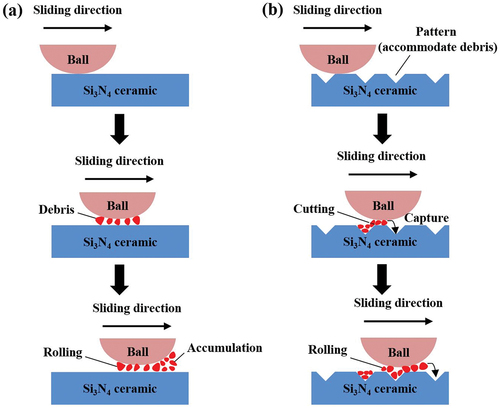
Figure 12. Distribution of friction force (F) and the surface area (S) on the textured samples: (a) TP, (b) HP.
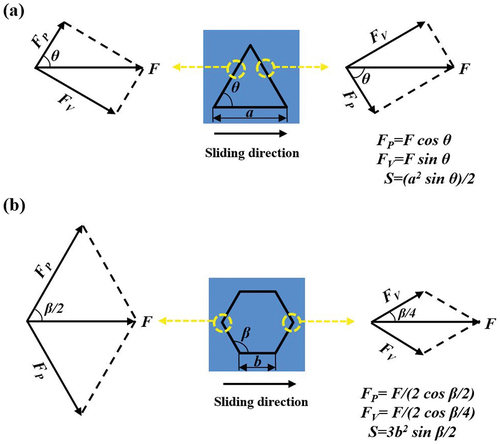
In addition to the friction force, the differences in contact surface between TP and HP were also the important factor affecting the friction performance of materials. For the entire pattern, the side length of HP (b) was half of the side length of TP (a). The angle of TP (θ) was half of the angle of HP (β). Therefore, the area of HP was larger than TP led to the differences in island area. The integrities of the island contours on TP and HP were damaged during the friction process. Especially under the high loading force, the incompleteness of the island contours on HP was more serious than TP. It indicated that the symmetrical and larger patterns were beneficial for HP to achieve the more stable friction process than TP in practical applications. At the same time, more grooves with the function to accommodate debris were distributed on HP. Therefore, for the textured sample, HP exhibited better friction performance than TP.
4. Conclusions
In the present study, different patterns on Si3N4 ceramic were performed by LST to investigate the effect on COF and surface damage under dry friction. It was observed that the increase of loading force and LST of Si3N4 ceramic were beneficial for obtaining the more stable COF. As the loading force increased, COFs of TP and HP gradually decreased and became more comparable. In contrast, COF of UP decreased and then increased. The distribution of debris on the worn track and discontinuous contact between textured surface and frictional pair may be the reasons for COFs of TP and HP, which were higher than that of UP at specific testing condition. For the textured samples, more uniform distribution of patterns on HP resulting less variation in COF of HP than that of TP. Results also showed that the textured samples of TP and HP presented slighter surface damage than UP. It was particularly evident under the high loading force. Under this high loading condition, the worn surface of UP suffered catastrophic damages, but HP and TP still kept the similar surface features. Results of EDS proved fillers in the groove of pattern was mainly composed of oxide slags and debris. The wear rate of frictional pair corresponding to the textured samples exhibited less fluctuations at different loading force than that of the un-textured samples. It indicated that the more stable frictional state and better wear resistance could be obtained by introducing textured patterns. The mechanisms of friction process were analyzed. For sample without patterns, the continuous state of friction, debris rolling, and accumulation at the edge of worn track were the main mechanisms. For the textured sample, the friction process was more complex. The debris could be accommodated in grooves at the friction trajectory and cut into finer pieces by the edge of patterns. Rolling was weakened in the friction process as a result of that more debris were captured by designed patterns. The structural characteristics of TP and HP directly led to the differences in decomposition of F. These were reflected in the distribution of debris and the fluctuation of COF. HP with the symmetrical structure was more beneficial to improve the friction performance as compared to TP.
Disclosure statement
No potential conflict of interest was reported by the author(s).
Additional information
Funding
References
- Khader I, Koplin C, Schröder C, et al. Characterization of a silicon nitride ceramic material for ceramic springs. J Eur Ceram Soc. 2020;40(10):3541–3554. doi: 10.1016/j.jeurceramsoc.2020.03.046
- Hu F, Xie ZP, Zhang J, et al. Promising high-thermal-conductivity substrate material for high-power electronic device: silicon nitride ceramics. Rare Met. 2020;39(5):463–478. doi: 10.1007/s12598-020-01376-7
- Ma Z, Xu XW, Huang XH, et al. Cutting performance and tool wear of SiAlON and TiC-whisker-reinforced Si3N4 ceramic tools in side milling inconel 718. Ceram Int. 2022;48(3):3096–3108. doi: 10.1016/j.ceramint.2021.10.084
- Rahaman M, Xiao W. Silicon nitride bioceramics in healthcare. Int J Appl Ceram Technol. 2018;15(4):861–872. doi: 10.1111/ijac.12836
- Li HQ, Chen W, Shi HX, et al. Basic bio-tribological performance of insulating Si3N4-based ceramic as human body replacement joints. Coating. 2021;11(8):938. doi: 10.3390/coatings11080938
- Wang HJ, Lin HT, Zhou F, et al. Friction and wear performances of Si3N4 ceramic matrix composites: a review from the perspectives of doped phase, layered structure design, and laser surface texturing. Int J Appl Ceram Tech. 2023;20(5):2661–2680. doi: 10.1111/ijac.14415
- Mao B, Siddaiah A, Liao Y, et al. Laser surface texturing and related techniques for enhancing tribological performance of engineering materials: a review. J Manuf Process. 2020;53:153–173. doi: 10.1016/j.jmapro.2020.02.009
- Zanet AD, Casalegno V, Salvo M. Laser surface texturing of ceramics and ceramic composite materials-a review. Ceram Int. 2021;47(6):7307–7320. doi: 10.1016/j.ceramint.2020.11.146
- Joshi B, Tripathi K, Gyawali G, et al. The effect of laser surface texturing on the tribological performance of different sialon ceramic phases. Prog Nat Sci: Mater Inter. 2016;26(4):415–421. doi: 10.1016/j.pnsc.2016.08.003
- Xing YQ, Deng JX, Feng XT, et al. Effect of laser surface texturing on Si3N4/TiC ceramic sliding against steel under dry friction. Mater Des. 2013;52:234–245. doi: 10.1016/j.matdes.2013.05.077
- Jing XB, Xia YN, Zheng SX, et al. Effect of surface modification on wettability and tribology by laser texturing in Al2O3. Appl Opt. 2021;60(15):4434–4442. doi: 10.1364/AO.423564
- Yamakiri H, Sasaki S, Kurita T, et al. Effects of laser surface texturing on friction behavior of silicon nitride under lubrication with water. Tribol Int. 2011;44(5):579–584. doi: 10.1016/j.triboint.2010.11.002
- Yang QB, Wu TY, Wang L, et al. Laser-induced gradient microstructures on Si3N4 ceramics and their wettability analysis. Mater Chem Phys. 2021;270:124749. doi: 10.1016/j.matchemphys.2021.124749
- Yan S, Wei CB, Zou HB, et al. Fabrication and tribological characterization of laser textured engineering ceramics: Si3N4, SiC and ZrO2. Ceram Int. 2021;47(10):13789–13805. doi: 10.1016/j.ceramint.2021.01.244
- Chen P, Xiang X, Shao TM, et al. Effect of triangular texture on the tribological performance of die steel with TiN coatings under lubricated sliding condition. Appl Surf Sci. 2016;389:361–368. doi: 10.1016/j.apsusc.2016.07.119
- Lu JJ, Wang TR, Ding XX, et al. Tribological performance of friction pairs with different materials and bi-composite surface texture configurations. Appl Sci. 2021;11(11):4738. doi: 10.3390/app11114738
- Hou QM, Yang XF, Li D, et al. Tribological performance of hydrophobic and micro/nano triangle textured rake face of cutting tools. Appl Surf Sci. 2022;571:151250. doi: 10.1016/j.apsusc.2021.151250
- Zhong YH, Zheng L, Gao YH, et al. Numerical simulation and experimental investigation of tribological performance on bionic hexagonal textured surface. Tribol Int. 2019;129:151–161. doi: 10.1016/j.triboint.2018.08.010
- Han YJ, Liu F, Zhang KD, et al. A study on tribological properties of textured Co-cr-mo alloy for artificial hip joints. Int J Refract Met H Mater. 2021;95:105463. doi: 10.1016/j.ijrmhm.2020.105463
- Wu F, Liu N, Ma YP, et al. Research on the influence of diamond coating microtexture on graphitization law and friction coefficient. Dia Relat Mater. 2022;127:109153. doi: 10.1016/j.diamond.2022.109153
- Qiu MF, Minson BR, Raeymaekers B. The effect of texture shape on the friction coefficient and stiffness of gas-lubricated parallel slider bearings. Tribol Inter. 2013;67:278–288. doi: 10.1016/j.triboint.2013.08.004
- Xing YQ, Deng JX, Wu Z, et al. High friction and low wear properties of laser-textured ceramic surface under dry friction. Opt Laser Technol. 2017;93:24–32. doi: 10.1016/j.optlastec.2017.01.032
- Schille J, Ullmann F, Schneider L, et al. Experimental study on laser surface texturing for friction coefficient enhancement. J Laser Micro/Nanoeng. 2015;10(3):245–253. doi: 10.2961/jlmn.2015.03.0002
- Dunn A, Carstensen JV, Wlodarczyk KL, et al. Nanosecond laser texturing for high friction applications. Opt Laser Eng. 2014;62:9–16. doi: 10.1016/j.optlaseng.2014.05.003
- Dunn A, Wlodarczyk KL, Carstensen JV, et al. Laser surface texturing for high friction contacts. Appl Surf Sci. 2015;357:2313–2319. doi: 10.1016/j.apsusc.2015.09.233
- Wang Z, Wang CW, Wang M, et al. Manipulation of tribological properties of stainless steel by picosecond laser texturing and quenching. Tribol Int. 2016;99:14–22. doi: 10.1016/j.triboint.2016.03.002
- Mao B, Siddaiah A, Menezes PL, et al. Surface texturing by indirect laser shock surface patterning for manipulated friction coefficient. J Mater Process Tech. 2018;257:227–233. doi: 10.1016/j.jmatprotec.2018.02.041
- Nikam MD, Shimpi D, Bhole K, et al. Design and development of surface texture for tribological application. Key Eng Mater. 2019;803:55–59. doi: 10.4028/www.scientific.net/KEM.803.55
- Chen P, Li JL, Li YL. Effect of geometric micro-groove texture patterns on tribological performance of stainless steel. J Cent South Univ. 2018;25:331–341.
- Zheng KR, Yang FZ, Pan MZ, et al. Effect of surface line/regular hexagonal texture on tribological performance of cemented carbide tool for machining Ti-6Al-4V alloys. Int J Adv Manuf Tech. 2021;116(9–10):3149–3162. doi: 10.1007/s00170-021-07636-9
- Xie Y, Li YJ, Wang YM, et al. An experimental investigation of tribological performance of triangular textures in water lubrication regime. Sci China Phys Mech Astron. 2014;57(2):273–279. doi: 10.1007/s11433-013-5254-7