
ABSTRACT
The rapid evolution of SARS-CoV-2 Omicron sublineages mandates a better understanding of viral replication and cross-neutralization among these sublineages. Here we used K18-hACE2 mice and primary human airway cultures to examine the viral fitness and antigenic relationship among Omicron sublineages. In both K18-hACE2 mice and human airway cultures, Omicron sublineages exhibited a replication order of BA.5 ≥ BA.2 ≥ BA.2.12.1 > BA.1; no difference in body weight loss was observed among different sublineage-infected mice. The BA.1-, BA.2-, BA.2.12.1-, and BA.5-infected mice developed distinguishable cross-neutralizations against Omicron sublineages, but exhibited little neutralization against the index virus (i.e. USA-WA1/2020) or the Delta variant. Surprisingly, the BA.5-infected mice developed higher neutralization activity against heterologous BA.2 and BA.2.12.1 than that against homologous BA.5; serum neutralizing titres did not always correlate with viral replication levels in infected animals. Our results revealed a distinct antigenic cartography of Omicron sublineages and support the bivalent vaccine approach.
Introduction
Since the identification of the first Omicron sublineage B.1.1.529/BA.1 of severe acute respiratory syndrome coronavirus 2 (SARS-CoV-2) in November 2021, several other Omicron sublineages have evolved, including BA.2, BA.2.12.1, BA.2.75, BA.3, BA.4, BA.4.6, BA.5, and BF.7. Among the early Omicron sublineages (BA.1-BA.5), some circulated at low frequencies (e.g. BA.3), most likely due to their low viral fitnesses; whereas others increased in prevalence (e.g. BA.1 and BA.5), competing with and displacing some of the previous lineages over time. After the initial BA.1 sublineage surge, the BA.2 sublineage, which was more transmissible [Citation1], became prevalent. Subsequently, derivatives of the BA.2 sublineage, such as BA.2.12.1, became predominant in the U.S. More recently, sublineages BA.4 and BA.5, which encode an identical spike (S) protein, have become prevalent and caused epidemics in different parts of the world [Citation2–4]. As of October 29, 2022 in the U.S., Omicron BA.2, BA.4, and BA.5 descendant sublineages are projected to account for 3.0%, 9.8%, and 87.0%, of the total COVID-19 cases, respectively (https://covid.cdc.gov/covid-data-tracker/#variant-proportions). During the revision of this paper on December 15, 2022, the newly emerged Omicron BQ.1 and BQ.1.1 have replaced BA.5, accounting for 31% and 37% of the total COVID-19 cases in the U.S., respectively. The selective evolution of new SARS-CoV-2 variant lineages is mainly driven by two forces: (i) evasion of immunity elicited from infection and/or vaccination and (ii) improved viral replication or transmission in the human host [Citation5–7]. Compared with all the previous variants of concern (i.e. Alpha, Beta, Gamma, and Delta), Omicron variants exhibited the greatest immune evasion [Citation8–14]. Among the early Omicron sublineages, BA.5 is least susceptible to antibody neutralization when tested against previous variant-infected convalescent sera or vaccinated sera [Citation9,Citation15,Citation16]. Compared with the index SARS-CoV-2 isolated in early 2020, the S proteins of different Omicron sublineages have accumulated more than 30 amino acid substitutions [Citation17]. Thus, for future vaccine development, it is important to understand (i) the antigenic relationship and (ii) the relative viral replication among different Omicron sublineages. In this study, we used a mouse model and primary human airway cultures to address these two important questions.
Results
Experimental rationale
For studying the antigenic relationship among different Omicron sublineages, it is challenging to obtain human sera from individuals who were infected with distinct Omicron sublineages without prior SARS-CoV-2 infection or vaccination. To overcome this challenge, we used a panel of sera collected from mice, which were infected with distinct Omicron sublineages, to examine their antigenic relationships. We infected K18-hACE2 mice with recombinant Omicron BA.1, BA.2, BA.2.12.1, or BA.5 (A). The selection of these four sublineages was based on their roles in causing Omicron waves after the initial BA.1 emergence. The mouse convalescent sera were examined for their neutralization titres against five Omicron sublineages (BA.1, BA.2, BA.2.12.1, BA.4.6, and BA.5), a Delta variant, and USA-WA1/2020, the reference index SARS-CoV-2. The resulting neutralization titres enabled the development of antigenic cartography to illustrate antigenic relationships among various Omicron sublineages. Additionally, we could also compare the viral replication of various Omicron sublineages in K18-hACE2 receptor transgenic mice and primary human airway epithelial (HAE) cultures. Furthermore, the K18-hACE2 mouse model data allow a comparison of pathogenicities among Omicron sublineages as well as to analyze the relationship between viral replication levels and neutralization activities.
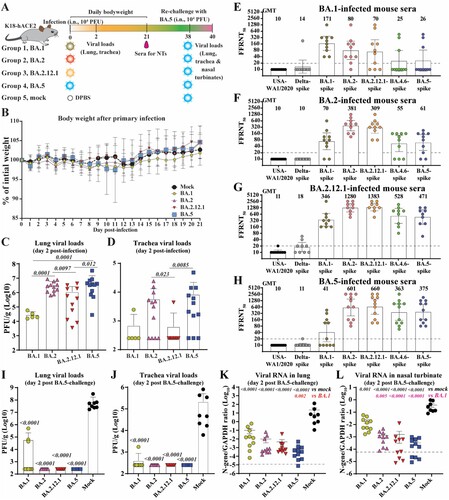
Figure 1. Cross-neutralization of SARS-CoV-2 variants elicited by BA.1, BA.2, BA.2.12.1, or BA.5 infection. (A) Experimental scheme. 8- to 10-week-old K18-hACE2 mice were infected via intra nasal (i.n.) route with infectious clone derived BA.1, BA.2, BA.2.12.1 or BA.5. On day 21 post-infection, mice sera were collected and cross-neutralization against SARS-CoV-2 variants was measured by FFRNT. On day 38 post-primary infection, all mice were rechallenged with BA.5. Two days after the challenge, mice were euthanized, and tissue viral loads were quantified. (B) Mouse body weight after primary infection. Daily body weight was normalized to the initial body weight. Data are presented as mean ± standard deviation (SD). (C) Lung viral loads after day 2 post-infection. (D) Trachea viral loads after day 2 post-infection. (E) FFRNT50s of BA.1-infected mouse sera. The dashed line indicates the limit of detection (1:20 dilution). The bar heights and the numbers above indicate geometric means of neutralizing titres (GMT). The whiskers indicate 95% CI. The Wilcoxon matched-pairs signed-rank test was performed for group comparison of GMTs. The p values between GMTs against BA.1-spike and USA-WA1/2020, Delta-spike, BA.2-spike, BA.2.12.1-spike, BA.4.6-spike and BA.5-spike are 0.002, 0.002, 0.082, 0.30, 0.049, 0.065, respectively. (F) FFRNT50s of BA.2-infected mouse sera. The p values between GMTs against BA.2-spike and USA-WA1/2020, Delta-spike, BA.1-spike, BA.2.12.1-spike, BA.4.6-spike and BA.5-spike are 0.002, 0.002, 0.002, 0.10, 0.002, 0.002, respectively. (G) FFRNT50s of BA.2.12.1-infected mouse sera. The p values between GMTs against BA.2.12.1-spike and USA-WA1/2020, Delta-spike, BA.1-spike, BA.2-spike, BA.4.6-spike and BA.5-spike are 0.004, 0.004, 0.008, 0.63, 0.016, 0.008, respectively. (H) FFRNT50s of BA.5-infected mouse sera. The p values between GMTs against BA.5-spike and USA-WA1/2020, Delta-spike, BA.1-spike, BA.2-spike, BA.2.12.1-spike, and BA.4.6-spike are 0.001, 0.001, 0.001, 0.004, 0.008, 0.84, respectively. (I) Lung viral loads at day 2 post-challenge. (J) Trachea viral loads at day 2 post-challenge. (K) Viral RNA in the lung on day 2 post-challenge. (L) Viral RNA in nasal turbinates at day 2 post-challenge. The dashed line in (K-L) shows the cutoff as determined from the uninfected mouse samples. Data in (C, D, I-L) show mean ± standard deviation (SD). p values shown as italic numbers in (C, D, I-L) were calculated using one-way ANOVA with Tukey’s multiple comparisons test. p < 0.05, statistically significant.
Viral replication in K18-hACE2 mice
We constructed infectious cDNA clones for four viruses representative of Omicron sublineages: BA.1 (GISAID EPI_ISL_6640916), BA.2 (GISAID EPI_ISL_11253924.1), BA.2.12.1 (GISAID EPI_ISL_12115772), or BA.5 (GISAID EPI_ISL_11542604). The Omicron recombinant viruses were prepared using a well-established protocol [Citation18,Citation19]. All four recombinant viruses were sequenced to ensure no undesired mutations. To compare viral replication and pathogenesis, we intranasally inoculated 8- to 10-week-old K18-hACE2 mice with 104 PFU of each of the four recombinant viruses (A). No significant weight loss was observed for most of the groups of mice (B), except one mouse from the BA.5 group lost >20% body weight on day 11 post-infection and had to be humanely euthanized following an approved IACUC protocol. Different viral loads were detected in the respiratory tracts for different sublineage groups. The infectious viral loads in the lungs were in the order of BA.5 (mean 5.8 × 10⁶ PFU/g) ≈ BA.2 (mean 3.3 × 10⁶ PFU/g) > BA.2.12.1 (mean 1.1 × 10⁶ PFU/g) > BA.1 (mean 2.9 × 10⁴ PFU/g) (C), while the viral loads in the trachea were in the order of BA.5 (mean 8.4 × 10⁴ PFU/g) > BA.2 (mean 5.8 × 10³ PFU/g) > BA.2.12.1 (mean 6.3 × 10² PFU/g) ≈ BA.1 (mean 6.9 × 10² PFU/g) (D). Thus, the rank order of viral replication efficiency in the K18-hACE2 model was in the order of BA.5 ≥ BA.2 > BA.2.12.1 ≥ BA.1.
Viral replication in primary human airway epithelial (HAE) cultures
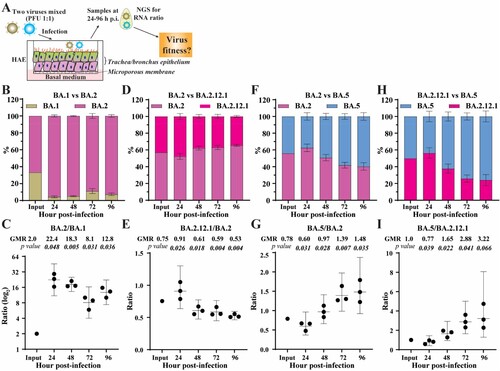
To substantiate the K18-hACE2 mouse results, we compared the replication kinetics of BA.1, BA.2, BA.2.12.1, and BA.5 on HAE culture. The HAE culture has been reliably used to study viral replication of SARS-CoV-2 variants, yielding results that recapitulate viral fitness in humans [Citation20]. Competition experiments were used to directly compare the replication kinetics of two sublineage viruses in HAE cultures (A). A mixture of two viruses was used to infect HAE cultures. The relative replication of the two viruses was quantified by next-generation sequencing of the viral RNA population collected on different days post-infection. This competition assay has been reliably used to compare viral replication between variant viruses [Citation21–24]. Our competition results showed that (i) BA.2 replicated more efficiently than BA.1 (B-C); (ii) BA.2 replicated slightly more efficiently than BA.2.12.1 (D-E); and (iii) BA.5 replicated more efficiently than BA.2 (F-G) and BA.2.12.1 (H-I). Overall, the HAE results suggest the viral replication efficiency in the order of BA.5 > BA.2 ≥ BA.2.12.1 > BA.1.
Figure 2. Competition of Omicron sublineages in HAE. (A) Diagram of competition experiment. Human airway epithelium was infected with a mixture of two viruses (equal PFU). At 24–96 h post-infection, extracellular viral RNA populations were determined by next-generation sequence (NGS). The viral RNA population in the inoculum measured by NGS was indicated as input. (B) The percentage of viral RNA in BA.1 and BA.2 infected HAE. (C) Scatter plot of the ratio of BA.2 to BA.1 RNA from infected HAE. (D) The percentage of viral RNA in BA.2 and BA.2.12.1 infected HAE. (E) Scatter plot of the ratio of BA.2.12.1 to BA.2 RNA from infected HAE. (F) The percentage of viral RNA in BA.2 and BA.5 infected HAE. (G) Scatter plot of the ratio of BA.5 to BA.2 RNA from infected HAE. (H) The percentage of viral RNA in BA.2.12.1 and BA.5 infected HAE. (I) Scatter plot of the ratio of BA.5 to BA.2.12.1 RNA from infected HAE. The mean ± standard deviations (SD) are shown in B, D, F, and H. The geometric ratio (GMR) and 95% confidence intervals (indicated as error bars) are shown in C, E, G, I. P values are calculated as the coefficient of each linear regression analysis of RNA ratio at a given time-point versus input RNA ratio.
Cross-neutralization between different Omicron sublineages
To examine cross-neutralization and antigenic relationships among different Omicron sublineages, we collected sera from BA.1-, BA.2-, BA.2.12.1-, or BA.5-infected K18-hACE2 mice on day 21 post-infection (A). Each serum was measured for neutralizing antibody titres against homologous and heterologous variant-spike viruses, including the four Omicron sublineages (BA.1, BA.2, BA.2.12.1, and BA.5), a recent Omicron sublineage (BA.4.6), the index USA-WA1/2020, and a Delta variant (E-H). To specifically study the impact of amino acid changes in the spike and increase the throughput of the neutralization assay, we engineered the full-length spike gene from each variant into the backbone of an attenuated USA-WA1/2020 that lacked open reading frame 7 (ORF7), an accessory gene that is not essential for viral replication in vitro but facilitates replication in vivo [Citation25,Citation26]. The ORF7 gene was replaced with the mNeon-Green (mNG) reporter gene [Citation19,Citation27]. The resulting variant-spike USA-WA1/2020 mNG viruses (Fig. S1A) were used for a fluorescent focus reduction neutralization test (FFRNT). The FFRNT assay has been proven reliable for high-throughput neutralization measurement [Citation28,Citation29].
The FFRNT results revealed distinct cross-neutralization profiles for BA.1- (E), BA.2.- (F), BA.2.12.1- (G), and BA.5-infected mouse convalescent sera (H). Three conclusions could be drawn from the cross-neutralization data. First, the cross-neutralization titres against various Omicron sublineages were significantly higher than those against USA-WA1/2020 or the Delta variant. The sera from BA.1-, BA.2.-, BA.2.12.1-, or BA.5-infected mice exhibited no or almost no neutralizing activities against the original USA-WA1/2020 or Delta variant, with FFRNT50s < 20 (E-H), indicating the antigenic divergence among these variants. Second, sera from different Omicron sublineage infections showed distinct neutralizing patterns against homologous and heterologous variant-spike SARS-CoV-2. BA.1-, BA.2.-, and BA.2.12.1-infected animals developed higher neutralizing titres against homologous variants than those against heterologous variants (E-G), illustrating that they are antigenically distinguishable from each other. In contrast, BA.5-infected mice developed higher neutralization titres against heterologous BA.2 and BA.2.12.1 variants than against the homologous BA.5 variant (H). Third, serum-neutralizing titres did not necessarily correlate with viral replication levels in the respiratory tracts of infected animals. This is exemplified by BA.2.12.1 which replicated less efficiently than BA.2 and BA.5 in both lungs and tracheas (C & D) but elicited higher neutralizing titres than the BA.2 and BA.5 viruses (Compare G with F & H). This result also suggests that BA.2.12.1 may be more immunogenic than BA.1, BA.2., and BA.5. The higher immunogenicity of BA.2.12.1 could be determined by mutations inside and/or outside the S gene.
Cross-protection of BA.1-, BA.2-, BA.2.12.1-, or BA.5-infected mice against Omicron BA.5 challenge
BA.5 SARS-CoV-2 was used to challenge K18-hACE2 mice that were immunized by infection with BA.1, BA.2, BA.2.12.1, or BA.5 variants for two reasons: (i) BA.5 was the most prevalent sublineage around the world at the time of the experiment and (ii) BA.5 was the least neutralized sublineage among the tested Omicron sublineages by the BA.1- and BA.2-infected mouse sera. On day 38 after the initial BA.1, BA.2, BA.2.12.1, or BA.5 infection/immunization, the mice were intranasally inoculated with 104 PFU of recombinant BA.5 SARS-CoV-2 (A). The mock-immunized group developed mean titres of 7.3 × 10⁷ PFU/g and 2.1 × 10⁵ PFU/g of infectious BA.5 SARS-CoV-2 on day 2 post-challenge in lungs (I) and tracheas (J), respectively. In contrast, only a few BA.1-immunized mice developed low titres of the infectious BA.5 virus in the lungs (I) and tracheas (J). No infectious viruses were detected in the respiratory tracts of the BA.2-, BA.2.12.1-, or BA.5-immunized animals after BA.5 challenge (I-J). To increase the detection sensitivity, we also performed quantitative RT–PCR to quantify the viral RNA in the respiratory tracts after the challenge. Compared with the mock-immunized group, the BA.1-, BA.2-, BA.2.12.1-, and BA.5-infected groups showed 223-, 2,253-, 4,816-, and 27,702-fold reduction of viral RNA in lungs ( K) and 21-, 290-, 242-, and 1,157-fold reduction in nasal turbinates (L), respectively, after the BA.5 challenge. The decreased levels of BA.5 RNA reversely correlated with the neutralizing titres against BA.5. Specifically, the BA.1- and BA.2-infected sera developed low neutralizing titres of 26 and 62, respectively; these mice developed high BA.5 RNA levels in the respiratory tract after challenge (K-L). In contrast, the BA.2.12.1- and BA.5-infected sera showed higher neutralization titres of 471 and 375, respectively; these mice developed lower BA.5 RNA levels in the respiratory tracts.
Antigenic analysis of neutralization titres against variant spikes
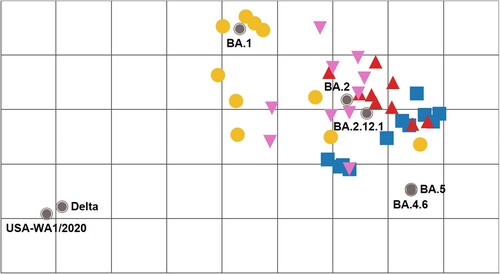
Using the neutralizing titre results in E-H, we created antigenic maps to visualize the relationships between sera collected from infected mice against SARS-CoV-2 variants and Omicron sublineages (). FFRNT50 titres were used to position the serum relative to each virus using antigenic cartography [Citation30]. Each antigenic gridline of the map corresponds to a 2-fold difference in the neutralization titre of a given virus. The cartography illustrated that mouse sera raised to Omicron sublineage variants are antigenically related, with the BA.2 reference being central to the group. Additionally, they formed a new antigenic cluster distinct from the index virus or Delta variant (>8-fold titre difference). BA.1-raised mouse antisera exhibited a diverse range in both homologous and heterologous FFRNT50 responses, with some sera showing BA.1 specific reactivity and others demonstrating further cross-reactivity to BA.2 and BA.2.12.1 viruses and limited cross-reactivity to BA.4.6 and BA.5 viruses. In contrast, BA.2- and BA.2.12.1-raised mouse antisera demonstrated broader neutralizing responses overall (≤8-fold reduction) to the Omicron sublineages tested. While BA.5-raised mouse antisera exhibited good cross-reactivity to BA.2, BA.2.12.1, and BA.4.6 viruses, they had reduced reactivity to BA.1 virus.
Figure 3. Antigenic cartography of SARS-CoV-2 FFRNT50 data using mouse anti-sera. The antigenic map was prepared according to serum FFRNT50 values against mNG reporter SARS-CoV-2 spike variants. The FFRNT50 values are presented in E-H. SARS-CoV-2 variants (grey, filled circle icons) are labelled by name or Pango lineage. Individual mouse antisera are colour-coded based on the viral inoculum: BA.1 (gold circles), BA.2 (pink triangles), BA.2.12.1 (red triangles), and BA.5 (blue squares). Grid increments indicate a two-fold reduction in FFRNT50 titre between two icons. Thus, two grids correspond to 4-fold dilution, three to 8-fold dilution, and so on.
Discussions
For any emerging SARS-CoV-2 variant, it is important to monitor their viral transmissibility, disease severity, and immune evasion. A systematic analysis of the anti-genic relationship among variants provides the scientific basis for future vaccine design. We previously showed distinct cross-neutralization and protection among Alpha, Beta, Gamma, Delta, Epsilon, and Omicron BA.1 variants [Citation28]. The current study extends the cross-neutralization analysis to the recently emerged Omicron sublineages, including BA.1, BA.2, BA.2.12.1, BA.4.6, and BA.5. Our antigenic cartography shows that all Omicron sublineages to date are antigenically related to each other and clearly form a new cluster/group from the variants that caused previous global epidemics (i.e. index, Alpha, Delta). The antigenic distance between the index virus and the currently prevalent Omicron BA.5 supports the recommendation for bivalent vaccines containing Omicron variants and suggests that BA.5 should increase the breadth of immunity, particularly against descendent lineages or BA.2. The results are in agreement with the phylogenetic tree of variants and sublineages (Fig. S1B). Indeed, preliminary clinical results showed that, compared with the original mRNA vaccine, the BA.5-modified bivalent booster elicited more robust neutralization against BA.5 virus[Citation31,Citation32]
For viral replication, the K18-hACE2 mouse data and HAE results consistently suggest the viral fitness in the order of BA.5 ≥ BA.2 ≥ BA.2.12.1 > BA.1. However, no significant difference in weight loss was observed among different sublineage-infected mice. These results indicate that, compared with the initial BA.1, BA.5 has increased viral fitness without increasing disease severity. Our results are in agreement with the clinical observations that (i) BA.1- and BA.5-infected patients develop similar disease severity and (ii) Omicron causes less severe disease than the previous Delta variant [Citation33]. The reduced disease severity of Omicron infection may be caused by the lower cell-to-cell fusion activity mediated by the Omicron S protein [Citation34,Citation35]. Thus, the increased viral fitness and immune evasion of BA.5 may account for its dominance over other Omicron sublineages in circulation.
Our study has four limitations. First, we have not defined the mutations that determine the differences in viral fitness and/or immune evasion among different Omicron sublineages. These determinants are most likely within the S gene; however, mutations outside the S gene may also contribute to the observed differences. Second, we have not analyzed cell-mediated immunity or non-neutralizing antibodies. These two immune components, together with neutralizing antibodies, protect patients from severe disease and death [Citation36]. Fortunately, after natural infection or vaccination, T cell epitopes are highly preserved in Omicron and other variant S proteins [Citation37]. Third, we used infectious clone-derived recombinant Omicron viruses, rather than clinical isolate viruses. Recombinant viruses are more homogeneous than clinical isolate viruses; different homogeneity of viral population may lead to different phenotypes. Fourth, our study has not included the more recently emerged Omicron sublineages, such as BQ.1, BQ.1.1, and XBB.1, which have been shown to be more immune-evasive than the previous BA.5 sublineage [Citation31,Citation32] Despite the limitations of this study, laboratory investigations, together with real-world vaccine effectiveness results, will continue to guide vaccine strategy and mitigate the public health impact of future variants.
Method
Ethics statement
Mouse studies were performed following the guidelines for the Care and Use of Laboratory Animals of the University of Texas Medical Branch (UTMB). The protocol (IACUC#: 2103023) was approved by the Institutional Animal Care and Use Committee (IACUC) at UTMB. All the animal operations were performed under anesthesia by isoflurane to minimize animal suffering. All SARS-CoV-2 infections were performed at the BSL-3 facility at UTMB by personnel equipped with powered air-purifying respirators.
Cells and animals
African green monkey kidney epithelial Vero-E6 cells (laboratory-passaged derivatives from ATCC CRL-1586) were grown in Dulbecco’s modified Eagle’s medium (DMEM; Gibco/Thermo Fisher, Waltham, MA, USA) with 10% fetal bovine serum (FBS; HyClone Laboratories, South Logan, UT) and 1% antibiotic/streptomycin (P/S, Gibco). Vero-E6-TMPRSS2 cells were purchased from SEKISUI XenoTech, LLC (Kansas City, KS) and maintained in 10% fetal bovine serum (FBS; HyClone Laboratories, South Logan, UT) and 1% P/S and 1 mg/ml G418 (Gibco). The primary human airway epithelium (HAE) and medium for culturing HAE were purchased from MatTek Life Science (Ashland, MA, USA). All cells were maintained at 37°C with 5% CO2. All cell lines were verified and tested negative for mycoplasma. K18-hACE2 c57BL/6J mice (strain: 2B6.Cg-Tg(K18-ACE2)2Prlmn/J) mice were purchased from the Jackson Laboratory (Bar Harbor, ME). Upon arrival at the ABSL-3 facilities at UTMB, animals were randomized and housed in groups of < 5 per cage in rooms maintained between 68–74°F with 30%–60% humidity and day/night cycles of 12 h intervals (on 6 AM-6 PM). Mice were fed standard chow diets. Female mice aged 8–10 weeks were used for this study.
Construction of recombinant SARS-CoV-2
The infectious cDNA clones of Omicron sublineages were constructed through mutagenesis of a previously reported cDNA clone of USA-WA1/2020 SARS-CoV-2 [Citation18–20]. The Omicron sublineages BA.1 (GISAID EPI_ISL_6640916), BA.2 (GISAID EPI_ISL_11253924.1), BA.2.12.1 (GISAID EPI_ISL_12115772), and BA.5 (GISAID EPI_ISL_11542604) were used as the reference sequences for constructing the infectious cDNA clones. Omicron sublineage BA.1-, BA.2-, BA.2.12.1-, BA.5-spike and Delta-spike mNG SARS-CoV-2s constructed by engineering the complete spike gene from the indicated variants into an infectious cDNA clone of mNG USA-WA1/2020 were reported previously [Citation9,Citation19]. BA.4.6-spike mNG SARS-CoV-2 (GISAID EPI_ISL_15380489) was constructed using the same approach. Supplementary Figure 1 illustrates the spike mutations of Omicron sub-lineages in this study.
The full-length cDNA was assembled via in vitro ligation and used as a template for in vitro transcription. The full-length viral RNA was then electroporated into Vero E6-TMPRSS2 cells. On day 2–4 post electroporation, the original P0 virus was harvested from the electroporated cells and propagated for another round on Vero E6 cells to produce the P1 virus. The infectious titre of the P1 virus was quantified by plaque assay on VeroE6-TMPRSS2 cells (recombinant SARS-CoV-2) or by fluorescent focus assay on Vero E6 cells (recombinant SARS-CoV-2 mNG). The P1 viruses were sequenced to ensure no undesired mutations. The P1 virus was used for all the experiments performed in this study.
RNA extraction and Sanger sequencing
Culture supernatants were mixed with a five-fold volume of TRIzol™ LS Reagent (Ther-moFisher Scientific). Viral RNAs were extracted by using the Direct-zol-96 MagBead RNA kit (ZYMO RESEARCH) in the KingFisher Apex instrument (ThermoFisher Scientific) according to the manufacturer’s instructions. The extracted RNAs were eluted in 50 μl nuclease-free water. The cDNA fragments spanning the genome were amplified using SuperScript™ IV One-Step RT–PCR System (ThermoFisher Scientific, Waltham, MA) according to a previously reported protocol [Citation18,Citation19]. The resulting fragments were gel purified and sent for Sanger sequencing at GENEWIZ.
Mouse study
8-10-week-old female K18-hACE2 mice were infected intranasally (i.n.) with infectious cDNA clone derived SARS-CoV-2 BA.1, BA.2, BA.2.12.1 and BA.5 (104 PFU, diluted in 25 μl DPBS). DBPS-inoculated animals were used as controls. On day 2 post-infection, lung (cranial lobe) and trachea samples were collected from a subset of euthanized animals. The animals were monitored for signs of disease and weighed daily for 21 days after the primary infection. On day 21 post-infection, animals were anesthetized, and blood samples were collected retro-orbitally. Sera were isolated and stored at −80°C before use. On day 38 post-infection, all animals were re-challenged with infectious cDNA clone-derived BA.5 (104 PFU, diluted in 25 μl DPBS). Two days after the challenge, all animals were euthanized. Mouse lung cranial lobes and tracheas were harvested in 2-ml tubes that were prefilled with 1 ml DPBS; the other lobes of the right lung and nasal turbinates were kept in 2-ml tubes that were prefilled with 500 µl Trizol reagent (ThermoFisher Scientific). All samples were stored at −80°C before analysis. Tissue samples were homogenized for 60 s using MagNA Lyser (Roche) with settings of 6000 rpm and clarified by centrifugation at 12,000 g for 5 min before being used for plaque assay and RNA extraction.
Plaque assay
Approximately 1.0 × 10⁶ Vero E6-TMPRSS2 cells were seeded to each well of 6-well plates and cultured at 37 °C, 5% CO2 for 16 h. Virus samples were serially diluted in DMEM with 2% FBS and 200 μl diluted viruses were transferred onto the cell monolayers. The viruses were incubated in the cells at 37 °C with 5%CO2 for 1 h. After the incubation, the inoculum was removed. Two ml of overlay medium containing DMEM with 2%FBS, 1% penicillin/streptomycin, and 1% Seaplaque agarose (Lonza, Walkersville, MD) were added to each well of the infected cells. After incubation at 37°C with 5% CO2 for 2 days, the cells were stained by adding 2 ml of overlay medium supplemented with neutral red (Sigma-Aldrich, St. Louis, MO). Plaques were counted on a lightbox.
Quantitative real-time RT–PCR
RNA copies of SARS-CoV-2 samples and the mouse housekeeping gene GAPDH were determined by quantitative real-time RT–PCR (RT-qPCR) by using the iTaq SYBR Green One-Step Kit (Bio-Rad) on the QuantStudio™ 7 Flex system (ThermoFisher Scientific) with the following settings: (1) 50°C, 10 min; 95°C, 5 min; (2) 95°C, 15 s; 60°C, 30 s; 40 cycles; (3) 95°C, 15 s; 60°C to 95°C, increment 0.5°C, 0.05 s. The primer pairs for the SARS-CoV-2 N gene and mouse GAPDH gene are the following: 2019-nCoV_N2-F (5’-TTACAAACATTGGCCGCAAA-3’) and 2019-nCoV_N2-R (5’-GCGCGACATTCCGAAGAA-3’); M_GAPDH-F (5’-AGGTCGGTGTGAACGGATTTG-3’) and M_GAPDH-R(5’-TGTAGACCATGTAGTTGAGGTCA-3’). The relative viral RNA levels (N-gene to GAPDH ratio) were obtained by normalizing the CT values of the N gene to those of the GAPDH in each sample. The cutoff of the N-gene to GAPDH ratio was calculated as the mean plus two times of standard deviation from uninfected mouse samples. The log10 values of the cutoffs of N-gene/GAPDH in the lungs and turbinates are −4.92 and −4.18, respectively.
Fluorescent focus reduction neutralization test
A fluorescent focus reduction neutralization test (FFRNT) was performed to measure the neutralization titres of sera against USA-WA1/2020, Delta-spike, BA.1-, BA.2-, BA.2.12.1-, BA.4.6-, and BA.5-spike mNG SARS-CoV-2. The FFRNT protocol was reported previously (Zou et al., 2022b). Vero E6 cells were seeded onto 96-well plates with 2.5 × 10⁴ cells per well (Greiner Bio-one™) and incubated overnight. On the next day, mouse sera were heat-inactivated at 56°C for 30 min before assay. Each serum was 2-fold serially diluted in a culture medium and mixed with 100–150 focus-forming units of mNG SARS-CoV-2. The final serum dilution ranged from 1:20–1:20,480. After incubation at 37°C for 1 h, the serum-virus mixtures were loaded onto the pre-seeded Vero E6 cell monolayer in 96-well plates. After 1 h infection, the inoculum was removed and 100 μl of overlay medium containing 0.8% methylcellulose was added to each well. After incubating the plates at 37°C for 16 h, raw images of mNG foci were acquired using CytationTM 7 (BioTek) armed with 2.5× FL Zeiss objective with a wide field of view and processed using the software settings (GFP [469,525] threshold 4000, object selection size 50–1000 µm). The fluorescent mNG foci were counted in each well and normalized to the non-serum-treated controls to calculate the relative infectivities. The FFRNT50 value was defined as the minimal serum dilution to suppress >50% of fluorescent foci. The neutralization titre of each serum was determined in duplicate assays, and the geometric mean was taken.
Antigenic cartography
FFRNT50 titre responses were transformed into a two-dimensional (2D) antigenic map over 1000 iterations with the ACMACS-API software suite (version acmacs-c2-20161026-0717 and i19 build host) [Citation30]. Output data matrices with FFRNT50 trends mapped to 2D X/Y coordinates were rendered into antigenic landscapes and annotated in Tableau Desktop (version 2021.1.1). All applied code sets are available from the authors upon request.
Competition experiment
For the competition on HAE, two viruses were mixed with equal PFU based on the titres as determined on VeroE6-TMPRSS2 cells. The inoculum was prepared in DPBS with 20% culture medium containing virus mixture at a final concentration of 1 × 10⁶ PFU/ml. An aliquot of the inoculum was also stored for determining the ratio of input viruses. Before infection, the HAE culture was incubated in 300 µl of DPBS per well at 37°C. After removing the DPBS, 200 µl of inoculum per well was added to each HAE well at the apical side. After 2 h-incubation at 37°C 5% CO2, the inoculum was removed, and cells were washed with DPBS three times to remove unbound viruses. At each sample collection time point, 300 µl of DPBS was added to each well at the apical side, and cells were incubated at 37°C 5% CO2 for 30 min. The DPBS washes containing viruses were then harvested into 2-ml tubes. All samples were stored in a −80°C freezer before use.
Upon analysis, samples were thawed at room temperature. 100 µl of each sample was used for Trizol LS extraction using the protocol described above. The cDNA fragment (corresponding to codon positions 411–479 of BA.1 spike) containing the unique mutations of each variant was amplified using SuperScript™ IV One-Step RT–PCR System with primer pairs: BA.1-2-4-F(5’-CAAACTGGAAATATTGCTGA-3’) and BA.1-2-4R (5’-CCATTACAAGGTTTGTTACC-3’). The amplicons were then gel-purified and sent for Illumina next-generation sequencing (NGS) at the sequencing core facility at UTMB.
Statistical analysis
Numeric data are presented as means ± standard deviations or geometric mean ± 95% confident intervals as indicated in each figure panel. Data in C-D and I-L were initially log-transformed (base-10) to increase the normal distribution and one-way ANOVA with Tukey’s multiple comparisons test was applied to assess the statistical significance between each group. The Wilcoxon matched-pairs signed-rank test was performed for group comparison of GMTs of mouse serum in E-H. Simple linear regression was performed to analyze the statistical significance of the RNA ratio at a given time-point versus the input RNA ratio for the competition experiment in . All statistical analysis was performed using the software Prism 9 (GraphPad).
Author contributions
Conceptualization, X.X., P.-Y.S.; Methodology, H.X., J.Y., B.K., C.B., J.C., C.K., J.Z., S.G.W., B.R.M., R.K., C.T.D., B.Z., D.E.W., X.X., P.-Y.S; Investigation, H.X., J.Y., B.K., C.B., J.C., C.K., J.Z., S.G.W., B.R.M., R.K., C.T.D., B.Z., D.E.W., X.X., P.-Y.S; Resources, X.X., P.-Y.S; Data Curation, CDC colleagues, X.X.; Writing-Original Draft, B.R.M., R.K., D.E.W., X.X., P.-Y.S; Writing-Review & Editing, R.K., D.E.W., X.X., P.-Y.S.; Supervision, H.X., B.K.K, R.K., D.E.W., X.X., P.-Y.S.; Funding Acquisition, P.-Y.S.
Competing interests
X.X. and P.-Y.S. have filed a patent on the reverse genetic system. X.X., J.Z., and P.-Y.S. received compensation from Pfizer for COVID-19 vaccine development. Other authors declare no competing interests.
Supplementary_Figure_1.docx
Download MS Word (308.3 KB)Acknowledgments
We thank colleagues at the University of Texas Medical Branch (UTMB) for helpful discussions and Samuel S. Shepard and Reina Chau for their contributions in operationalizing ACMACS for high-throughput and portable usage. This research was partly funded by the Centers for Disease Control and Prevention. J.C. was supported by a T32 Biodefense Training Program Grant T32AI060549. P.Y.S. was supported by NIH contract HHSN272201600013C, and awards from the Sealy & Smith Foundation, the Kleberg Foundation, the John S. Dunn Foundation, the Amon G. Carter Foundation, the Summerfield Robert Foundation, and Edith and Robert Zinn. SSS is affiliated with the Centers for Disease Control and Prevention (CDC). RC is a CDC contractor with General Dynamics Information Technologies, Inc. Use of trade names is for identification only and does not imply endorsement by the US Centers for Disease Control and Prevention or the US Department of Health and Human Services. The findings and conclusions in this report are those of the authors and do not necessarily represent the official position of the US Centers for Disease Control and Prevention.
Disclosure statement
No potential conflict of interest was reported by the author(s).
Additional information
Funding
References
- Stegger M, Edslev SM, Sieber RN, et al. Occurrence and significance of Omicron BA.1 infection followed by BA.2 reinfection. medRxiv. 2022. doi:10.1101/2022.02.19.22271112.
- Cao Y, Yisimayi A, Jian F, et al. BA.2.12.1, BA.4 and BA.5 escape antibodies elicited by Omicron infection. Nature. 2022 Aug;608(7923):593–602.
- Hachmann NP, Miller J, Collier AY, et al. Neutralization escape by SARS-CoV-2 Omicron subvariants BA.2.12.1, BA.4, and BA.5. N Engl J Med. 2022 Jul 7;387(1):86–88.
- Qu P, Faraone J, Evans JP, et al. Neutralization of the SARS-CoV-2 Omicron BA.4/5 and BA.2.12.1 subvariants. N Engl J Med. 2022 Jun 30;386(26):2526–2528.
- Lyngse FP, Kirkeby CT, Denwood M, et al. Transmission of SARS-CoV-2 Omicron VOC subvariants BA.1 and BA.2: evidence from danish households. BioRxiv. 2022. doi:10.1101/2022.01.28.22270044.
- Liu Y, Liu J, Shi PY. SARS-CoV-2 variants and vaccination. Zoonoses. 2022. doi:10.15212/ZOONOSES-2022-0001.
- Cele S, Jackson L, Khoury DS, et al. Omicron extensively but incompletely escapes Pfizer BNT162b2 neutralization. Nature. 2022;602:654–656.
- Evans JP, Zeng C, Carlin C, et al. Neutralizing antibody responses elicited by SARS-CoV-2 mRNA vaccination wane over time and are boosted by breakthrough infection. Sci Transl Med. 2022 Mar 23;14(637):eabn8057.
- Kurhade C, Zou J, Xia H, et al. Neutralization of Omicron sublineages and Deltacron SARS-CoV-2 by 3 doses of BNT162b2 vaccine or BA.1 infection. Emerg Microbes Infect. 2022 Dec;11(1):1828–1832.
- Liu J, Liu Y, Xia H, et al. BNT162b2-elicited neutralization of B.1.617 and other SARS-CoV-2 variants. Nature. 2021;596:273–275.
- Liu Y, Liu J, Xia H, et al. Neutralizing activity of BNT162b2-elicited serum. N Engl J Med. 2021 Apr 15;384(15):1466–1468.
- Liu Y, Liu J, Xia H, et al. BNT162b2-Elicited neutralization against new SARS-CoV-2 spike variants. N Engl J Med. 2021 Jul 29;385(5):472–474.
- Wang L, Kainulainen MH, Jiang N, et al. Differential neutralization and inhibition of SARS-CoV-2 variants by antibodies elicited by COVID-19 mRNA vaccines. Nat Commun. 2022 Jul 27;13(1):4350.
- Kurhade C, Zou J, Xia H, et al. Neutralization of Omicron BA.1, BA.2, and BA.3 SARS-CoV-2 by 3 doses of BNT162b2 vaccine. Nat Commun. 2022 Jun 23;13(1):3602.
- Xie X, Zou J, Kurhade C, et al. Neutralization of SARS-CoV-2 Omicron sublineages by 4 doses of the original mRNA vaccine. Cell Rep. 2022 Nov 29;41(9):111729.
- Zou J, Xia H, Xie X, et al. Neutralization against Omicron SARS-CoV-2 from previous non-Omicron infection. Nat Commun. 2022 Feb 9;13(1):852.
- Viana R, Moyo S, Amoako DG, et al. Rapid epidemic expansion of the SARS-CoV-2 Omicron variant in Southern Africa. Nature. 2022 Mar;603(7902):679–686.
- Xie X, Lokugamage KG, Zhang X, et al. Engineering SARS-CoV-2 using a reverse genetic system. Nat Protoc. 2021;16(3):1761–1784.
- Xie X, Muruato A, Lokugamage KG, et al. An infectious cDNA clone of SARS-CoV-2. Cell Host Microbe. 2020 May 13;27(5):841–848 e3.
- Liu Y, Liu J, Johnson BA, et al. Delta spike P681R mutation enhances SARS-CoV-2 fitness over Alpha variant. Cell Rep. 2022 May 17;39(7):110829.
- Liu J, Liu Y, Shan C, et al. Role of mutational reversions and fitness restoration in Zika virus spread to the americas. Nat Commun. 2021 Jan 26;12(1):595.
- Liu Y, Liu J, Plante KS, et al. The N501Y spike substitution enhances SARS-CoV-2 infection and transmission. Nature. 2022;602:294–299.
- Plante JA, Liu Y, Liu J, et al. Spike mutation D614G alters SARS-CoV-2 fitness. Nature. 2021;592:116–121.
- Shan C, Xia H, Haller SL, et al. A Zika virus envelope mutation preceding the 2015 epidemic enhances virulence and fitness for transmission. Proc Natl Acad Sci U S A. 2020 Aug 18;117(33):20190–20197.
- Johnson BA, Zhou Y, Lokugamage KG, et al. Nucleocapsid mutations in SARS-CoV-2 augment replication and pathogenesis. PLoS Pathog. 2022 Jun;18(6):e1010627.
- Liu Y, Zhang X, Liu J, et al. A live-attenuated SARS-CoV-2 vaccine candidate with accessory protein deletions. Nat Commun. 2022 Jul 27;13(1):4337.
- Muruato AE, Fontes-Garfias CR, Ren P, et al. A high-throughput neutralizing antibody assay for COVID-19 diagnosis and vaccine evaluation. Nat Commun. 2020 Aug 13;11(1):4059.
- Liu Y, Liu J, Zou J, et al. Cross-neutralization and cross-protection among SARS-CoV-2 viruses bearing different variant spikes. Signal Transduct Target Ther. 2022 Aug 13;7(1):285.
- Zou J, Kurhade C, Xia H, et al. Cross-neutralization of Omicron BA.1 against BA.2 and BA.3 SARS-CoV-2. Nat Commun. 2022 May 26;13(1):2956.
- Smith DJ, Lapedes AS, de Jong JC, et al. Mapping the antigenic and genetic evolution of influenza virus. Science. 2004 Jul 16;305(5682):371–376.
- Kurhade C, Zou J, Xia H, et al. Low neutralization of SARS-CoV-2 Omicron BA.2.75.2, BQ.1.1, and XBB.1 by parental mRNA vaccine or a BA.5-bivalent booster. Nat Med. 2022: 2022/12/06.
- Zou J, Kurhade C, Patel S, et al. Improved neutralization of Omicron BA.4/5, BA.4.6, BA.2.75.2, BQ.1.1, and XBB.1 with bivalent BA.4/5 vaccine. bioRxiv. 2022: 2022.11.17.516898.
- Wolter N, Jassat W, Walaza S, et al. Clinical severity of SARS-CoV-2 omicron BA.4 and BA.5 lineages compared to BA.1 and Delta in South Africa. Nat Commun. 2022 Oct 4;13(1):5860.
- Du X, Tang H, Gao L, et al. Omicron adopts a different strategy from Delta and other variants to adapt to host. Signal Transduct Target Ther. 2022 Feb 10;7(1):45.
- Meng B, Abdullahi A, Ferreira I, et al. Altered TMPRSS2 usage by SARS-CoV-2 Omicron impacts tropism and fusogenicity. Nature. 2022;603:706–714.
- Barouch DH. Covid-19 vaccines - immunity, variants, boosters. N Engl J Med. 2022 Sep 15;387(11):1011–1020.
- Redd AD, Nardin A, Kared H, et al. Minimal crossover between mutations associated with Omicron variant of SARS-CoV-2 and CD8(+) T-cell epitopes identified in COVID-19 convalescent individuals. mBio. 2022 Apr 26;13(2):e0361721.