
ABSTRACT
Multiple clinical and epidemiological studies have shown an interconnection between coronavirus disease 2019 (COVID-19) and diabetes, but experimental evidence is still lacking. Understanding the interplay between them is important because of the global health burden of COVID-19 and diabetes. We found that C57BL/6J mice were susceptible to the alpha strain of SARS-CoV-2. Moreover, diabetic C57BL/6J mice with leptin receptor gene deficiency (db/db mice) showed a higher viral load in the throat and lung and slower virus clearance in the throat after infection than C57BL/6J mice. Histological and multifactor analysis revealed more advanced pulmonary injury and serum inflammation in SARS-CoV-2 infected diabetic mice. Moreover, SARS-CoV-2 infected diabetic mice exhibited more severe insulin resistance and islet cell loss than uninfected diabetic mice. By RNA sequencing analysis, we found that diabetes may reduce the collagen level, suppress the immune response and aggravate inflammation in the lung after infection, which may account for the greater susceptibility of diabetic mice and their more severe lung damage after infection. In summary, we successfully established a SARS-CoV-2 infected diabetic mice model and demonstrated that diabetes and COVID-19 were risk factors for one another.
Introduction
Severe acute respiratory syndrome coronavirus-2 (SARS-CoV-2), the pathogenic agent of coronavirus disease 2019 (COVID-19), was first reported in Wuhan, China, in December 2019. The WHO declared a pandemic on March 11, 2020. As of June 2022, there have been approximately 500 million confirmed cases worldwide, including more than 6 million deaths [Citation1]. SARS-CoV-2 is an enveloped, single-stranded, positive-sense RNA virus belonging to the subgenus Sarbecovirus of β coronavirus [Citation2]. The clinical presentation of SARS-CoV-2 infection is mainly as follows: asymptomatic, mild illness (presenting as fever, dry cough, and fatigue), severe disease (manifesting dyspnea and low blood oxygen) and critical illness (presenting as acute respiratory distress syndrome, respiratory failure, septic shock, and multiple organ dysfunction or failure leading to death) [Citation3].
Multiple epidemiological investigations in Wuhan, China, show that the clinical manifestations and severity of the disease can be affected by various risk factors, including male sex, older age, pregnancy, and comorbidities [Citation4]. Notably, individuals with diabetes, cardiovascular disease, chronic respiratory/ kidney/liver disease, obesity, and cancer have a higher mortality rate than the general population after SARS-CoV-2 infection [Citation4]. Diabetes has been a consistent focus of research among the abovementioned complications. In a territory-wide retrospective cohort study in Hong Kong, patients with diabetes had a threefold higher risk of adverse clinical outcomes, and diabetes was an independent predictor of the negative effects of COVID-19 [Citation5]. One-third of all COVID-19-related deaths (23,698 cases) in England from March 1 to May 11, 2020, occurred in people with diabetes [Citation6]. Moreover, diabetes has been reported to be associated with poor prognosis with two other coronavirus infections, SARS and MERS [Citation7,Citation8]. Remarkably, SARS-CoV-2 infection has also been found to be a risk factor for diabetes [Citation9]. Angiotensin-converting enzyme (ACE2) receptors mediating the entry of SARS-CoV-2 into cells have been shown to exist not only in the lung but also in critical metabolic organs such as pancreatic β cells [Citation10,Citation11]. Therefore, COVID-19 may cause dysregulation of glucose homeostasis and complicate the pathophysiology of preexisting diabetes [Citation11]. Inflammation caused by SARS-CoV-2 infection may exacerbate insulin resistance and subsequent hyperglycemia through the cytokine storm and hormonal imbalances [Citation12]. New onset diabetes has also been reported in COVID-19 patients [Citation11]. The literatures about SARS-CoV-2 infection and diabetes may indicate the bidirectional promotion between them. The severe global burden [Citation13] of diabetes and the raging COVID-19 pandemic highlight the need to explore the interaction between SARS-CoV-2 infection and diabetes. Understanding the development and severity of diabetes following SARS-CoV-2 infection and how to treat infection in this context are critical.
The leptin receptor-deficient C57BL/6J mice (db/db mice) is widely used as an animal model to study Type 2 diabetesmellitus (T2D). Insulin and leptin are critical in metabolism and regulation of islet secretion and blood glucose levels [Citation14]. T2D is characterized by insulin resistance and β-cell loss, which is difficult to control with current medical therapies [Citation14]. Leptin which is a vital regulator of metabolic homeostasis, is able to inhibit food intake, increase energy expenditure, and lower blood glucose levels via the leptin receptors. Altered leptin signalling is closely associated with metabolic diseases, such as obesity and T2D. Due to a complete deficiency of the long isoform of the leptin receptor in db/db mice, an overexpression of circulating leptin cannot be responded [Citation15]. Here, we established a mice model of SARS-CoV-2 infection using wild-type (WT) C57BL/6J mice and db/db mice. The differences between SARS-CoV-2 infected WT and db/db mice, infected and uninfected db/db mice were observed, respectively. We found that db/db mice were more susceptible to SASR-CoV-2 and exhibited more severe pathological damage and inflammation than WT mice after infection. T/B cell surface markers and lung collagen were down-regulated in db/db mice infected with SARS-CoV-2. It is suggested that the suppression of immune function and the destruction of alveolar structure may result in aggravated pneumonia in SARS-CoV-2 infected db/db mice. At the same time, SARS-CoV-2 infection caused more serious insulin resistance, pancreatic pathological damage and islet β cell apoptosis in db/db mice. In other words, SARS-CoV-2 infection promoted the development of diabetes. Our study suggests a mutually reinforcing relationship between diabetes and COVID-19, which provides a basis for further studies on the mechanism underlying this interaction.
Materials and methods
Animals, ethics and biosafety statement
db/db and C57BL/6J male mice were purchased from Changzhou Cavens Laboratory Animal Co, LTD (Manufacturing license: SCXK(SU)2021-0013). All animal experiments were approved by the Institutional Animal Care and Use Committee of the Institute of Medical Biology, Chinese Academy of Medical Science which the ethics number was DWSP202002 001, and followed the guidelines strictly in the ABSL-3 facility of the Kunming National Primate Research Center of High-level Biosafety, Yunnan, China.
Virus amplification and identification
SARS-CoV-2 prototype strain (Wuhan strain), alpha strain (B.1.1.7), beta strain (B.1.351), and delta strain (B.1.617.2) were used in the study and were kindly provided by the Chinese Center for Disease Control and Prevention (CDC). The virus was propagated on Vero E6 cells, purified, and concentrated with an ultrafilter system with a 300 kDa module (Millipore US). The virus was identified via reverse transcription polymerase chain reaction (RT–PCR) and sequencing, titrated via a plaque assay.
Animal experimental procedures
Flow chart of animal experiment was shown in (A). Firstly, 32 male 8-week-old C57BL/6J mice were randomly divided into four groups, named prototype, alpha, beta and delta group. Mice of each group were infected with the corresponding SARS-CoV-2 of 1 × 10⁵ PFU by intranasal route. Throat swabs were collected every other day. Mice were sacrificed on 5 dpi (days post infection, dpi), and lung tissues were collected to detect the viral load.
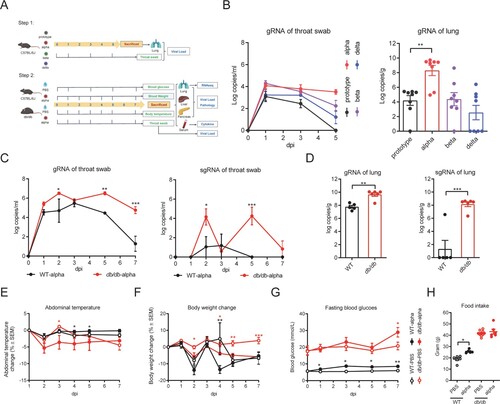
Figure 1. Detection of respiratory viral load and clinical characteristics during infection. (A) Flow chart of experimental protocol. (B) Viral load in throat swabs of WT mice infected with different strains and lung viral load on day 5 after infected with different strains in WT mice. (C) Viral gRNA and sgRNA in throat swabs of db/db and WT mice after infection. (D) Lung viral gRNA and sgRNA of db/db and WT mice on 7 dpi. (E) Abdominal temperature change after infection. (F) Body weight change percentage after infection. (G) Fasting blood glucose after infection. (H) Food intake for seven days. (C) (E-G) were analysed by one-way ANOVA with Tukey’s posttest, red * present the differences between infected and uninfected db/db mice and black * present the differences between infected and uninfected WT mice. (D) (H) were analysed by unpaired t-test. *p < 0.05, **p < 0.01, ***p < 0.001. All data were shown as mean ± SEM.
Then male 8-week-old db/db mice were randomly divided into 2 groups, intranasal inoculation with SARS-CoV-2 alpha (db/db-alpha) and phosphate-buffered saline (PBS) treatment (db/db-PBS). C57BL/6J mice were randomly divided into 2 groups, intranasal inoculation with SARS-CoV-2 alpha (WT-alpha) and PBS treatment (WT-PBS). Each group contained five to eight mice. Mice were intranasally challenged with 1 × 10⁵ PFU alpha strain or with PBS. PBS treatment was used as the control group. Weight and abdominal temperature were recorded on 1, 3, 5, 7 dpi, and throat swabs were collected simultaneously. Fasting blood glucose was measured on1, 3, 5, and 7 dpi. Mice were given enough food and the total weight of the food eaten was recorded within 7 days of infection. Mice were euthanized on 7 dpi. The serum was used for multi-factor assy. The lungs, livers, and pancreas were collected. Some were used for viral load detecting and RNA sequencing, and the remainder for pathological analysis.
Quantification of viral genome load
qRT-PCR was performed on RNA extracted from throat swabs and tissues. The tissues were weighed, inactivated with 800 μl trizol, and ground. Throat swabs were inactivated with 800 μl trizol. RNA was extracted using Direct-zol™RNA MiniPrep Plus according to the instructions and was used to conduct qRT-PCR using TaqMan Fast Virus 1-Step Master Mix (Thermo Fisher Scientific, USA) and CFX384 Touch Real-time PCR detection system (Bio-Rad, USA). Purified SARS-CoV-2 genomic RNA (gRNA) and subgenomic RNA (sgRNA) were used as standard curves, respectively. Based on the sequence reported by CDC, SARS-CoV-2 gRNA and sgRNA specific primers and probes were generated: gRNA F: GACCCCAAAATCAGCGAAAT, R: TCTGGTTACTGC-CAGTTGAATCTG, Probe: ACCCCGCATTACGTTTGGTGGACC; sgRNA F: CGATCTCTTGTAGATCTGTTCTC, R: ATATTGCAGCAGTACGCACACA, Probe: ACACTAGCCATCCTTACTGCGCTTCG. One step RT–PCR procedure was as follows: 25°Cfor 2 min, 50°C for 15 min, 95°C for 2 min, 95°C for 5 s, 60°C for 31 s, and 40 cycles of the above.
Multiplex assay of inflammatory cytokines and diabetes-related factors in serum
The Bio-Plex Pro Mouse Cytokine 23-Plex Immunoassay and the Bio-Plex Pro Mouse Diabetes 8-Plex assay were performed according to the manufacturer’s instructions on a Bio-Plex machine (Bio-Rad). The inflammatory cytokines including Eotaxin, G-CSF, GM-CSF, IFN-g, IL-1a, IL-1b, IL-2, IL-3, IL-4, IL-5, IL-6, IL-9, IL-10, IL-12, IL-12(p70), IL-13, IL-17A, KC, MCP-1, MIP-1a, MIP-1b, RANTES and TNF-α. The diabetes-related factors include Ghrelin, GIP, GLP-1, Glucagon, Insulin, Leptin, PAI-1 and Resistin.
Histology
Tissues were fixed in 10% formalin for 3–7 days. After being embedded in paraffin, tissues were cut into 5-μm sections for H&E staining and Masson staining. Slides were scanned by 3DHISTECH. H&E staining slides were scored by an experienced pathologist using CaseViewer offered by the manufacturer. Standards for HE staining pathological score of tissues showed in Supplement Table 1. Aipathwell was used to calculate the positive area ratio of Masson staining in lung sections [Citation16].
Immunofluorescence assay
Immunofluorescence was performed according to the manufacture-recommended procedure. Anti-insulin rabbit Rabbit pAb (Servicebio, China) and anti-Cleaved-caspase-3 Rabbit pAb (Servicebio, China) were used as primary antibodies for Immunofluorescence analysis. Images were captured under a fluorescence microscope (Leica).
RNA sequencing
Total RNA was extracted from tissues following the manufacturer’s instructions and checked for a RIN number to inspect RNA integrity by an Agilent 2100 Bioanalyzer (Agilent technologies, Santa Clara, CA, US). Qualified total RNA was further purified by RNAClean XP Kit (Cat A63987, Beckman Coulter, Inc. Kraemer Boulevard Brea, CA, USA) and RNase-Free DNase Set (Cat#79254, QIAGEN, GmBH, Germany). The purified total RNA was tested by NanoDrop ND-2000 spectrophotometer and Agilent Bioanalyzer 2100 Agilent technologies, Santa Clara, CA, US. Only the quality-checked total RNA can be isolated for mRNA isolation, fragmentation, first-strand cDNA synthesis, second-strand synthesis, end repair, poly A addition 3’ end, ligation splice, enrichment, and other steps, finally complete the library construction of sequencing samples. Sequencing was undertaken using Illumina NovaSeq6000 sequencer with PE150 sequencing mode.
Statistical analysis
Statistical analysis was performed with Graphpad primers (9.4.0). Detailed description has been provided in the figure legends. All data are expressed using mean ± SEM. One-way ANOVA with Tukey’s posttest was used to analyze throat swab viral load, fasting blood glucose, body temperature and body weight change during infection. Unpaired 2-tailed t-test was used to compare difference between two groups. Statistical significance was defined as p < 0.05.
Results
Diabetes affected virus replication or clearance after SARS-CoV-2 infection
To date, many variants of SARS-CoV-2 have evolved, including B.1.1.7 (alpha), B.1.351 (beta), and B.617.2 (delta) [Citation17]. WT mice were randomly divided into four groups and intranasally infected with the prototype, alpha, beta, and delta strains. By monitoring the changes of viral load in throat swabs, we found that the viral load of WT mice infected with the alpha strain was maintained at a higher level ((B)). The lung viral load of mice infected with the alpha strain was significantly higher than that of mice infected with the other strains ((B)). Hence, it suggested that the alpha strain was more susceptible than other SARS-CoV-2 strains in WT mice.
To determine whether virus replication was altered in db/db mice, db/db and WT mice were infected with the alpha strain of SARS-CoV-2 via nose drop, and the viral load was detected in throat swabs on 1, 2, 3, 5, 7 dpi and in the lung on 7 dpi. In contrast to WT mice, the viral copies, which were determined by the amount of gRNA in the throat swabs of db/db mice, were significantly higher and decreased more slowly after reaching the peak (p < 0.05) ((C)). sgRNA, an intermediate generated during active coronavirus replication, was also quantified to reflect the virus's replication activity. This trend was similar to that of gRNA ((C)). In throat swabs, sgRNA was almost undetectable in WT mice on 5 dpi, indicating cessation of viral replication while db/db mice could still detect sgRNA on 7 dpi ((C)). The lung is one of the major organs infected by SARS-CoV-2. Both of gRNA and sgRNA in the lung showed a higher copy number in db/db than in WT mice on 7 dpi, and this difference was statistically significant ((D)). Together these data suggested that diabetes might facilitate the replication and retard the clearance of SARS-CoV-2 in the respiratory system.
Diabetic mice exhibited aggravated lung injury and inflammation following SARS-CoV-2 infection
To determine whether diabetes affects COVID-19 disease severity, abdominal temperature and weight change following alpha strain infection were assessed in db/db and WT mice. Overall, the abdominal temperature in db/db mice showed a decreasing trend while WT mice was the opposite after infection with SARS-CoV-2 ((E)). Moreover, db/db mice showed a more significantly reduced body weight than uninfected db/db mice, while there was no apparent difference between WT SARS-CoV-2 infected and uninfected mice ((F)).
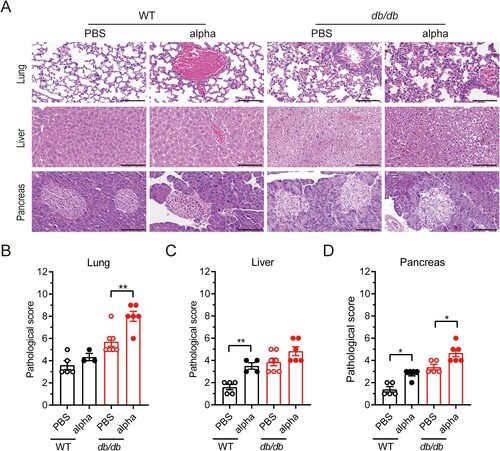
To examine the effect of diabetes on lung pathology of SARS-COV-2 infection, lung tissues were collected on 7 dpi and stained with H&E for histological examination in which the slides were analyzed and scored. The lungs from SARS-CoV-2 infected db/db mice exhibited more pulmonary hemorrhage and inflammatory cell infiltration than those from uninfected db/db mice ((A) and Supplement Table 2). There was no significant change in the lung pathological score of WT mice before and after SARS-CoV-2 infection, while the lung pathological score of db/db mice after infection was significantly higher than that of uninfected db/db mice ((B)). These data suggested that diabetes could contribute to inflammation and pathological lung injury, leading to more severe disease following SARS-CoV-2 infection.
Figure 2. Pathological histology analysis shows aggravated lung, liver, and pancreas damage in db/db mice infected with SARS-CoV-2. WT and db/db mice were infected intranasally with 1 × 10⁵ PFU of the alpha strain or PBS. Lungs, livers, and pancreases were collected on 7 dpi. (A) H&E staining of lungs, livers and pancreas sections from WT-PBS, WT-alpha, db/db-PBS and db/db-alpha. Pathological score of lungs(B), livers(C) and pancreases(D). Data are presented as mean ± SEM. The difference between two groups were determined by Manna-Whitney test in non-parametric tests. *p < 0.05; **p < 0.01; ***p < 0.001. Each group contains 5–6 mice. Scale bar 100 μm.
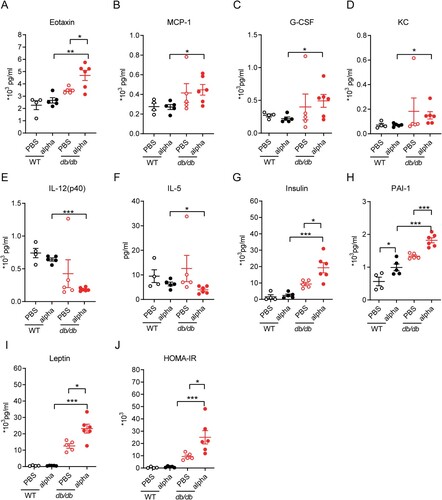
The cytokine storm correlates with the severity of COVID-19 and is a crucial cause of patient death. Acute lung injury in COVID-19 patients is thought to result from direct viral infection and immune hyperactivation[Citation18]. Lung injury and cellular infiltration were more obvious in db/db mice on 7 dpi (). To investigate the changes in inflammatory factors in mice before and after SARS-CoV-2 infection, the levels of chemokines and cytokines in serum were detected on 7 dpi ((A–F), Supplement Figure 1). Among all the detected inflammatory factors, the level of Eotaxin (CCL11) was clearly increased when db/db mice were infected with SARS-CoV-2 (p < 0.05) and was much higher than in infected WT mice (p < 0.01) ((A)). Although monocyte chemoattractant protein-1 (MCP-1/CCL-2), granulocyte colony stimulating factor (G-CSF), and KC(CXCL-1) showed no difference between SARS-CoV-2 infected and uninfected mice, their levels in infected db/db mice were significantly higher than those in infected WT mice (p < 0.05) ((B–D)). Eotaxin, KC, and MCP-1, which belong to the chemokine family, are known to have proinflammatory functions. G-CSF, which can aggravate lung injury during lung infection, has been reported to worsen disease in COVID-19 patients [Citation19–21]. In the present study, the levels of IL-12 and IL-5 in serum of infected db/db mice were lower than those in WT mice ((E–F)). Moreover, the difference of IL-12 and IL-15 between SARS-CoV-2 infected db/db and WT mice was significant. IL-12 has a proinflammatory effect to induce and activate NK cells during viral infection, promoting their secretion of IFN-γ and thus inhibiting viral replication [Citation22,Citation23] despite no significant change in IFN-γ in the serum of db/db and WT mice (Supplement Figure 1). IL-5 is a critical factor in eosinophil activation. It plays a vital role in antiviral immunity, having different functions in different stages of COVID-19 [Citation24]. In conclusion, the inflammatory factors described above were significantly different between SARS-CoV-2 infected db/db and WT mice and based on the available literature, this difference has potential to adversely affect the development of COVID-19.
Figure 3. Inflammation related factor level and diabetic related cytokine level in serum was altered in db/db mice following SARS-Cov-2 infection. WT and db/db mice were infected intranasally with 1 × 10⁵ PFU of the alpha strain or PBS. Serum was collected on 7 dpi. Inflammation factors including (A) Eotaxin, (B) MCP-1, (C) G-CS, (D)KC, (E) IL-12(p40), (F) IL-5, and so on was determined using Bio-Plex PeoTM assays. Protein expression of diabetic related cytokine such as (G) insulin, (H) PAI-1, (I) leptin and so on was determined using Bio-Plex Mouse Diabetes assays. (J) HOMA-IR value of mice on 7 dpi. The difference between two groups was determined by unpaired t-test. *p < 0.05; **p < 0.01; ***p < 0.001. Each group contained 5–6 mice. All data was presented as mean ± SEM.
Diabetic mice infected with SARS-CoV-2 exhibited severe diabetes symptoms
Based on values obtained every other day, the fasting blood glucose value of diabetic mice was approximately three times higher than that of WT mice, while it tended to increase after infection with SARS-CoV-2 in both db/db and WT mice ((G)). The total food intake of diabetic mice over 7 days was approximately twice that of WT mice regardless of SARS-CoV-2 infection ((H)). Infected WT mice had significantly higher food intake than control mice ((H)).
To observe the effect of SARS-CoV-2 infection on diabetes, the levels of some diabetes-related factors were tested in the serum ((G–J), Supplement Figure 2). db/db mice ordinarily suffer from hyperinsulinemia, which can cause insulin resistance and lead to type 2 diabetes [Citation25]. It was worth noting that the insulin content of SARS-CoV-2 infected db/db mice was significantly higher than that of uninfected db/db mice ((G), p < 0.05). Furthermore, we calculated the index of homeostasis model assessment of insulin resistance (HOMA-IR) [Citation26], as shown in (J), which was distinctly increased in the SARS-CoV-2 infected compared to the uninfected db/db mice. Serum leptin levels in db/db mice were significantly higher than those in WT mice and were further elevated when db/db mice were infected with SARS-CoV-2 ((I), p < 0.05). In addition, serum plasminogen activator inhibitor 1 (PIA-1) levels in WT and db/db mice were increased after infection with SARS-CoV-2 ((H)). Elevated PAI-1 levels are an independent risk factor for developing type 2 diabetes and strongly correlate with cardiovascular events and mortality [Citation27,Citation28]. Other factors related to diabetes: glucagon, ghrelin, GIP, GLP-1, and resistin, were also examined, but no significant changes were observed (Supplement Figure 2). There is no definitive study reporting that SARS-CoV-2 infection would affect above factors and then aggravates diabetes. We hypothesis that they may be not the decisive factors of aggravating diabetes caused by SARS-CoV-2 infection.
In addition, the livers and pancreases were collected from db/db and WT mice on 7 dpi and histologically examined. The local swelling and fusion of hepatocytes was more serious in db/db than in WT mice, regardless of their infection status ((A) and Supplement Table 3). In the pancreas, the islet cell reduction in SARS-CoV-2 infected db/db mice was significantly decreased compared with that in uninfected db/db mice while this change was not observed in WT mice ((A) and Supplement Table 4). Insulin and caspase3 were co-localized on pancreas by double-immunofluorescence, and there was an increase in caspase3-expressing pancreatic islet β cells after SARS-CoV-2 infection (Supplement Figure 3). It indicated that the reduction in islet cells due to SARS-CoV-2 infection may be related to apoptosis. Pancreatic pathological scores of both WT and db/db mice were elevated after SARS-CoV-2 infection ((D)). Overall, we can conclude that SARS-CoV-2 infection may aggravate the symptoms of diabetes.
Analysis of immune-related differentially expressed genes (DEGs) in lungs of db/db and WT mice after SARS-CoV-2 infection
To examine the global transcriptional effects of diabetes in the lung during SARS-CoV-2 infection, lung tissues were collected on 7 dpi and subjected to RNA sequencing. A total of 606 DEGs were identified between SARS-CoV-2 infected db/db and WT mice (Q < 0.05, |-log2(fold change) |>1) ((A)).
Figure 4. Analysis of immune-related DEGs in the lungs of db/db and WT mice after infection. (A) Veen diagram of DEGs in the infected db/db and WT mice and immune-related genes. DEGs were presented in blue, and immune-related genes were presented in red. (B) Heat map of expression of immune-related differential genes. (C) The network of GO enriched terms of DEGs. The term significant was presented by the node size: the biggest terms were the most significant ones. The proportion of associated upregulated or downregulated genes was showed with the node colour: red colour indicated more upregulated genes was enriched to the term, and blue colour indicated more downregulated genes. (D) FPKM values of some genes encoding immune cell surface antigens and cytokines in db/db and WT mice.
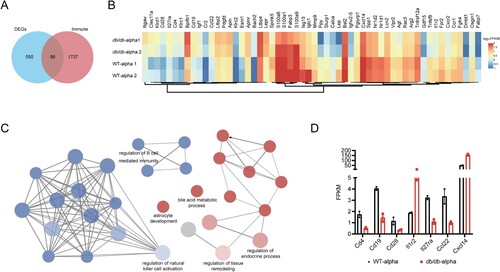
We previously demonstrated that db/db mice were more susceptible to SARS-CoV-2 than WT mice. The host’s ability to defend against viruses was largely determined by the immune system, for which we speculated that the susceptibility of db/db mice might be related to an immune disorder. To verify this hypothesis, 1793 immune-related genes were obtained from the Immprot Portal database [Citation29], and intersected with DEGs of SARS-CoV-2 infected db/db and WT mice, which revealed immune-related genes with altered transcriptional levels in SARS-CoV-2 infected db/db mice and WT mice ((A)). The expression of these genes in db/db and WT mice was shown in the heatmap ((B)). GO enrichment analysis of immune-related DEGs was performed using the plug-in ClueGO in Cytoscape [Citation30,Citation31]. The downregulated genes were found to be mainly enriched in terms related to the regulation of the immune system, indicating that the immune response of db/db mice was indeed altered compared with that of WT mice after SARS-CoV-2 infection, while the upregulated genes were mainly enriched in terms related to endocrine regulation and tissue remodelling ((C)). To further investigate the change in the immune response in db/db mice, the trends of immune cell surface antigens and certain cytokines and receptors were determined. As shown in (D), the level of T-cell surface antigen CD4, B-cell surface antigen CD19 and the costimulatory molecule CD28, which promote T-cell activation, were lower in SARS-CoV-2 infected db/db than in WT mice, suggesting that a suppressed immune response might contribute to the viral susceptibility in db/db mice. In addition, similar to the serum inflammatory multifactor assay, the levels of certain cytokines and their receptors were also changed in db/db mice. These changes have the potential to exacerbate inflammation after SARS-CoV-2 infection [Citation32–34]. Using a similar approach to analyze immune-related DEGs of uninfected mice, we also observed some reduced immune cell surface antigens and some elevated cytokines such as Ccl8, Ccl24, and Cxcl14, which contributed to lung damage in db/db mice compared to WT mice [Citation35–37] (Supplement Figure 4). Based on the above results, it could be preliminarily concluded that diabetes led to a suppressed immune response and increased inflammation, which contributed to the susceptibility of db/db mice and the more severe tissue damage observed in these mice after SARS-CoV-2 infection.
Analysis of SARS-CoV-2 related DEGs in lungs of db/db and WT mice after SARS-CoV-2 infection
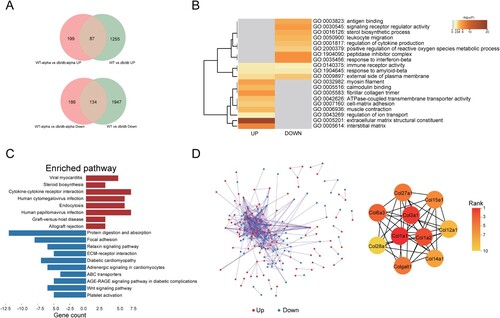
To independently observe variances between db/db and WT mice caused by SARS-CoV-2 infection, DEGs of SARS-CoV-2 infected db/db and WT mice were analyzed after removing the DEGs of uninfected db/db and WT mice (). In the two groups of uninfected mice, 3423 DEGs were obtained (Q < 0.05, |-log2(fold change) |>1), resulting in 2081 downregulated genes and 1342 upregulated genes in the lung of db/db mice when compared with WT mice ((A)). Finally, 385 DEGs resulting from SARS-CoV-2 infection were obtained, including 199 upregulated genes and 186 downregulated genes in db/db mice ((A)). To analyze the biological classification of the SARS-CoV-2 related DEGs of SARS-CoV-2 infected db/db mice and WT mice, we performed a functional enrichment analysis of upregulated and downregulated genes by Metascape [Citation38]. KEGG pathway analysis indicates that the upregulated genes were mainly enriched in diseases caused by a viral infection, cytokine-cytokine receptor interactions, and endocytosis ((C)). The downregulated genes were primarily enriched in protein digestion and absorption, focal adhesion, ECM-receptor interaction, and the relaxin signalling pathway ((C)). GO analysis showed that the upregulated genes were mainly enriched in the peptidase inhibitor complex, response to interferon-beta, signalling receptor regulator, antigen binding, leukocyte migration, and regulation of cytokine production while downregulated genes were mainly enriched in extracellular matrix structural constituent, interstitial matrix, myosin filament, and fibrillar collagen trimer ((B)). The PPI network was obtained by String [Citation39] and Cytoscape [Citation31] ((D)). Ten genes were identified as hub genes based on the plug-in cytoHubba in Cytoscape using the MCC algorithm [Citation40] ((D)), for which the symbol, protein name, functions, and change in expression levels were shown in Supplemental Table 5. Notably, they were all found to be collagen components and were downregulated in the lungs of SARS-CoV-2 infected db/db mice compared to WT mice. In the lung, collagen is associated with the alveolar interstitium, bronchi, and blood vessels and is known to be the basis for maintaining the lung structure and function [Citation41,Citation42]. Thus, the alteration of collagen components may have contributed to the alveolar septal disruption observed on pathological slides representative of SARS-CoV-2 infected db/db mice ((A)). In order to verify this hypothesis, Masson staining of lung tissues (Supplement Figure 5) was performed. The results showed that the collagen level of the lung was reduced in mice after SARS-CoV-2 infection. In the SARS-CoV-2 infected groups, the lung collagen level of db/db mice was lower than WT mice, none of the above changes showed significant differences. It suggested that diabetes did reduce the collagen levels in lung thus lead to more severe lung damage after SARS-CoV-2 infection.
Figure 5. Analysis of SARS-CoV-2 related DEGs in the lungs of db/db and WT mice after infection. (A)Veen diagram of different genes. Genes of infected mice were presented in red, and genes of uninfected mice were presented in green. (B)The GO enrichment of upregulated DEGs and downregulate DEGs. The top 20 results were shown in heatmap. The darker the colour, the smaller the p-value. (C) The KEGG pathway enrichment analysis of DEGs. Results from KEGG enrichment of upregulated genes (red) and downregulated genes (blue) were showed in bar graph. (D) The PPI network of all DEGs. The upregulated genes were marked in red, while the down-regulated genes were marked in blue. Ten hub genes were identified with the MCC algorithm using cytoHubba.
Discussion
Diabetes, a worldwide disease, can increase the severity of many infectious diseases [Citation43,Citation44]. Multiple clinical and epidemiological studies have shown that COVID-19 patients with diabetes have a higher rate of developing severe illness or dying [Citation5,Citation45–47]. Moreover, new-onset diabetes has been reported in COVID-19 [Citation11], hinting at a possible interaction between them. In the current global epidemic of COVID-19 and diabetes, determining whether there is an interplay between COVID-19 and diabetes and the underlying mechanism is of great importance for their prevention and treatment. In this study, we established SARS-CoV-2 infected WT and diabetic mice model, showed the interaction between diabetes and COVID-19, and initially explored the mechanism by which diabetes exacerbates the severity of the infection.
C57BL/6J mice were intranasally infected with the prototype, alpha, beta, and delta strains to screen strains that were susceptible to mice. Our results indicated that WT mice were not susceptible to the prototype and delta strains which was consistent with previous studies [Citation48–50]. Mice were also insensitive to beta strain. Interestingly, mice showed the slowest virus clearance rate in the throat and the highest viral load in the lung following alpha strain infection. Thus, the alpha strain was selected for follow-up experiments.
The body temperature and weight of SARS-CoV-2 infected db/db mice showed a downward trend. Clinical studies have reported that unexpected and significant weight loss in T2D patients was associated with a higher mortality [Citation51,Citation52]. Body temperature and weight decrease have been observed in severe or fatal cases of COVID-19 [Citation53,Citation54]. In vitro, hypothermia promotes SARS-CoV-2 replication in the respiratory epithelium [Citation55]. Thus, the decrease in body temperature and weight after SARS-CoV-2 infection may be related to the worse disease progression of COVID-19. The blood glucose level was much higher in db/db mice than in WT mice. Compared with WT mice, SARS-CoV-2 infected db/db mice showed a higher replication capacity and a slower clearance rate in the upper respiratory tract ((C)). In the lung tissues obtained on 7 dpi, both gRNA and sgRNA were higher in db/db than in WT mice in the lung tissues ((D)), representing a higher viral load and more active viral replication, respectively. Clinical studies have shown that high viral load is associated with more severe symptoms and is a risk factor for acute disease [Citation56,Citation57]. In this research, db/db compared with WT mice showed more serious pulmonary injuries, such as alveolar septal thickening, inflammatory cell infiltration, hemorrhage, and thrombosis on 7 dpi.
By analyzing the immune-related DEGs of SARS-CoV-2 infected db/db and WT mice, we found that diabetes might suppress the immune response after infection, which could potentially be responsible for the increased susceptibility of diabetic mice. In addition, some inflammatory factor levels in the serum of SARS-CoV-2 infected db/db mice were also different compared with WT mice on 7 dpi, consist with the RNA sequencing results (). These changes may have some effect on the host’s antiviral immunity [Citation19–24,Citation58,Citation59]. A machine-learning study showed that hyperglycemia and chronic inflammation in people with diabetes could weaken immune defences and contribute to viral infection and replication [Citation60]. In the human population, hyperglycemia in diabetic patients has been reported to lead to reduced phagocytosis of peripheral blood mononuclear cells (PBMCs) [Citation61] and reduced inflammation-stimulated leukocyte responses [Citation62], which is not conducive to viral clearance.
Enrichment analysis of DEGs in the lungs of SARS-CoV-2 infected db/db and WT mice revealed that diabetes might affect the immune response and intercellular matrix following infection. The hub genes found in the PPI of DEGs all belonged to the collagen family, which plays an essential role in lung structure and functions and is downregulated in db/db mice [Citation41,Citation42]. Therefore, it can be hypothesized that diabetes may lead to more severe structural damage in the lung, which was confirmed by Masson staining in lung.
Interestingly, COVID-19 also aggravates diabetes. Many cases of new-onset diabetes have been reported in COVID-19 patients [Citation11,Citation63]. We also observed significantly elevated blood glucose levels, serum insulin, and serum leptin levels in db/db mice after SARS-CoV-2 infection, indicating aggravated insulin and leptin function resistance. Our research showed that SARS-CoV-2 infection worsened pancreatic injury and caused islet cell reduction by promoting its apoptosis in db/db mice. In a study of Italian patients with COVID-19, persistent insulin resistance was observed, as well as β-cell overstimulation and dysfunction, which may lead to eventual β-cell depletion and death [Citation63]. Cytokine storm and redox storm caused by SARS-CoV-2 infection would form a vicious cycle in the islet, and are also responsible for β-cell dysfunction and apoptosis [Citation64]. Therefore, the observed increased apoptosis of islet cells may be caused by cytokine storms triggered by SARS-CoV-2 infection. In conclusion, COVID-19 is capable of causing pancreatic damage and exacerbating insulin resistance, which is a risk factor for diabetes.
In the pandemic of COVID-19 and diabetes, a growing number of clinical studies have suggested an association between them. Our diabetic mice model of COVID-19 infection clearly supports the mutual promotion between COVID-19 and diabetes, suggesting that patients with diabetes and COVID-19 should be treated for both diseases simultaneously. In the meantime, our study suggests that enhancing autoimmunity and suppressing the production of inflammatory cytokine storm may be therapeutic approaches that take both into consideration. Inadequately, the data were only comprehensively collected and analysed at 7 dpi. In the future, we will select appropriate points to continuously observe the variation to explore the specific mechanism in an attempt to provide new ideas for the treatment of COVID-19 patients with diabetes and the prevention of new-onset diabetes in COVID-19.
Supplemental Material
Download MS Word (4.2 MB)Acknowledgements
We appreciate the services of all staff at the National Kunming High-level Biosafety Primate Research Center. The authors would like thank Institute of laboratory animal sciences CAMS&PUMC, Guangdong CDC, Chongqing CDC and professor Wenjie Tan of China CDC for their help.
Disclosure statement
No potential conflict of interest was reported by the author(s).
Data availability
All study data are included in the article and/or supplementary material. The original data of RNA sequencing in this study is available at NCBI SRA under the accession number PRJNA929576.
Additional information
Funding
References
- WHO COVID-19 Dashboard. Geneva: World Health Organization, 2020. Available online: https://covid19.who.int/.
- Lin P, Wang M, Wei Y, et al. Coronavirus in human diseases: mechanisms and advances in clinical treatment. MedComm. 2020;1(3):270–301.
- Wang M-Y, Zhao R, Gao L-J, et al. SARS-CoV-2: structure, biology, and structure-based therapeutics development. Front Cell Infect Microbiol. 2020;10:587269.
- Gao Y-D, Ding M, Dong X, et al. Risk factors for severe and critically ill COVID-19 patients: a review. Allergy. 2021;76(2):428–455.
- Lui GC-Y, Yip TC-F, Wong VW-S, et al. Significantly lower case-fatality ratio of coronavirus disease 2019 (COVID-19) than severe acute respiratory syndrome (SARS) in Hong Kong – a territory-wide cohort study. Clin Infect Dis. 2021;72(10):e466–e475.
- Barron E, Bakhai C, Kar P, et al. Associations of type 1 and type 2 diabetes with COVID-19-related mortality in England: a whole-population study. Lancet Diabetes Endocrinol. 2020;8(10):813–822.
- Yang JK, Feng Y, Yuan MY, et al. Plasma glucose levels and diabetes are independent predictors for mortality and morbidity in patients with SARS. Diabet Med. 2006;23(6):623–628.
- Kulcsar KA, Coleman CM, Beck SE, et al. Comorbid diabetes results in immune dysregulation and enhanced disease severity following MERS-CoV infection. JCI Insight. 2019;4:20.
- Kazakou P, Lambadiari V, Ikonomidis I, et al. Diabetes and COVID-19; A bidirectional interplay. Front Endocrinol. 2022;13:780663.
- Hamming I, Timens W, Bulthuis MLC, et al. Tissue distribution of ACE2 protein, the functional receptor for SARS coronavirus. A first step in understanding SARS pathogenesis. J Pathol. 2004;203(2):631–637.
- Rubino F, Amiel SA, Zimmet P, et al. New-onset diabetes in Covid-19. N Engl J Med. 2020;383(8):789–790.
- Kazakou P, Paschou SA, Psaltopoulou T, et al. Early and late endocrine complications of COVID-19. Endocr Connect. 2021;10(9):R229–R239.
- Federation ID. IDF Diabetes Atlas 2022 [cited 2022 6/7]. Available from: https://diabetesatlas.org/
- D'Souza AM, Neumann UH, Glavas MM, et al. The glucoregulatory actions of leptin. Mol Metab. 2017;6(9):1052–1065.
- Suriano F, Vieira-Silva S, Falony G, et al. Novel insights into the genetically obese (ob/ob) and diabetic (db/db) mice: two sides of the same coin. Microbiome. 2021;9(1):147.
- Puls M, Beuthner BE, Topci R, et al. Impact of myocardial fibrosis on left ventricular remodelling, recovery, and outcome after transcatheter aortic valve implantation in different haemodynamic subtypes of severe aortic stenosis [马松染色aipathwell]. Eur Heart J. 2020;41(20):1903–1914.
- Yang J, Yan Y, Zhong W. Application of omics technology to combat the COVID-19 pandemic. MedComm. 2021;2(3):381–401.
- Hu B, Huang S, Yin L. The cytokine storm and COVID-19. J Med Virol. 2021 Jan;93(1):250–256.
- Taha M, Sharma A, Soubani A. Clinical deterioration during neutropenia recovery after G-CSF therapy in patient with COVID-19. Respir Med Case Rep. 2020;31:101231–101231.
- Lazarus HM. Gale RPG-CSF are different GM-CSF which one is better for COVID-19? Acta Haematol. 2021;144(4):355–359.
- Lazarus HM, Gale RP. Is G-CSF dangerous in COVID-19: why not use GM-CSF? Acta Haematol. 2021;144(3):350–351.
- Costela-Ruiz VJ, Illescas-Montes R, Puerta-Puerta JM, et al. SARS-CoV-2 infection: the role of cytokines in COVID-19 disease. Cytokine Growth Factor Rev. 2020;54:62–75.
- Komastu T, Ireland DD, Reiss CS. IL-12 and viral infections. Cytokine Growth Factor Rev. 1998;9(3-4):277–285.
- Pala D, Pistis M. Anti-IL5 drugs in COVID-19 patients: role of eosinophils in SARS-CoV-2-induced immunopathology. Front Pharmacol. 2021;12:622554.
- Corkey BE. Banting lecture 2011: hyperinsulinemia: cause or consequence? Diabetes. 2012;61(1):4–13.
- Matthews DR, Hosker JP, Rudenski AS, et al. Homeostasis model assessment: insulin resistance and beta-cell function from fasting plasma glucose and insulin concentrations in man. Diabetologia. 1985;28(7):412–419.
- Yarmolinsky J, Bordin Barbieri N, Weinmann T, et al. Plasminogen activator inhibitor-1 and type 2 diabetes: a systematic review and meta-analysis of observational studies. Sci Rep. 2016;6:17714–17714.
- Lyon CJ, Hsueh WA. Effect of plasminogen activator inhibitor-1 in diabetes mellitus and cardiovascular disease. Am J Med. 2003;115(Suppl. 8A):62S–68S.
- Bhattacharya S, Dunn P, Thomas CG, et al. Immport, toward repurposing of open access immunological assay data for translational and clinical research. Sci Data. 2018;5:180015.
- Bindea G, Mlecnik B, Hackl H, et al. ClueGO: a cytoscape plug-in to decipher functionally grouped gene ontology and pathway annotation networks. Bioinformatics. 2009;25(8):1091–1093.
- Shannon P, Markiel A, Ozier O, et al. Cytoscape: a software environment for integrated models of biomolecular interaction networks. Genome Res. 2003;13(11):2498–2504.
- Chen L, Guo L, Tian J, et al. Overexpression of CXC chemokine ligand 14 exacerbates collagen-induced arthritis. J Immunol. 2010;184(8):4455–4459.
- Rapp M, Wintergerst MWM, Kunz WG, et al. CCL22 controls immunity by promoting regulatory T cell communication with dendritic cells in lymph nodes. J Exp Med. 2019;216(5):1170–1181.
- Yoshida H, Miyazaki Y. Interleukin 27 signaling pathways in regulation of immune and autoimmune responses. Int J Biochem Cell Biol. 2008;40(11):2379–2383.
- Naderi A, Farmaki E, Chavez B, et al. Beneficial effects of CCL8 inhibition at lipopolysaccharide-induced lung injury. iScience. 2022;25(12):105520.
- Mor A, Segal Salto M, Katav A, et al. Blockade of CCL24 with a monoclonal antibody ameliorates experimental dermal and pulmonary fibrosis. Ann Rheum Dis. 2019;78(9):1260–1268.
- Du L, Xu C, Shi J, et al. Elevated CXCL14 in induced sputum was associated with eosinophilic inflammation and airway obstruction in patients with asthma. Int Arch Allergy Immunol. 2022;183(11):1216–1225.
- Zhou Y, Zhou B, Pache L, et al. Metascape provides a biologist-oriented resource for the analysis of systems-level datasets. Nat Commun. 2019;10(1):1523.
- Snel B, Lehmann G, Bork P, et al. STRING: a web-server to retrieve and display the repeatedly occurring neighbourhood of a gene. Nucleic Acids Res. 2000;28(18):3442–3444.
- Chin C-H, Chen S-H, Wu H-H, et al. Cytohubba: identifying hub objects and sub-networks from complex interactome. BMC Syst Biol. 2014;8(Suppl. 4):S11.
- Bradley KH, McConnell SD, Crystal RG. Lung collagen composition and synthesis: characterization and changes with age. J Biol Chem. 1974;249(9):2674–2683.
- Mereness JA, Bhattacharya S, Ren Y, et al. Collagen VI deficiency results in structural abnormalities in the mouse lung. Am J Pathol. 2020 Feb;190(2):426–441.
- Shah BR, Hux JE. Quantifying the risk of infectious diseases for people with diabetes. Diabetes Care. 2003 Feb;26(2):510–513.
- Ma CM, Yin FZ. The mortality in infectious inpatients with type 2 diabetes compared with non-diabetic population: infection in type 2 diabetes. Medicine. 2019 Jun;98(24):e16025.
- Belikina DV, Malysheva ES, Petrov AV, et al. COVID-19 in patients with diabetes: clinical course, metabolic status, inflammation, and coagulation disorder. Sovrem Tekhnol Med. 2021;12(5):6–16.
- Guan W-J, Ni Z-Y, Hu Y, et al. Clinical characteristics of coronavirus disease 2019 in China. N Engl J Med. 2020;382(18):1708–1720.
- Chen Y, Chen J, Gong X, et al. Clinical characteristics and outcomes of type 2 diabetes patients infected with COVID-19: a retrospective study. Engineering. 2020;6(10):1170–1177.
- Zhou P, Yang XL, Wang XG, et al. A pneumonia outbreak associated with a new coronavirus of probable bat origin. Nature. 2020 Mar;579(7798):270–273.
- Ren W, Zhu Y, Wang Y, et al. Comparative analysis reveals the species-specific genetic determinants of ACE2 required for SARS-CoV-2 entry. PLoS Pathog. 2021 Mar;17(3):e1009392.
- Shuai H, Chan JF, Yuen TT, et al. Emerging SARS-CoV-2 variants expand species tropism to murines. EBioMedicine. 2021 Nov;73:103643.
- Hu J, Hu Y, Hertzmark E, et al. Weight change, lifestyle, and mortality in patients with type 2 diabetes. J Clin Endocrinol Metab. 2022;107(3):627–637.
- Tsai TC, Lee CH, Cheng BC, et al. Body mass index-mortality relationship in severe hypoglycemic patients with type 2 diabetes. Am J Med Sci. 2015 Mar;349(3):192–198.
- Vaillant MF, Agier L, Martineau C, et al. Food intake and weight loss of surviving inpatients in the course of COVID-19 infection: a longitudinal study of the multicenter NutriCoviD30 cohort. Nutrition. 2022 Jan;93:111433.
- Allard N, Maruani A, Cret C, et al. Acute hypothermia in Covid 19: a case report. eNeurol Sci. 2020 Sep;20:100248.
- Herder V, Dee K, Wojtus JK, et al. Elevated temperature inhibits SARS-CoV-2 replication in respiratory epithelium independently of IFN-mediated innate immune defenses. PLoS Biol. 2021;19(12):e3001065.
- Zheng S, Fan J, Yu F, et al. Viral load dynamics and disease severity in patients infected with SARS-CoV-2 in Zhejiang province, China, January-March 2020: retrospective cohort study. BMJ. 2020;369:m1443.
- Liu Y, Yang Y, Zhang C, et al. Clinical and biochemical indexes from 2019-nCoV infected patients linked to viral loads and lung injury. Sci China Life Sci. 2020;63(3):364–374.
- Nakamura H, Weiss ST, Israel E, et al. Eotaxin and impaired lung function in asthma. Am J Respir Crit Care Med. 1999;160(6):1952–1956.
- Chen Y, Wang J, Liu C, et al. IP-10 and MCP-1 as biomarkers associated with disease severity of COVID-19. Mol Med. 2020;26(1):97–97.
- Logette E, Lorin C, Favreau C, et al. A machine-generated view of the role of blood glucose levels in the severity of COVID-19. Front Public Health. 2021;9:695139.
- Lecube A, Pachón G, Petriz J, et al. Phagocytic activity is impaired in type 2 diabetes mellitus and increases after metabolic improvement. PLoS One. 2011;6(8):e23366.
- McManus LM, Bloodworth RC, Prihoda TJ, et al. Agonist-dependent failure of neutrophil function in diabetes correlates with extent of hyperglycemia. J Leukoc Biol. 2001 Sep;70(3):395–404.
- Montefusco L, Ben Nasr M, D'Addio F, et al. Acute and long-term disruption of glycometabolic control after SARS-CoV-2 infection. Nat Metab. 2021;3(6):774–785.
- Hayden MR. An immediate and long-term complication of COVID-19 may be type 2 diabetes mellitus: the central role of β-cell dysfunction, apoptosis and exploration of possible mechanisms. Cells. 2020;9:11.