
ABSTRACT
Patients with severe acute respiratory syndrome coronavirus 2 (SARS-CoV-2) and influenza A virus (FLUAV) coinfections were associated with severe respiratory failure and more deaths. Here, we developed a model for studying SARS-CoV-2 and FLUAV coinfection using human pluripotent stem cell-induced alveolar type II organoids (hiAT2). hiAT2 organoids were susceptible to infection by both viruses and had features of severe lung damage. A single virus markedly enhanced the susceptibility to other virus infections. SARS-CoV-2 delta variants upregulated α-2-3-linked sialic acid, while FLUAV upregulated angiotensin-converting enzyme 2 (ACE2) and transmembrane serine protease 2 (TMPRSS2). Moreover, coinfection by SARS-CoV-2 and FLUAV caused hyperactivation of proinflammatory and immune-related signaling pathways and cellular damage compared to a respective single virus in hiAT2 organoids. This study provides insight into molecular mechanisms underlying enhanced infectivity and severity in patients with co-infection of SARS-CoV-2 and FLUAV, which may aid in the development of therapeutics for such co-infection cases.
Introduction
The ongoing global pandemic of coronavirus disease 2019 (COVID-19) caused by severe acute respiratory syndrome coronavirus 2 (SARS-CoV-2) infection continues to pose a serious threat to public health even after high vaccination coverage globally. This is largely contributed by infection in unvaccinated individuals and reinfections in naturally infected or vaccinated individuals by circulating variants of SARS-CoV-2 [Citation1,Citation2] due to the waning of immunity. It has been one of the deadliest pandemics in history, with more than 759 million confirmed cases of COVID-19, including 6.8 million deaths [Citation3] as of 11th March 2023. Lately, several studies have reported co-infection or sequential infection with SARS-CoV-2 and with other respiratory viruses, especially Influenza A virus (FLUAV) in COVID-19 patients [Citation4–6]. During the initial outbreak of SARS-CoV-2 in Wuhan from January to March 2020, the co-infection rate of influenza A virus (FLUAV) and SARS-CoV-2 was found to be 45.5%, suggesting a very high prevalence of co-infection cases [Citation7]. Several clinical studies have confirmed a substantial occurrence of co-infection with SARS-CoV-2 and FLUAV in deceased patients. Patients over 60 years of age exhibited superinfection with FLUAV, with 23 out of 105 recorded deaths (22.3%) showing evidence of co-infection with FLUAV, predominantly of the H1N1 variant [Citation8]. The prevalence of coinfection with SARS-CoV-2 and FLUAV was up to 4.5% in Asia [Citation4,Citation5,Citation9]. A growing body of evidence has revealed that COVID-19 patients with FLUAV co-infection developed more severe respiratory failure and showed an increased risk of death, especially in children, obese and elderly individuals [Citation10,Citation11].
The public health and social non-pharmaceutical measures implemented during the first year of the COVID-19 pandemic (2019-20) were effective in reducing the transmission of FLUAV [Citation12,Citation13]. The prevalence of FLUAV infection was markedly by ∼65 to 80% during 2019–2020 compared to the prevalence during 2011–2019 in United states and China. However, recent data suggest that the susceptibility to FLUAV have increased significantly in 2021-2022, compared to influenza seasons during pre-COVID pandemic period [Citation14]. It is feared that with the prolongation of COVID-19 pandemic and ease of containment restrictions across the world, there will be high-risk of co-infection of SARS-CoV-2 with other seasonal respiratory viruses, especially FLUAV in coming years. Besides diagnosis, paucity of data related to transmission, and clinical outcome of patients with co-infection of SARS-CoV-2 with FLUAV presents a serious public health challenge. It is important to determine if FLUAV infection predisposes individuals to SARS-CoV-2 co-infection or vice versa. Currently, there are no physiologically relevant preclinical models available to investigate the underlying immunopathogenic mechanisms associated with co-infection of SARS-CoV-2 and FLUAV, which are of high importance for discovering and developing effective therapeutics to manage future COVID-19 cases.
Hemagglutinin, a glycoprotein in the membrane envelope of FLUAV, binds to the specific α-sialic acid that functions as a receptor for FLUAV on host cells such as alveolar type I and II epithelial cells. By contrast, SARS-CoV-2 binds to ACE2 on the surface of olfactory and alveolar type II cells [Citation15]. Currently, a few cell lines have been used to study the biology of co-infection with SARS-CoV-2 with FLUAV, but they are associated with several limitations. While widely used human lung epithelial cell lines such as A549 (adenocarcinomic human alveolar basal epithelial cells) and BEAS-2B (normal human bronchial epithelial cells) are susceptible to FLUAV infection, they are less permissive to SARS-CoV-2 infection due to negligible levels of surface expression of entry receptor, ACE2 and the essential cofactor, transmembrane serine protease 2 (TMPRSS2) [Citation16,Citation17]. Hence, these cell lines have been overexpressed with either human ACE2 gene only, or ACE2 and TMPRSS2 genes to increase the infectivity of SARS-CoV-2 [Citation16,Citation18]. The African Green Monkey, Vero E6 cell line express ACE2 and has been a valuable cell source to understand the SARS-CoV-2 infection. Vero E6 cells are also susceptible to FLUAV. However, Vero E6 cells are not suitable for studying the host responses to virus infection as they are deficient in interferon signalling. The LLC-MK2 (Rhesus Monkey Kidney Epithelial Cells) and Calu-3 (human lung adenocarcinoma) cells are also susceptible to both SARS-CoV-2 and FLUAV, however, they are not physiologically relevant human alveolar epithelial cell model. Human alveolar type II (AT2) cells express entry receptors for SARS-CoV-2 and FLUAV, and are susceptible to infection by both viruses, [Citation19–21]. However, access to primary AT2 cells is limited due to cost, reproducibility, and ethical considerations. In addition, primary AT2 cells may lose their characteristics upon long-term passage [Citation20].
Pluripotent stem cells (PSCs) can self-renew and differentiate into cell types found in the adult body [Citation22]. Numerous studies have described advances in knowledge of differentiation of PSCs into diverse human primary-like cells, and the possible application of these cells for disease modelling, toxicity testing, and drug screening [Citation22]. Recently, the use of PSC-derived alveolar organoid cultures has greatly aided in understanding the biology of infectious respiratory viruses [Citation21]. In this study, we have developed an in vitro model system to study co-infection of SARS-CoV-2 and FLUAV using human PSC-induced AT2 cell-enriched organoids (hence forth referred as hiAT2). hiAT2 organoids were susceptible to infection by both SARS-CoV-2 and FLUAV and exhibited severe pathological and immunological features when simultaneously infected. Furthermore, SARS-CoV-2 demonstrated enhanced infectivity in hiAT2 organoids pre-infected with FLUAV and vice versa. The underlying mechanisms for this enhanced infectivity of SARS-CoV-2 or FLUAV in hiAT2 co-infected model was related to the upregulation of the respective viral entry receptors. SARS-CoV-2 infection upregulated α−2-3-linked sialic acid, while FLUAV infection upregulated ACE2 and TMPRSS2.
Methods
Ethics approval
All experiments using human embryonic stem cells were approved by the Institutional Review Board of the Korea Centers for Disease Control and Prevention (CDC) (approval number 2020-02-09-2C-A). Experiments involving SARS-CoV-2 and FLUAV coinfection were conducted in a level 3 biosafety laboratory, and all protocols were approved by the Korea CDC and the biosafety committee (approval number KCDC-039-22).
Maintenance of human PSCs and generation of alveolar type II organoids
The H9 human embryonic stem cell line was obtained from WiCell (Madison, WI, USA) and cultured in mTeSR1 (Stem Cell Technologies, Vancouver, Canada). To differentiate H9 cells into hiAT2 organoids, we modified a previously reported protocol [Citation23]. Briefly, H9 cells were dissociated into single cells with Accutase (Merck, NJ, USA, SCR005) and seeded on Matrigel-coated dishes. The various steps involved are as follows: Day 0 – Day 2: H9 cells was differentiated into definitive endoderm (DE) for 3 days using a Stemdiff Definitive Endoderm Differentiation Kit (Stem Cell Technologies). Day 3 – Day 5: DE cells were further differentiated into anterior foregut endoderm by adding SFM medium composed of 75% Iscove’s Modified Dulbecco’s Medium (Cellgro, VA, USA 10-016-CV), 15% Ham’s F-12 medium with L-glutamine (Corning, NY,USA; 10-080-CV), 0.5× N2 (Gibco, USA 17502-048), 0.5× B27 (Gibco, 17504-044), 7.5% bovine albumin fraction V (Gibco, 15260037), 1% penicillin–streptomycin (Gibco, 15140122), 1% GlutaMAX (Gibco, 35050061), 50 μg/ml L-ascorbic acid (Sigma-Aldrich, MO A4544), and 0.4 μM 1-thioglycerol (Sigma-Aldrich, M6145), supplemented with 2 μM dorsorphorphin (Sigma-Aldrich, P5499), and 10 μM SB431542 (Sigma-Aldrich, S4317). Day 6 – Day 14: The differentiated cells were further differentiated into lung progenitor cells by treatment with SFM medium containing 10 ng/ml BMP4 (R&D Systems, MN, USA; 345-FG), 3.5 μM CHIR99021 (Tocris, Bristol, UK; 4423), and 100 nM retinoic acid (Tocris, 695) for 8 days. Day 15: CD47 + CD26- cells were sorted and resuspended in Matrigel (200 cells/µl) to generate alveolar type II cell-enriched alveolar spheres. The mixture was carefully inverted and solidified for 20 min. Th organoids were expanded in CKDCI medium containing various growth factors including 10 μM Y27632 (Tocris, 1254), 3.5 μM CHIR99021, 10 ng/ml FGF7 (Peprotech, USA; 100-19), 50 nM dexamethasone (Sigma-Aldrich, D4902), 100 μM 8-bromo-cAMP (Tocris, 1140/50), and 100 μM IBMX (Sigma-Aldrich, I5879). The organoids were sub-cultured every 2 weeks.
Cells and viruses
MDCK (NBL-2) and Vero E6 (CRL-1586) cells were purchased from the American Type Culture Collection (Manassas, VA, USA) and maintained in Minimum Essential Medium Eagle (MEM) and Dulbecco’s modified Eagle’s medium (DMEM), respectively, supplemented with 10% fetal bovine serum (FBS) and 1% penicillin/streptomycin (Gibco). The SARS-CoV-2 strains used in the study, hCoV-19/Korea/KDCA119861/2021 (delta) and hCoV-19/Korea/KDCA447321/2021 (omicron) were obtained from the National Culture Collection for Pathogens at the Korea National Institute of Health (KNIH). The FLUAV/H1N1pdm09 strain (A/Korea/01/2009, KR01) used in this study was a Korean isolate (DOI: 10.1007/s12275-010-0120-z) and the seasonal influenza vaccine strain H3N2 A/Switzerland/9715293/2013 (SW293) was provided by the World Health Organization (WHO) collaborating Center, National Institute of Infectious Diseases (NIID).
SARS-CoV-2 virus was propagated and titrated in Vero E6 cells while the FLUAV was grown in 10-day-old specific pathogen-free embryonated hen’s eggs. We confirmed there was no deletion of furin cleave site in SARS-CoV-2 variants following adaptation to cell culture. All virus stocks were stored at −70°C until use. All experiments involving infectious virus strains were performed in biosafety level 3 (BSL-3) facilities at the KNIH, following appropriate protocols.
Virus infection
Alveolar type II organoids (1 × 10⁵ cells) were infected with viruses at a MOI of 0.1 at 37°C for 1 h. After the virus inoculum was removed, cells were embedded in Matrigel and maintained in CKDCI medium supplemented with 1 μg/ml TPCK-treated trypsin (Sigma-Aldrich) for 2 days. The culture medium was collected at the indicated time point for measuring, SARS-CoV-2 titre using the plaque assay. The culture media was also used for measuring the secretory cytokines or proteins by cytokine profile array or enzyme-linked immunosorbent assay (ELISA) method.
RNA preparation and real-time quantitative PCR (RT-qPCR)
Total RNA was prepared from virus-infected organoids using TRIzol™ Reagent (Invitrogen, Carlsbad, CA, USA) following the manufacturer’s instructions and the cDNA was synthesized using RNA to cDNA EcoDry Premix (Clontech, CA, USA). The expression level of each gene was measured by PowerUP SYBR Green Master Mix (Applied Biosystems, Foster City, CA, USA) on a QuantStudio 6 Flex Real-Time PCR system (Applied Biosystems). The expression of each gene was normalized to glyceraldehyde-3-phosphate dehydrogenase (GAPDH) and the data was analysed by relative quantification method (2-ΔΔCt). To detect FLUAV from hiAT2 organoids, the matrix (M) gene of FLUAV was amplified using a PowerChek™ Influenza A/B Realtime PCR kit (Kogen, Seoul, Korea) according to the manufacturer’s instructions. Primer sequences used for real-time PCR are provided in Supplementary Table 1. The matrix gene copy number was calculated using a standard curve generated using plasmid DNA with matrix gene [Citation24]. The matrix gene Ct value was normalized with GAPDH Ct value (internal housekeeping gene) prior to calculation of copy number. The data is presented as fold-change compared to the un-infected samples.
Plaque assay
To determine SARS-CoV-2 titres, a plaque assay was performed in Vero E6 cells. Briefly, cells were seeded in 12-well culture plates at a density of 2 × 10⁵ cells per well on 1 d before performing the plaque assay. The virus was diluted 10-fold in DMEM lacking fetal bovine serum (FBS) and incubated on monolayers of cells at 37°C in 5% CO2 for 1 h. The inoculum was then removed and replaced with overlay medium containing 2% low melting point agarose and 2× MEM (Gibco) supplemented with 4% FBS and 2% penicillin/streptomycin. The plates were incubated at 37°C in 5% CO2 for 3 days. Thereafter, cells were fixed with 4% paraformaldehyde, and cytopathic plaques were visualized by staining the cell monolayers with 1% crystal violet solution.
Immunocytochemistry
Matrigel-embedded hiAT2 organoids were collected and centrifuged (3000 rpm for 3 min) and then treated with VitroGel Cell Recovery Solution (TheWell Bioscience, NJ, USA MS03-100) for 15 min at 37°C to dissociate the cells from the Matrigel. The dissociated cells were fixed with 4% paraformaldehyde (20 min at room temperature), blocked using 10% donkey serum and then incubated overnight with primary antibody at 4°C. The primary antibodies used are listed in Supplementary Table 2. After washing, the cells were incubated with anti-mouse Alexa Fluor 488-conjugated or anti-rabbit Alexa Fluor 594-conjugated secondary antibodies (Vector Laboratories, CA, USA). Finally, the nuclei were stained with Hoechst (Invitrogen, 33342) and visualized using a Zeiss LSM880-Airyscan Elyra confocal microscope or a confocal laser-scanning microscope (Olympus Corp., Tokyo, Japan; FV3000).
Western blotting
The organoids were lysed in RIPA lysis and extraction buffer (Thermo Fisher Scientific, USA) containing protease inhibitor cocktail (Roche, IN, USA) and the protein concentration was measured using a BCA Protein Assay kit (Thermo Fisher Scientific). The lysates were separated by sodium dodecyl sulfate-polyacrylamide gel electrophoresis and transferred to PVDF membranes (Thermo Fisher Scientific). The membrane was then blocked with Western Blocker™ solution (Sigma-Aldrich) for 1 h at room temperature followed by incubation with primary antibodies against ACE2, TMPRSS2, and β-actin overnight at 4°C (see Supplementary Table 2). Next day, the membranes were washed and then incubated with secondary antibodies. Finally, the protein bands were detected using an Amersham Imager 600 (GE Life Sciences, UK).
Analysis of single-cell RNA sequencing data
The fifteen domes embedding hiAT2 organoids were collected in an 1.5 ml Eppendorf tube and cells were extracted by disrupting the Matrigel by gently pipetting and washed with cold DPBS. Next, the cell pellets were incubated in 0.5 mM EDTA solution for 7 min at 37°C, washed with cold DPBS and then the cell viability was assessed. The cells were processed for droplet-based RNA-seq using the Chromium single cell 3’ reagent kits version 3 (10x Genomics). Using Cell Ranger pipelines (v.6.1.2; 10x Genomics) and the hg38 human reference genome, the sequenced reads were demultiplexed, mapped, and quantified into UMI-filtered counts. The raw counts data of the filtered cells were further analysed with the Seurat (version 4.3.0) [Citation25,Citation26]. For additional quality control of the extracted gene-cell matrices, we filtered cells with >200 and <2500 detected genes per cell (nFeature RNA) and a threshold of less than 25% for mitochondrial genes (percent.mito). In the Seurat package, raw counts were normalized with the log-normalize method and scaled with the ScaleData function. The Seurat RunTSNE function with default parameters (except dims = 1:30) and the “FindClusters” function with resolution 0.8 were used to perform dimension reduction and clustering. P-value 0.05 and twofold change were used to define DEGs. We performed functional enrichment tests for GO [Citation27] to describe the biological processes of each cluster.
Analysis of bulk RNA sequencing data
A TruSeq Stranded mRNA Library Prep Kit (Illumina, San Diego, CA, USA) was used to prepare the library, which was then run on an Illumina NovaSeq6000 sequencer with a 101 bp paired-end read length. To map reads against the reference genome (hg38 for human), the raw data were processed using the STAR 2.6.1d aligner [Citation20]. Salmon [Citation28] was used to quantify gene expression levels, which were then log transformed (log2(TPM + 1)) for Heatmap visualization. Using the counted reads and the estimateDisp function in R package edgeR [Citation29] version 3.40.2, a list of differentially expressed genes was generated. The R package ReactomePA was used to conduct gene set enrichment analysis [Citation30].
Cytokine array and ELISA
Cytokine profiles of organoids infected with SARS-CoV-2 and FLUAV were compared using a Proteome Profiler Human XL Cytokine Array Kit (R&D Systems, ARY022B), according to the manufacturer’s instructions. Array spots were detected and quantified using an Amersham Imager 600 (GE Life Sciences). Concentrations of cytokines were measured using ImageJ and normalized against reference spots. The concentration of IL-6 in the culture medium was measured with an ELISA kit (Invitrogen) according to the manufacturer’s instructions.
DNA transfection
hiAT2 organoids and Vero E6 cells were plated on a 24-well plate at density of 1 × 10⁵ cells/well and 3 × 10⁴ cells/well respectively in the indicated growth medium for 24 h before transfection. Around 1μg of pHW2000 vector containing each of the 8 genes (PB2, PB1, PA, HA, NP, NA, M, NS) of FLUAV (H1N1 strain) was complexed with 2μl of Lipofectamine 3000 (Invitrogen, USA) and 1.5 μl of P3000 in the Opti-minimal essential medium (Opti-MEM, Thermo fisher scientific, USA) as recommended by manufacturer and incubated at 37°C in a humidified incubator with 5% CO2. After 48 h incubation, the cells were washed with PBS and lysed for RNA preparation. All transfection assay was carried out in triplicate.
Data representation and statistical analysis
The student’s t-test was used to analyze differences between two groups. A one- or two-way analysis of variance (ANOVA) with Tukey’s multiple comparisons test was used to analyze intergroup differences. P < 0.05 was considered statistically significant. Statistical analysis was performed using GraphPad 8 (GraphPad software). Densitometry analysis of Western blot images and membrane array were performed using ImageJ. Data are presented as mean ± standard deviation (SD).
Results
Generation and characterization of hiAT2 organoids
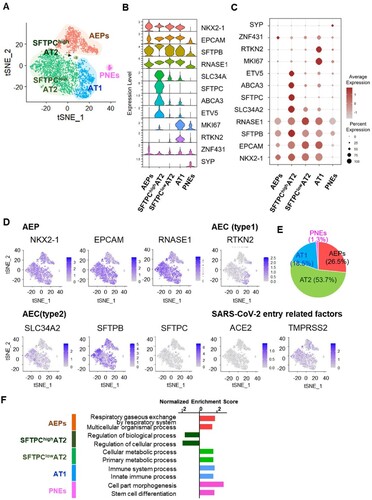
We generated hiAT2 organoids from human embryonic stem cell line H9 following a previously reported method [Citation23]. We slightly modified the original protocol [Citation23,Citation31] to generate hiAT2 organoids from CD47hi/CD26- population [Citation31] ((A)). CD47hi/CD26- cells embedded in Matrigel formed AT2-like cells, as confirmed by expression of canonical AT2 cell markers, surfactant protein-C (SFTPC), surfactant protein-D (SFTPD), and epithelial cell adhesion molecule (EPCAM). A few cells also expressed AQP5, a marker of alveolar type I cells ((B)). Next, we evaluated whether hiAT2 organoids expressed SARS-CoV-2 entry related proteins, ACE2 and TMPRSS2. The hiAT2 organoids showed high expression of surface receptors, ACE2 and TMPRSS2 at both the mRNA and protein levels ((B–D)). In addition, cell receptors of FLUAV, α-2,6-Gal sialic acid and α-2,3-Gal sialic acid were also expressed by organoid cells ((B)). As expected, the expression of OCT4, a pluripotency marker of PSC, was markedly reduced in differentiated hiAT2 organoids ((C)). Single cell transcriptomic analysis of hiAT2 organoid revealed five different cell-type clusters representing: alveolar epithelial progenitors (AEPs), type 2 alveolar epithelial cells (AT2) with high SFTPC expression (SFTPChigh AT2), AT2 with low SFTPC expression (SFTPClowAT2), type 1 alveolar epithelial cells (AT1) and pulmonary neuro-endodermal cells (PNEs) ((A–E)). The violin plot ((B)) and dot plot ((C)) displayed the distribution of expression levels of specific markers corresponding to each cell-type cluster indicating the composition of hiAT2 organoids with multiple cell types. The tSNE plot was used to visualize the distribution of various cell-types in hiAT2 organoids based on their expression of specific markers such as SFTPC, SFTPB, SLC34A2, and SYP [Citation32]. The results showed that the majority of cells in hiAT2 organoid expressed AT2 markers (SFTPC, SFTPB, SLC34A2; 53.7%), followed by AEPs markers (EPCAM, NKX2.1; 26.5%), AT1 marker (RTKN2; 18.5%), and PNEs markers (SYP; 1.3%) ((D–E)). The most distinct biological differences between AT1 and AT2 cells were related to differential expression of immune response related genes ((F)). We observed a stable ACE2 expression in hiAT2 organoids for at least up to 13 passages. (Supplementary Figure 1). Collectively, the data indicated that the hiAT2 organoids were composed predominantly of alveolar type II cells and demonstrated the potential of hiAT2 organoids for expansion and application for modeling of SARS-CoV-2 infection.
Figure 1. Characterization of hiAT2 organoids. (A) Schematic diagram illustrating differentiation protocol. The lower panel shows representative images of differentiated cells in each step. (B) Confocal image of immunofluorescence detection of alveolar type II cell markers (SFTPC and SFTPD), SARS-CoV-2 entry receptors (ACE2 and TMPRSS2), alveolar type I cell marker (AQP5), epithelial cell marker (EPCAM) and, FLUAV entry receptors (MALII and SNA) in hiAT2 organoids. Scale bars = 50 μm. (C) Relative mRNA expression of pluripotent stem cell marker, OCT4 and SARS-CoV-2 entry receptors, ACE2 and TMPRSS2 in hiAT2 organoids. Data are mean ± SD. n = 3 independent biological replicates and two technical replicates each. *p < 0.05, ***p < 0.001, unpaired Student’s t-test. (D) Protein levels of ACE2 and TMPRSS2 in hiAT2 organoids as determined by Western blotting.
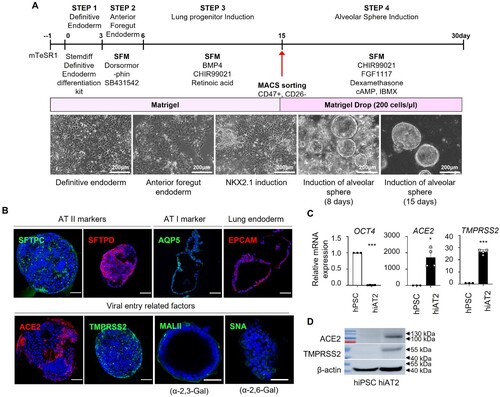
Figure 2. Single-cell transcriptome analysis of hiAT2 organoids. (A) Unsupervised tSNE clustering of uninfected hiAT2 organoid. (B) Single-cell RNA expression data across clusters displayed in violin plot. (C) The average expression levels of specific gene markers across the cells within the cluster presented by colour intensity and the extent of expression presented by the size of the dot. (D) Expression of genes showing general features of hiAT2 organoids in the dataset. (E) Composition of different cell-types in hiAT2 organoids. (F) Gene ontology analysis showing biological differences between the clusters.
Coinfection of FLUAV enhances SARS-CoV-2 infectivity and replication in hiAT2 organoids
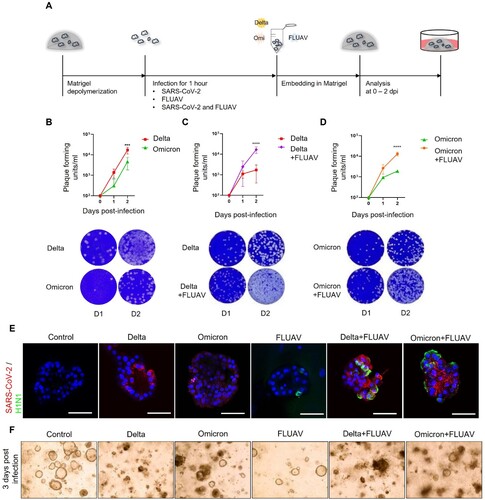
To determine if hiAT2 organoids are permissive to SARS-CoV-2 infection, we inoculated hiAT2 organoids with delta or omicron variant of SARS-CoV-2, as illustrated in (A). We observed a significant time-dependent increase in the titres of both SARS-CoV-2 variants in the organoids post-infection, indicating that hiAT2 organoids are permissive SARS-CoV-2 ((A,B)). Next, to study whether co-infection of SARS-CoV-2 and FLUAV impacts the replication of the former, we inoculated hiAT2 organoids with FLUAV alone, SARS-CoV-2 (delta or omicron) alone or FLUAV and SARS-CoV-2 together (simultaneously) ((A)). At 48 h post-infection, a plaque assay revealed significantly higher titres of both SARS-CoV-2 variants in hiAT2 organoids co-infected with FLUAV compared to organoids infected with respective single virus variants ((C,D)). Immunofluorescence staining revealed a greater accumulation of nucleocapsid protein of SARS-CoV-2 in co-infected hiAT2 organoid compared to organoid infected with a single SARS-CoV-2 variant ((E)), confirming higher SARS-CoV-2 viral replication in the former than the latter. In relation to the greater viral load, hiAT2 organoid co-infected with delta or omicron variant of SARS-CoV-2 and FLUAV also exhibited severely damaged cell morphology compared to cells infected with single virus ((F)). Of note, the expression of antiviral gene, MX1, a well-known responder to SARS-CoV-2 infection [Citation33] was highly expressed in hiAT2 organoid infected with SARS-CoV-2 variants, which was further increased in organoids co-infected with SARS-CoV-2 variant and FLUAV (Supplementary Figure 2). Together, the data indicates that co-infection with FLUAV enhances the replication of SARS-CoV-2 in hiAT2 organoids.
Figure 3. Infection of hiAT2 organoids with SARS-CoV-2 and FLUAV. (A) Schematic diagram illustrating infection process of hiAT2 organoids. (B) Plaque assay and representative images showing the replication of SARS-CoV-2 delta and SARS-CoV-2 omicron variant in hiAT2 organoids (n = 3) ***p < 0.001, Two-way ANOVA with Bonferroni’s multiple comparisons test. (C) Plaque assay and representative images showing replication of SARS-CoV-2 delta in hiAT2 organoids infected with SARS-CoV-2 delta alone or with FLUAV (Delta + FLUAV) (n = 3, independent experiments) ****p < 0.0001, Two-way ANOVA with Bonferroni’s multiple comparisons test. (D) Plaque assay and representative images showing replication of SARS-CoV-2 omicron in hiAT2 organoids infected with SARS-CoV-2 omicron alone or with FLUAV (Omicron + FLUAV) (n = 3, independent experiments). ****p < 0.0001, Two-way ANOVA with Bonferroni’s multiple comparisons test. (E) Confocal images of immunocytochemistry stained for SARS-CoV-2 viral particle and nucleoprotein of FLUAV (H1N1) in hiAT2 organoids infected with SARS-CoV-2 delta, SARS-CoV-2 omicron and/or with FLUAV. Scale bars = 50 μm. (F) Representative images of cell morphologies in hiAT2 organoids infected with SARS-CoV delta, SARS-CoV omicron and/or with FLUAV at 3 dpi.
FLUAV infection increases ACE2 expression
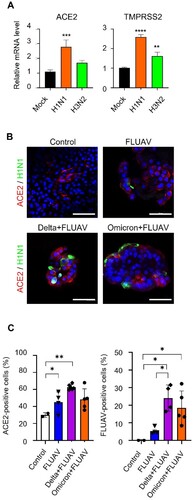
We next determined if FLUAV infection modulated the expression of SARS-CoV-2 entry receptors, ACE2 and TMPRSS2 in hiAT2 organoids, which are key determinants of SARS-CoV-2 infectivity. The mRNA levels of ACE2 and TMPRSS2 were increased by 2.78- and 2.59-fold respectively in hiAT2 organoids infected with H1N1 virus at 2 days post-infection (dpi) compared to mock control. We also investigated the effects of H3N2 strain on SARS-COV-2 receptors. H3N2 also significantly increased the expression of TMPRSS2 by 1.62-fold in hiAT2 organoids ((A)) compared to uninfected control. H3N2 infection increased the expression of ACE2, however it was not statistically significant compared to the uninfected control ((A)). Immunofluorescence staining confirmed the increased ACE2 protein expression ((B,C)) on the surface of hiAT2 organoid cells infected with FLUAV compared to uninfected control. These results suggested that FLUAV enhanced SARS-CoV-2 viral load in co-infected hiAT2 organoids by increasing the infectivity of SARS-CoV-2 through upregulation of ACE2 and TMPRSS2.
Figure 4. FLUAV infection increases ACE2 and TMPRSS2 in hiAT2 organoids. (A) Relative mRNA expression of SARS-CoV-2 entry receptors in hiAT2 organoids infected with FLUAV at 2 dpi. Data are mean ± SD. n = 4 independent biological replicates and four technical replicates each. ****p < 0.0001, ***p < 0.001, **p < 0.01, a one-way ANOVA with Tukey’s multiple comparisons test was performed to analyze intergroup differences. (B) Representative confocal images of hiAT2 organoids stained for ACE2 and nucleoprotein of FLUAV (H1N1). Control refers to uninfected cells. Scale bar = 50 µm. (C) Quantification of the percentage of positive cells in the confocal images of hiAT2 organoids infected with FLUAV alone, delta variant plus FLUAV, and omicron variant plus FLUAV. Data are mean ± SD; each dot indicates independent biological replicates. *p < 0.05, **p < 0.01, a one-way ANOVA with Tukey’s multiple comparisons test was performed to analyze intergroup differences.
Next, we sought to determine whether the whole virion, specific viral protein or RNA segment of FLUAV upregulates the expression of ACE2 and TMPRSS2 in hiAT2 organoids. The FLUAV genome contains eight individual single-stranded, negative-sense viral RNA segments that encode 10–17 proteins [Citation34], depending on the strain. To transfect hiAT2 organoids with individual viral RNA segments, we dissociated hiAT2 cells and then seeded them into the cell-culture plates. First, we transfected hiAT2 cells using the native pHW2000 vector and confirmed the transfection efficiency by detecting GFP expression (Supplementary Figure 3(A)). Transfection of hiAT2 cells and Vero E6 cells with bidirectional pHW2000 vector containing each of the eight viral RNA segments did not induce ACE2 and TMPRSS2 expression (Supplementary Figure 3(B,C)) compared to native plasmid control (vehicle). In contrast, infection with both strains of the FLUAV virus, H1N1 and H3N2, significantly upregulated the expression of ACE2 and TMPRSS2 in hiAT2 cells and Vero E6 cells, suggesting that viral infection, rather than individual viral protein or RNA segment, is necessary for the induction of these genes in host cells (Supplementary Figure 3(B,C)).
Coinfection with SARS-CoV-2 enhanced FLUAV replication in hiAT2 organoids
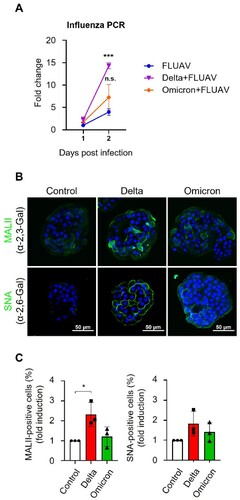
While studying co-infection SARS-CoV-2 and FLUAV in hiAT2 organoids, we also noticed that, besides SARS-CoV-2, the FLUAV titres were also significantly elevated in hiAT2 organoid ((A)). Specifically, the FLUAV titre was 3.58-fold higher in hiAT2 organoids co-infected with delta SARS-CoV-2 variant compared to hiAT2 organoids infected with FLUAV alone at 2 dpi. Similarly, FLUAV load showed an elevated trend in in hiAT2 organoids co-infected with the omicron SARS-CoV-2 variant compared to hiAT2 organoids infected with FLUAV alone, although not statistically significant ((A)). Collectively, the data presented in (B) and (A) demonstrate that SARS-CoV-2 and FLUAV reciprocally enhance the infection of each other.
Figure 5. SARS-CoV-2 infection enhances FLUAV replication and induces expression of α2,6-Gal sialic acid in hiAT2 organoids. (A) Fold change of replication of FLUAV in hiAT2 organoids infected with H1N1 alone and delta or omicron variants with FLUAV compared to FLUAV on day 1. Data are mean ± SD. n = 3; independent biological replicates and two technical replicates each. ***p < 0.001 for FLUAV vs. Delta + FLUAV at day 2 post infection. A one-way ANOVA with Tukey’s multiple comparisons test was performed to analyze intergroup differences. (B-C) MAL II (bind to α-2,3-Gal sialic acid) and SNA (bind to α-2,6-Gal sialic acid) positive cells in hiAT2 organoids infected with delta or omicron variant of SARS-CoV-2 by immunofluorescence analysis. Scale bar = 50 μm. Control refers to uninfected cells. The quantitative data are mean ± SD. n = 3 independent biological replicates. *p < 0.05 A one-way ANOVA with Tukey’s multiple comparisons test was performed to analyze intergroup differences.
SARS-CoV-2 infection upregulates an FLUAV entry receptor
Sialic acid linked to galactose through α-2,6 linkage (α-2,6 Gal sialic acid) or α-2,3 linkage (α-2,3 Gal sialic acid) are the cell surface receptors for FLUAV binding and entry, which are expressed in the upper and lower airways of human lungs. Since, SARS-CoV-2 coinfection in hiAT2 organoids enhanced FLUAV titres, we asked whether SARS-CoV-2 modulated the expression levels of FLUAV entry receptors in hiAT2 organoid cells. Inoculation of SARS-CoV-2 delta variant alone significantly increased the expression of α-2,3-Gal sialic acid receptors in hiAT2 organoids compared to uninfected hiAT2 organoid as indicated by staining with biotinylated Maackia Amurensis Lectin II (MAL II), a glycoprotein that preferentially binds to sialic acid in an α-2,3 linkage. The expression of α-2,6-Gal sialic acid receptor, as indicated by fluorescein isothiocyanate-labelled Sambucus Nigra Lectin (SNA) staining (preferentially binds to sialic acid with the α-2,6 linkage) was slightly elevated but statistically insignificant ((B,C); Supplementary Figure 4) in hiAT organoids infected with the SARS-CoV-2 delta variant alone. The expression of α-2,3-Gal and α-2,6-Gal sialic acid receptors in hiAT2 organoids infected with the omicron variant of SARS-CoV-2 exhibited a modest, yet insignificant increase compared to the control ((B,C); Supplementary Figure 4). Together, the data suggest that increased FLUAV load in hiAT2 organoids co-infected with SARS-CoV-2 may be partly mediated by enhanced infectivity of FLUAV in organoid cells due to increased expression of α-2,3-Gal sialic acid receptor.
SARS-CoV-2 and FLUAV coinfection causes hyperactivation of proinflammatory signalling pathways
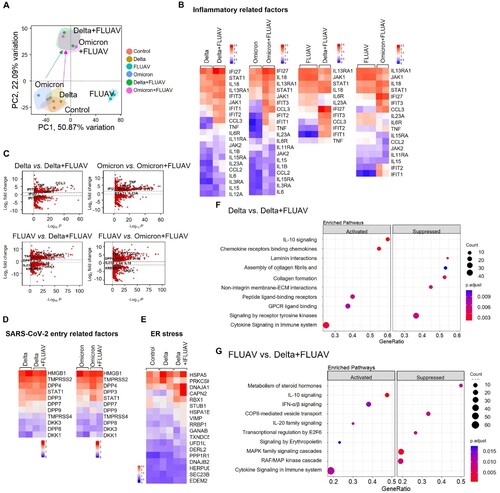
To understand the intrinsic immune responses in hiAT2 organoids to SARS-CoV-2 variants (delta or omicron), FLUAV or both, we performed RNA-sequencing (RNA-seq) at 1 dpi. Principle component analysis of genome-wide differences showed that hiAT2 organoids infected with delta or omicron SARS-CoV-2 variant alone had distinct transcriptomic profiles compared with those coinfected with FLUAV ((A)). Heatmap visualization and a volcano plot of DEGs (│log2FC│ ≥ 1, p-value < 0.001) showed that interferon-induced protein with tetratricopeptide repeats (IFIT) genes such as IFIT1, IFIT2, and IFIT3 were significantly upregulated by delta SARS-CoV-2 variant compared to control (day 0) and the expression of the same genes were further increased in hiAT2 organoids coinfected with delta SARS-CoV-2 variant and FLUAV ((B,C); Supplementary Figure 5(A,B)). In addition, proinflammatory cytokines including interleukin (IL)−1β, tumour necrosis factor (TNF), IL-6, C–C motif chemokine ligand 2 (CCL2), and C–C motif chemokine ligand 3 (CCL3) were highly expressed in hiAT2 organoids coinfected with delta SARS-CoV-2 and FLUAV compared with those infected with delta SARS-CoV-2 alone ((B,C)). In general, the expression of the proinflammatory genes were also augmented in hiAT2 organoids coinfected with omicron SARS-CoV-2 and FLUAV compared to omicron SARS-CoV-2 alone. Similarly, FLUAV infection in hiAT2 organoids elevated the expression of pro-inflammatory related genes, such as IL18, STAT1, IFI27 IFIT3, CCL3, IFIT2, IFIT1, and TNF. This elevation was further observed in hiAT2 organoids co-infected with FLUAV and SARS-CoV-2 virus (Figure (B, C), Supplementary Figure 5(A,B)). Interestingly, dipeptidyl-peptidase (DPP4), the MERS-CoV entry receptor, and dickkopf-related protein 1 (DKK1), a severe lung damage marker in patients infected with SARS-CoV-2 [Citation35], were also markedly upregulated in co-infected organoids compared to single virus infected organoids ((D)). Besides inflammation- and immune-related gene sets, endoplasmic reticulum (ER) stress-related genes were also enriched in organoids infected with the delta SARS-CoV-2 variant compared to control organoids. Moreover, the expression levels of the same genes were further elevated in organoids co-infected with FLUAV ((E)). Previous studies have reported that SARS-CoV-2 infection induces ER stress in cell lines (Vero E6 cells) and in COVID-19 patients’ lungs [Citation36]. Induction of ER stress impairs SARS-CoV-2 replication [Citation37], and therefore, ER stress is regarded as a host antiviral defence mechanism [Citation38]. Reactome pathway analysis revealed that interferon-, cytokine-, and interleukin- signalling was activated in hiAT2 organoids co-infected with SARS-CoV-2 and FLUAV, whereas cellular maintenance-related pathways such as cell cycle and metabolism were suppressed. ((A)). On the other hand, cytokine signalling in the immune system, including IL-10 signalling and interferon alpha/beta signalling, was highly activated in hiAT2 organoids co-infected with SARS-CoV-2 delta variant and FLUAV compared to FLUAV alone. However, this enhanced immune response feature was not observed in hAT2 organoids co-infected with omicron variant and co- FLUAV compared to FLUAV alone ((F,G), Supplementary Figure 5(C)). Collectively, the RNA seq data demonstrated that co-infection of hiAT2 organoids with SARS-CoV-2 and FLUAV triggered an augmented inflammatory and immune responses compared to organoids with a single virus infection.
Figure 6. RNA-sequencing analysis of hiAT2 organoids infected with SARS-CoV-2 variant and/or FLUAV. (A) Principal component analysis of differential gene expression in hiAT2 organoids infected with delta SARS-CoV-2, omicron SARS-CoV-2 and/ or with FLUAV (H1N1) (n = 2 or, n = 3 biological replicates per condition). Control refers to uninfected organoids (B) Heatmap of inflammatory gene sets in in hiAT2 organoids infected with delta SARS-CoV-2, omicron SARS-CoV-2 and/ or with FLUAV (H1N1). (C) Volcano plots showing DEGs between delta alone vs. delta plus FLUAV; omicron alone vs. omicron plus FLUA; FLUAV alone vs. delta plus FLUAV; FLUAV alone vs. omicron plus FLUAV. (D) Heatmap of “SARS-CoV-2 entry receptor-related genes” in organoids infected with SARS-CoV-2 variant (delta or omicron) alone or with FLUAV (E) Heatmap displaying “ER stress-related genes” in uninfected organoids (control) or hiAT2 organoids infected with delta variant and delta variant plus FLUAV. (F) Reactome pathway analysis of hiAT2 organoids infected with SARS-CoV-2 delta variant alone and together with FLUAV (H1N1) using DEGs. (G) Reactome pathway analysis of hiAT2 organoids infected with FLUAV (H1N1) alone and together with delta variants using DEGs.
Enhanced IL-6 secretion in hiAT2 organoids coinfected with SARS-CoV-2 and FLUAV
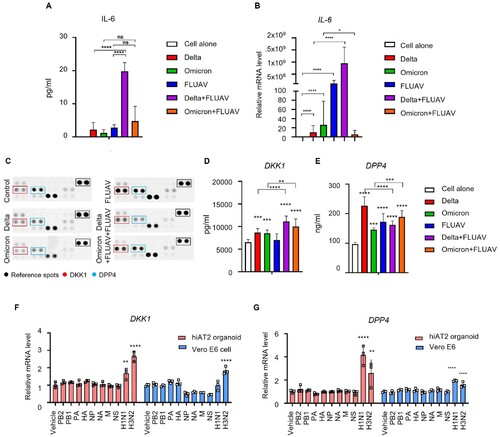
Co-infection with SARS-CoV-2 and FLUAV in hiAT2 organoids increased the transcriptional levels of several inflammatory cytokines. We then measured the secretory levels of selected inflammatory cytokines in hiAT2 organoids co-infected with SARS-CoV-2 and FLUAV. Although we analyzed the secretory levels of IL-6, IL-1α, IL-1β, and TNF-α in hiAT2 organoid cultures after single virus infection or co-infection, except for IL-6, none of the cytokines were detectable (data not shown). The secretion of IL-6 was markedly higher in hiAT2 organoids co-infected with the delta variant of SARS-CoV-2 and FLUAV compared to respective single virus infections ((A)). Consistent with the secretory protein levels, the mRNA level of IL-6 was significantly higher in hiAT2 organoids co-infected with the delta variant of SARS-CoV-2 and FLUAV than in those infected with each virus alone ((B)). Interestingly, in contrast to co-infection with the delta variant of SARS-CoV-2 and FLUAV, the secretion of IL-6 was not augmented following co-infection with the omicron variant and FLUAV compared to omicron or FLUAV alone ((B)).
Figure 7. Increase in IL-6, DKK1 and DPP4 levels in hiAT2 organoids coinfected with SARS-CoV-2 and FLUAV. (A-B) IL-6 expression (protein (A) and mRNA (B)) in hiAT2 organoids infected with SARS-CoV-2 alone (delta or omicron variant), FLUAV alone or co-infected with SARS-CoV-2 variants with FLUAV. Data are mean ± SD. n = 3 independent biological replicates and two technical replicates each. ****p < 0.0001, one-way ANOVA with Tukey’s multiple comparisons test was performed to analyze intergroup differences. (C) Proteome cytokine array (DPP4 and DKK1) in hiAT2 organoids infected with SARS-CoV-2 alone (delta or omicron variant), FLUAV alone or co-infected with SARS-CoV-2 variants with FLUAV. (D-E) Secreted DKK1 (D) and DPP4 (E) levels in the culture media of hiAT2 organoids infected with SARS-CoV-2 alone (delta or omicron variant), FLUAV alone or co-infected with SARS-CoV-2 variants with FLUAV. (F-G) mRNA expression of DKK1 and DPP4 in hiAT2 organoids and Vero E6 cells transfected with plasmid containing cDNA for each of the eight viral RNA segments or infected with whole virion (H1N1 and H3N2) at 1-day post-infection.
DPP4 and DKK1 were highly produced by co-infection in hiAT2 organoids
Next, we used the Proteome Profiler Human XL Cytokine Array Kit to identify any other cytokines and soluble proteins whose secretion was altered by coinfection. In agreement with RNA-seq data, upon infection with either of the SARS-CoV-2 variants, the secretory levels of DPP4, (a MERS-CoV entry receptor), and DKK1, a marker of damaged lungs [Citation39,Citation40], were significantly elevated compared to un-infected organoids.
The levels of DKK1 were significantly elevated in hiAT2 organoids by both delta and omicron SARS-CoV-2 variants, and the increase was further enhanced in hiAT2 organoids coinfected with FLUAV and omicron or delta SARS-CoV-2 variants. The levels of DPP4 were also significantly elevated in hiAT2 organoids infected with omicron or delta variant alone compared to mock-infected organoids. In contrast, co-infection with FLUAV and omicron variant induced an increase in the secretory level of DPP4, while no significant change was observed in co-infection with FLUAV and delta variant ((C–E)). Infection with FLUAV alone increased the secretion of DPP4 but not DKK1. In contrast to protein levels, mRNA levels of DPP4 and DKK1 was significantly induced in hiAT2 (2D) cells infected with FLUAV alone ((F,G)). This discrepancy between protein and mRNA expression of DKK1 is likely due to temporal variations in the expression levels. We also found that the mRNA expression of DKK1 and DPP4 was not induced by any specific gene segment but was induced by the whole virion (H1N1 or H3N2) in both Vero E6 and hiAT (2D) cells ((F,G)).
Discussions
Recent evidence, albeit from a small number of studies [Citation41] indicates that individuals with SARS-CoV-2 and FLUAV co-infection have higher odds of developing more severe respiratory failure and mortality compared to patients infected with either SARS-CoV-2 or FLUAV alone. Although the global burden of SARS-CoV-2 and FLUAV co-infection is still emerging, the paucity of mechanistic data related to biology of co-infection by SARS-CoV-2 and FLUAV poses a major barrier in understanding the rate of transmission, clinical outcomes, disease severity, and development of new therapeutics [Citation1,Citation2] as we enter into the next influenza season. Various immortalized cell lines have been widely used to understand the infection biology and tropism of SARS-CoV-2 or FLUAV. The common cell lines used include Vero E6 (derived from kidney of African green monkey), A549 (derived from type II pneumocyte lung tumour) [Citation16], Calu-3 (isolated from human lung adenocarcinoma), and MDCK (derived from kidney of normal cocker spaniel) [Citation42]. Few studies have used these cell lines to understand the underlying biology of SARS-CoV-2 and FLUAV coinfection, however the results are contradictory. Oishi et al., [Citation43] reported that FLUAV suppresses SARS-CoV-2 replication in ACE2-overexpressing A549 cells and Vero E6 cells. The same study demonstrated that SARS-CoV-2 does not influence FLUAV infectivity in Vero cells but restricted in an ACE2-overexpressing A549 cell line [Citation43]. In contrast, study by Bai et al., demonstrated that pre-infection with FLUAV increases SARS-CoV-2 infectivity in A549, Calu-3 cells, and normal human bronchial epithelial cells [Citation44]. The evidence from animal models, such as K18-hACE2 transgenic mice and hamster, of co-infection with SARS-CoV-2 and FLUAV was also conflicting. In K18-hACE2 transgenic mice, co-infection by FLUAV and SARS-CoV-2 induced greater viral load of SARS-CoV-2 and severe lung injury compared to mice infected with FLUAV or SARS-CoV-2 alone [Citation45]. Oishi et al., reported that the replication of SARS-CoV-2 but not FLUAV was reduced in hamster co-infected by FLUAV and SARS-Cov-2 [Citation43]. Kinoshita et al., reported a prolonged pneumonia in hamsters co-infected with FLUAV and SARS-CoV-2 compared to controlled animals infected with SARS-CoV-2 alone [Citation45]. However, there was no significant differences in the titres of the two viruses’ post-infection. These contradictory results maybe a consequence of the use of different cell model systems that are physiologically less relevant to studying the biology of SARS-CoV-2 and FLUAV co-infection. Here, we have developed a hiAT2 organoid model composed of alveolar type 2 cells expressing ACE2 for studying the biology of co-infection by SARS-CoV-2 and FLUAV. We demonstrated that the hiAT2 organoid was permissive to simultaneous infection by both viruses and provided the first experimental evidence that co-infection of SARS-CoV-2 and FLUAV promotes not only SARS-CoV-2 replication but also FLUAV replication.
Co-infection with influenza virus has been linked to an earlier and more severe cytokine storm in patients with severe COVID-19 [Citation3]. In hiAT2 organoid model, we found that co-infection with FLUAV and SARS-CoV-2 led to enhanced increase in inflammatory cytokines and chemokines such as IFI27, IL-6, IL-8, CCL3, and TNF, which are associated with severe COVID-19 cases [Citation46–48]. Moreover, gene ontology data of co-infected organoids suggested that immune responses are highly activated by co-infection compared to single virus infection. This data support that the developed human alveolar type II organoid platform recapitulates immunopathological features of alveolar epithelial injury during co-infection of SARS-CoV-2 with FLUAV and hence, could be valuable tool in mechanistic understanding of infectivity, transmission, and pathobiology of alveolar injury.
Matrigel are used to maintain the morphology and characteristics of organoids [Citation49]. However, Matrigel often blocks the free movement of certain viruses and proteins released by organoids, thus limiting the use of organoids culture for specific viral infection assays. In our studies, we observed that the viral particles of SARS-CoV-2 (delta and omicron) variants released from hiAT2 organoids readily crossed the Matrigel, as indicated by the infectivity of the supernatant derived from these organoids in Vero E6 cells (plaque assay). In contrast, FLUAV particles released from hiAT2 organoids were unable to penetrate the Matrigel, and hence the supernatant derived from these organoids did not exhibit infectivity in MDCK cells (Supplementary Figure 6). Therefore, the titre of FLUAV in hiAT2 organoids was confirmed by RT-qPCR analysis ((A)). It is important to note that the addition of tolysulfonyl phenylalanyl chloromethyl ketone (TPCK)-treated trypsin [Citation50,Citation51] to the culture media of Matrigel increased the FLUAV replication in hiAT2 organoids, suggesting that TPCK-treated trypsin easily penetrated the Matrigel barrier and modulated organoid cells (Supplementary Figure 7). Another limitation of Matrigel based organoid culture system would be the batch-to-batch variations in susceptibility to SARS-CoV-2 infection. We performed several repeated experiments and observed that infectivity of both delta and omicron variant ranged from 103 pfu/m scale to 104 pfu/m scale, although the relative infectivity between the two viruses remained similar. This batch to batch variation in infectivity could be partly attribute to variability in composition as well as mechanical and biochemical properties of Matrigel.
The alveolar sac is composed of alveolar type 2 cells, which play a crucial role in secreting surfactant proteins and immune-related cytokines [Citation52]. During lung injury, alveolar type 2 cell differentiate into type 1 cells and mediate repair and regeneration. In our study, we monitored whether the infection elicits changes in hiAT2 characteristics. Unlike lung fibrosis, acute lung injury or chronic inflammatory condition, FLUAV infection did not show significant changes in the overall characteristics of hiAT2 organoids (Supplementary Figure 8). To further elucidate whether FLUAV infection changes cell type’ composition and their characteristics we need further studies.
The surface expression of ACE2, along with the protease TMPRSS2, is essential for entry of SARS-CoV-2 into host cells [Citation53]. Host cells with higher expression of ACE2 and TMPRSS2 show enhanced binding and susceptibility to SARS-CoV-2 infection [Citation53]. FLUAV binds and enters host lung cells using α−2,6-Gal sialic acid or α−2,3-Gal sialic acid receptors. We found that the surface expression of ACE2 and TMPRSS2 was markedly elevated in hiAT2 organoids when infected with H1N1 or H3N2 strains on day 2 post-infection compared to mock ((A)). Intriguingly, the expression of α−2,3-Gal sialic acid also increased in hiAT2 organoids following infection with the SARS-CoV-2 delta variant. Although, the underlying mechanisms remain unclear, the data suggest that SARS-CoV-2 and FLUAV mutually regulate the expression of each other’s entry receptors, which explains the increased replication of both virus in hiAT2 organoids during co-infection. DKK1 is highly expressed in the epithelial cells of severe COVID-19 patients [Citation35]. Interestingly, DKK1 has high affinity to KREMEN1, which was recently identified as an alternative functional receptor of SARS-CoV-2 [Citation54]. KREMEN1 influences SARS-CoV-2 entry into host cells independent of ACE2 [Citation55]. Although it needs to be proven, we speculate that elevated DKK1 expression stimulated by FLUAV may also facilitate entry and influence replication of SARS-CoV-2.
Although global vaccination effort against SARS-CoV-2 has greatly reduced its transmission and clinical severity, it is not far from truth to predict that the SARS-CoV-2 may not completely disappear from the community. Several factors seem to support this argument including disparity in global vaccination programs, vaccination hesitancy and waning of immunity in vaccinated and naturally infected individuals. It is indeed possible that SARS-CoV-2 could evolve into an endemic virus, leading to seasonal outbreaks of COVID-19. This could potentially overlap with the influenza season, resulting in a “twindemic” of both viruses. The hiAT2 organoid model developed in the study could be valuable tool for studying the effects of co-infection with both viruses and for discovering and developing newer therapeutics against both.
Supplemental Material
Download MS Word (10.9 MB)Supplemental Material
Download MS Word (20.4 KB)Disclosure statement
No potential conflict of interest was reported by the author(s).
Correction Statement
This article has been corrected with minor changes. These changes do not impact the academic content of the article.
Additional information
Funding
References
- Dao TL, Colson P, Million M, et al. Co-infection of SARS-CoV-2 and influenza viruses: a systematic review and meta-analysis. J Clin Virol Plus. 2021;1(3):100036.
- Li Z-N, Liu F, Jefferson S, et al. Multiplex detection of antibody landscapes to severe acute respiratory syndrome coronavirus 2 (SARS-CoV-2)/influenza/common human coronaviruses following vaccination or infection with SARS-CoV-2 and influenza. Clin Infect Dis. 2022;75:S271–S284.
- WHO coronavirus (COVID-19) Dashboard. Available online: https://covid19.who.int/ [cited 11 Mar 2023].
- Dadashi M, Khaleghnejad S, Abedi Elkhichi P, et al. COVID-19 and influenza co-infection: a systematic review and meta-analysis. Front Med. 2021;8:971.
- Stowe J, Tessier E, Zhao H, et al. Interactions between SARS-CoV-2 and influenza, and the impact of coinfection on disease severity: a test-negative design. Int J Epidemiol. 2021;50(4):1124–1133.
- Kim D, Quinn J, Pinsky B, et al. Rates of co-infection between SARS-CoV-2 and other respiratory pathogens. Jama. 2020;323(20):2085–2086.
- Cheng Y, Ma J, Wang H, et al. Co-infection of influenza A virus and SARS-CoV-2: a retrospective cohort study. J Med Virol 2021;93(5):2947–2954.
- Hashemi SA, Safamanesh S, Ghasemzadeh-Moghaddam H, et al. High prevalence of SARS-CoV-2 and influenza A virus (H1N1) coinfection in dead patients in Northeastern Iran. J Med Virol 2021;93(2):1008–1012.
- Kim E-H, Nguyen T-Q, Casel MAB, et al. Coinfection with SARS-CoV-2 and influenza A virus increases disease severity and impairs neutralizing antibody and CD4+ T cell responses. J Virol 2022;96(6):e01873–21.
- Swets MC, Russell CD, Harrison EM, et al. SARS-CoV-2 co-infection with influenza viruses, respiratory syncytial virus, or adenoviruses. Lancet. 2022;399(10334):1463–1464.
- Cuadrado-Payán E, Montagud-Marrahi E, Torres-Elorza M, et al. SARS-CoV-2 and influenza virus co-infection. Lancet. 2020;395(10236):e84.
- Soo RJJ, Chiew CJ, Ma S, et al. Decreased influenza incidence under COVID-19 control measures, Singapore. Emerg Infect Dis. 2020;26(8):1933.
- Feng L, Zhang T, Wang Q, et al. Impact of COVID-19 outbreaks and interventions on influenza in China and the United States. Nat Commun. 2021;12(1):3249.
- Rolfes MA, Talbot HK, McLean HQ, et al. Household transmission of influenza A viruses in 2021–2022. Jama. 2023;329(6):482–489.
- Flerlage T, Boyd DF, Meliopoulos V, et al. Influenza virus and SARS-CoV-2: pathogenesis and host responses in the respiratory tract. Nat Rev Microbiol. 2021;19(7):425–441.
- Chang C-W, Parsi KM, Somasundaran M, et al. A newly engineered A549 cell line expressing ACE2 and TMPRSS2 is highly permissive to SARS-CoV-2, including the delta and omicron variants. Viruses. 2022;14(7):1369.
- Abo KM, Ma L, Matte T, et al. Human iPSC-derived alveolar and airway epithelial cells can be cultured at air-liquid interface and express SARS-CoV-2 host factors. Biorxiv. 2020;2020–06.
- Choudhury S, Das A. Acellular liver scaffold promotes cell recruitment after heterotopic transplantation. Cytotherapy. 2021;23(1):1–9.
- Weinheimer VK, Becher A, Tönnies M, et al. Influenza A viruses target type II pneumocytes in the human lung. J Infect Dis 2012;206(11):1685–1694.
- Jacob A, Vedaie M, Roberts DA, et al. Derivation of self-renewing lung alveolar epithelial type II cells from human pluripotent stem cells. Nat Protoc. 2019;14(12):3303–3332.
- Deguchi S, Serrano-Aroca A, Tambuwala MM, et al. SARS-CoV-2 research using human pluripotent stem cells and organoids. Stem Cells Transl Med. 2021;10(11):1491–1499.
- Avior Y, Sagi I, Benvenisty N. Pluripotent stem cells in disease modelling and drug discovery. Nat Rev Mol Cell Biol. 2016;17(3):170–182.
- Jacob A, Morley M, Hawkins F, et al. Differentiation of human pluripotent stem cells into functional lung alveolar epithelial cells. Cell Stem Cell. 2017;21(4):472–488.
- Whelan JA, Russell NB, Whelan MA. A method for the absolute quantification of cDNA using real-time PCR. J Immunol Methods. 2003;278(1-2):261–269.
- Winkels H, Ehinger E, Vassallo M, et al. Atlas of the immune cell repertoire in mouse atherosclerosis defined by single-cell RNA-sequencing and mass cytometry. Circ Res 2018;122(12):1675–1688.
- Cochain C, Vafadarnejad E, Arampatzi P, et al. Single-cell RNA-Seq reveals the transcriptional landscape and heterogeneity of aortic macrophages in murine atherosclerosis. Circ Res 2018;122(12):1661–1674.
- Wu T, Hu E, Xu S, et al. clusterProfiler 4.0: A universal enrichment tool for interpreting omics data. The Innovation. 2021;2(3):100141.
- Patro R, Duggal G, Love MI, et al. Salmon provides fast and bias-aware quantification of transcript expression. Nat Methods. 2017;14(4):417–419.
- Chen Y, Lun AT, Smyth GK. From reads to genes to pathways: differential expression analysis of RNA-Seq experiments using Rsubread and the edgeR quasi-likelihood pipeline. F1000Res. 2016;20(5):1438.
- Yu G, He Q-Y. ReactomePA: an R/Bioconductor package for reactome pathway analysis and visualization. Mol Biosyst. 2016;12(2):477–479.
- Hawkins F, Kramer P, Jacob A, et al. Prospective isolation of NKX2-1–expressing human lung progenitors derived from pluripotent stem cells. J Clin Invest. 2017;127(6):2277–2294.
- Lakshminarasimha Murthy P, Sontake V, Tata A, et al. Human distal lung maps and lineage hierarchies reveal a bipotent progenitor. Nature. 2022;604(7904):111–119.
- Bizzotto J, Sanchis P, Abbate M, et al. SARS-CoV-2 infection boosts MX1 antiviral effector in COVID-19 patients. Iscience. 2020;23(10):101585.
- Li X, Gu M, Zheng Q, et al. Packaging signal of influenza A virus. Virol J 2021;18(1):1–10.
- Brian L, Andreoletti G, Oskotsky T. Transcriptomics-based drug repositioning pipeline identifies therapeutic candidates for COVID-19. Sci Rep. 2021;11(1):12310.
- Puzyrenko A, Jacobs ER, Sun Y, et al. Pneumocytes are distinguished by highly elevated expression of the ER stress biomarker GRP78, a co-receptor for SARS-CoV-2, in COVID-19 autopsies. Cell Stress Chap. 2021;26(5):859–868.
- Shaban MS, Müller C, Mayr-Buro C, et al. Multi-level inhibition of coronavirus replication by chemical ER stress. Nat Commun. 2021;12(1):1–20.
- Bartolini D, Stabile AM, Vacca C, et al. Endoplasmic reticulum stress and NF-kB activation in SARS-CoV-2 infected cells and their response to antiviral therapy. IUBMB Life. 2022;74(1):93–100.
- Jaschke NP, Funk AM, Jonas S, et al. Circulating Dickkopf1 parallels metabolic adaptations and predicts disease trajectories in patients with COVID-19. J Clin Endocrinol Metab. 2022.
- Wang W, Sindrewicz-Goral P, Chen C, et al. Appearance of peanut agglutinin in the blood circulation after peanut ingestion promotes endothelial secretion of metastasis-promoting cytokines. Carcinogenesis. 2021;42(8):1079–1088.
- Ozaras R, Cirpin R, Duran A, et al. Influenza and COVID-19 coinfection: report of six cases and review of the literature. J Med Virol 2020;92(11):2657–2665.
- Nelli RK, Kuchipudi SV, White GA, et al. Comparative distribution of human and avian type sialic acid influenza receptors in the pig. BMC Vet Res 2010;6(1):1–9.
- Oishi K, Horiuchi S, Minkoff JM, et al. The host response to influenza A virus interferes with SARS-CoV-2 replication during coinfection. J Virol 2022;96(15):e00765–22.
- Bai L, Zhao Y, Dong J, et al. Coinfection with influenza A virus enhances SARS-CoV-2 infectivity. Cell Res 2021;31(4):395–403.
- Kinoshita T, Watanabe K, Sakurai Y, et al. Co-infection of SARS-CoV-2 and influenza virus causes more severe and prolonged pneumonia in hamsters. Sci Rep. 2021;11(1):1–11.
- Ma S, Lai X, Chen Z, et al. Clinical characteristics of critically ill patients co-infected with SARS-CoV-2 and the influenza virus in Wuhan, China. Int J Infect Dis. 2020;96:683–687.
- Shojaei M, Shamshirian A, Monkman J, et al. IFI27 transcription is an early predictor for COVID-19 outcomes, a multi-cohort observational study. Front Immunol. 2023;13:7847.
- Valle DM, Kim-Schulze S, Huang H-H, et al. An inflammatory cytokine signature predicts COVID-19 severity and survival. Nat Med 2020;26(10):1636–1643.
- Yamamoto Y, Gotoh S, Korogi Y, et al. Long-term expansion of alveolar stem cells derived from human iPS cells in organoids. Nat Methods. 2017;14(11):1097–1106.
- Maharani F, Tan TM. The role of trypsin in the internalisation process of influenza H1N1 virus into Vero and MDCK cell. ITB J Sci. 2012;44:297–307.
- Fabian Z, O’Brien P, Pajęcka K, et al. TPCK-induced apoptosis and labelling of the largest subunit of RNA polymerase II in Jurkat cells. Apoptosis. 2009;14(10):1154–1164.
- Olajuyin AM, Zhang X, Ji H-L. Alveolar type 2 progenitor cells for lung injury repair. Cell Death Discov. 2019;5(1):63.
- Hoffmann M, Kleine-Weber H, Schroeder S, et al. SARS-CoV-2 cell entry depends on ACE2 and TMPRSS2 and is blocked by a clinically proven protease inhibitor. Cell. 2020;181(2):271–280.
- Gu Y, Cao J, Zhang X, et al. Receptome profiling identifies KREMEN1 and ASGR1 as alternative functional receptors of SARS-CoV-2. Cell Res 2022;32(1):24–37.
- Lim S, Zhang M, Chang TL. ACE2-Independent alternative receptors for SARS-CoV-2. Viruses. 2022;14(11):2535.