
Abstract
Aims:
This study investigated resistance evolution mechanisms of conjugated plasmids and bacterial hosts under different concentrations of antibiotic pressure.
Methods:
Ancestral strain ECNX52 was constructed by introducing the blaNDM-5-carrying IncX3 plasmid into E. coli C600, and was subjected to laboratory evolution under different concentrations of meropenem pressure. Minimal inhibitory concentrations and conjugation frequency were determined. Fitness of these strains was assessed. Whole genome sequencing and transcriptional changes were performed. Ancestral host or plasmids were recombined with evolved hosts or plasmids to verify plasmid or host factors in resistance evolution. Role of the repA mutation on plasmid copy number was determined.
Results:
Two out of the four clones (EM2N1 and EM2N3) exhibited four-fold increase in MIC when exposed to a continuous pressure of 2 μg/mL MEM (1/32 MIC), by down regulating expression of outer membrane protein ompF. Besides, all four clones displayed four-fold increase in MIC and higher conjugation frequency when subjected to a continuous pressure of 4 μg/mL MEM (1/16 MIC), attributing to increasing plasmid copy number generated by repA D140Y (GAT→TAT) mutation.
Conclusion:
Bacterial hosts and conjugative plasmids can undergo resistance evolution under certain concentrations of antimicrobial pressure by reducing the expression of outer membrane proteins or increasing plasmid copy numbers.
Disclaimer
As a service to authors and researchers we are providing this version of an accepted manuscript (AM). Copyediting, typesetting, and review of the resulting proofs will be undertaken on this manuscript before final publication of the Version of Record (VoR). During production and pre-press, errors may be discovered which could affect the content, and all legal disclaimers that apply to the journal relate to these versions also.Introduction
Antimicrobial resistance is a global issue. Bacteria have great genetic flexibility and develop resistance to almost all available antibiotics via mutating, obtaining resistance genes or changing gene expressions (1). Horizontal gene transfer (HGT) is a major evolutionary force for bacteria to acquire antimicrobial resistance genes. As an important approach of HGT, conjugative plasmids have facilitated the spread of antimicrobial resistance genes and exaggerated the issue. Among numerous conjugative plasmids, epidemic blaNDM-5-carrying IncX3 plasmid has attracted much attention because of its application crisis of antibiotics (2, 3).
Under selective pressure of certain antimicrobial drugs, bacteria and plasmids can undergo resistance evolution, leading to enhanced resistance. Cefiderocol, a novel siderophore cephalosporin, is designed to treat carbapenem-resistant bacteria. However, a study revealed that resistance emerged after approximately 2 weeks of treatment with cefiderocol for intra-abdominal infections caused by blaNDM-5-positive Escherichia coli (E. coli). The increased copy number of blaNDM-5 mediated its resistance to cefiderocol (4). In addition, E. coli MG1655 carrying the RK2 plasmid (containing tetracycline resistance genes) showed a 4-fold increase in minimum inhibitory concentration (MIC) to tetracycline and also evolved cross-resistance to chloramphenicol under tetracycline pressure (5).
The evolution of antibiotic resistance in host bacteria and plasmids under antibiotic pressure can not only lead to increased resistance in the host bacteria themselves, but also promote the emergence of multidrug-resistant (MDR) strains. Research has shown that compensatory mutations in host bacteria increase tolerance to plasmids, allowing the successful adaptation of Pseudomonas aeruginosa strain H2 as a host for the RP4 plasmid. This pre-adaptation also facilitates the persistence and spread of a range of MDR plasmids, including the genetically close IncP-1β plasmid pB10, as well as the genetically distant IncW plasmid Rsa and IncQ-1α plasmid RSF1010 (6). Other studies have demonstrated that the co-evolution of various bacterial hosts and plasmids in the presence of antibiotics can facilitate the development of new MDR strains. As an example, E. coli and Klebsiella pneumoniae initially co-evolved with distinct plasmids. However, when these evolved strains were cultured together, there was a higher likelihood of two different resistant plasmids being acquired by the same strain, leading to an increased incidence of MDR strains (7).
While resistance plasmids can help host bacteria cope with antibiotic pressure (8), they may also come with associated fitness costs, such as additional material and energy consumption (5). In other words, there is a trade-off between the benefits and costs brought by plasmids to bacterial hosts. Compensatory mutations can help resolve this conflict. For example, mutations in the bacterial two-component system gacA/gacS improved the persistence of the mercury-resistant plasmid pQBR103 (9). Mutations in the replication initiation protein gene trfA1 of the plasmid pMS0506 improved its stability (10). In the absence of selective pressure, plasmids are expected to be gradually lost. However, in the presence of selective pressure, bacteria and plasmids may undergo a process of mutual adaptation and co-evolution, which can enhance resistance levels and adaptability of both bacterial hosts and plasmids.
Since bacteria and plasmids are extensively exposed to antibiotic due to nonnegligible antibiotic pollution, comprehending the mechanisms of resistance evolution is crucial for reducing the emergence and spread of new resistance factors (11). Carbapenem-resistant plasmids with horizontal transferability pose a serious threat, but research on their evolution patterns and mechanisms under antibiotic pressure is still relatively limited. Antimicrobial resistance concerns are exemplified by the rapid increase in carbapenem-resistant Escherichia coli (CREC). NDM-5 is the predominant determinant conferring carbapenem resistance in CREC, and was encoded mainly by IncX3 plasmids (2, 12-14). The rapid emergence of blaNDM-5-carrying IncX3 plasmid positive CREC has been reported around the world (15-17). In this study, we investigated the laboratory evolution of E. coli C600 and a predominant resistant plasmid (blaNDM-5-carrying IncX3 plasmid) under various concentrations of meropenem pressure, aiming to unravel the underlying mechanisms behind the resistance evolution of bacterial and conjugative plasmid.
Materials and Methods
Bacterial strains, plasmids and evolution experiment
Clinical plasmid pNX52-NDM-5, an IncX3 plasmid carrying blaNDM-5, was conjugated into E. coli C600 to construct the ancestral strain Carbapenem-resistant E. coli (CREC) ECNX52. ECNX52 was continuously passaged on LB agar plates containing 1, 2 or 4 μg/mL meropenem for 100 days. In brief, a single bacterial clone was selected, resuspended in 1 mL of sterile PBS, diluted 10,000 times, and then 50 μL of the diluted bacterial suspension was plated on the homogenized antibiotic selective agar plate to allow single bacterial clone to grow on the plate for 16-18 hours. This cycle was repeated for 100 days to drive laboratory resistance evolution. Four parallel evolution experiments were conducted in each group.
Antimicrobial susceptibility testing
Minimum inhibitory concentrations (MICs) of meropenem (ApexBio, USA) were tested using micro-broth dilution method according to the guidelines of Clinical and Laboratory Standards Institute (CLSI) criteria (18). Strain E. coli ATCC 25922 was used as the quality control. OD600nm of final cultures was measured.
Conjugation experiments
Recipient strain E.coli BW25113 (pSTV28) carried a small untransferable chloramphenicol resistant plasmid pSTV28. Same amount (1 × 10⁷ CFU/mL, counted using the Sysmex UF-1000i™ Automated Urine Particle Analyzer; Tokyo, Japan) of mid-logarithmic phase ancestral or evolved strains and recipient strain were mixed at 1:1 ratio in 200 μL LB in 96-well plates. After mating for 6 h at 37°C, 20 μL mixed cultures were spread on LB agar containing 1 μg/mL meropenem plus 16 μg/mL chloramphenicol. The conjugation frequency was calculated as transconjugants divided by number of donors. All experiments were carried out three times.
Growth curves
Same amount (1 × 10⁶ CFU/mL) of mid-logarithmic phase ancestral or evolved strains were cultured in 200 μL fresh LB in 96-well plates. The plates were incubated in BioTek Synergy H1 Multi-Mode Microplate Reader at 37°C with continuous shaking for 14 h. OD600nm was measured every 15 min. Strain E. coli C600 was used as control. Growth curves were also monitored in LB media containing 16 μg/mL meropenem to evaluate fitness advantages under antibiotic pressure. All experiments were carried out three times. The growth curve of each strain was fitted with the built-in Gompertz function in OriginPro 8.5 and maximum growth rates (μ) were calculated (19, 20). Multiple comparisons of μ were tested using SPSS 19.0 (ANOVA and Dunnett test).
Competition tests
Same amount (1 × 10⁶ CFU/mL) of mid-logarithmic phase plasmid-bearing ancestral or evolved strains and plasmid-free E. coli C600 were mixed at 1:1 ratio in 200 μL LB in 96-well plates. The plates were cultured at 37°C for 24 h. Mixtures were diluted with normal saline and spread on both selective and non-selective LB agar plates at 0 h and 24 h, respectively. Plasmid-bearing strains were counted using LB agar plates containing 1 μg/mL meropenem. Plasmid-free E. coli C600 were counted by the difference between the colony number of non-selective LB agar plates and selective LB agar plates. E. coli C600 was cultured as negative control. As described in reference (21), the competition indexes (CI) were formulated as the natural logarithm of the ratio between the cell density of plasmid-bearing ancestral or evolved strains at the end and start of the competition, divided by the natural logarithm of the ratio between the cell density of E. coli C600 at the end and start of the competition.
Plasmid stability testing
The stability of plasmids was assessed by determining the proportion of strains that retained the plasmid during continuous passaging in non-selective LB medium. Overnight bacterial culture was diluted 1000-fold in fresh LB medium, and 200 μL of the diluted culture was added to a 96-well culture plate. The plate was then incubated at 37℃ for 24 hours, and this process was repeated every 24 hours for a total of 10 days. Samples were taken on day 0, 3, 5, 8, and 10, diluted using PBS, and spread onto selective and non-selective agar plates. Selective agar plates were used to count the number of strains carrying the plasmid, while non-selective agar plates were used to count the total number of bacteria. Plasmid carriage rate was calculated as the number of colonies on selective agar plates divided by the number of colonies on non-selective agar plates.
Construction recombinant strains of ancestral host (evolved plasmid) and evolved host (ancestral plasmid)
To construct recombinant strains of ancestral host (evolved plasmid), extracting evolved plasmids under different concentrations of antimicrobial pressure (TaKaRa MiniBEST Plasmid Purification Kit Ver.4.0, Japan), and then transforming them into the ancestral E. coli C600 strain. To construct recombinant strains of evolved host (ancestral plasmid), evolved plasmids were eliminated first using pCasCure-Apr plasmid following previously reported protocols (22). The pCasCure-Apr plasmid can target and knock out IncX3 plasmids carrying blaNDM-5 using the CRISPR-Cas9 system. The extracted ancestral plasmids were transformed into each evolved hosts to obtain recombinant strains of evolved host (ancestral plasmid). Antimicrobial susceptibility and conjugation frequency of these recombinant strains were examined.
Plasmid copy number detection
As described in reference (23), the plasmid copy number (PCN) was determined using real-time quantitative PCR (qPCR). The copy number of the chromosomal single-copy atpF gene was used as an internal reference, and the copy number of the plasmid repA fragment was defined as the plasmid copy number. Bacterial genomic DNA was extracted using TaKaRa MiniBEST Bacteria Genomic DNA Extraction Kit Ver.3.0 (TaKaRa, Japan) following the instruction manual, and qPCR was performed using the TB Green Premix Ex TaqTM II (Tli RNaseH Plus) reagent kit (TaKaRa, Japan) on Applied Biosystems ViiATM 7 Dx (Life Technologies, USA). The thermal cycling parameters for the qPCR reaction were as follows: pre-denaturation at 95℃ for 7 min; denaturation at 95℃ for 10 s, annealing at 60℃ for 30 s, and 40 cycles. The PCN was calculated using the relative quantification formula 2-ΔΔCT, with the reference gene being atpF. Primers used in this study were shown in Table S1.
Quantification of expression levels of antibiotic resistance-related genes
Real-time quantitative reverse transcription PCR (qRT-PCR) was employed to detect the expression levels of antibiotic resistance-related genes, including blaNDM-5, ompC, ompF, acrA, acrB, and tolC. Total bacterial RNA was extracted using the TRIzol-based method. The extracted RNA was reverse transcribed into cDNA using the PrimeScriptTM RT reagent Kit with gDNA Eraser (TaKaRa, Japan). qPCR was performed using the TB Green Premix Ex TaqTM II (Tli RNaseH Plus) reagent kit (TaKaRa, Japan) on Applied Biosystems ViiATM 7 Dx (Life Technologies, USA). The thermal cycling parameters for the qPCR reaction were as follows: pre-denaturation at 95℃ for 7 min; denaturation at 95℃ for 10 s, annealing at 60℃ for 30 s, and 40 cycles. The relative expression level was calculated using the relative quantification formula 2-ΔΔCT, with the reference gene being rpoD.
blaNDM-5 overexpression plasmid construction
The pSTV28 plasmid was used as the engineering vector to construct the blaNDM-5 overexpression plasmid, named pSTV28-NDM5. To begin, the pSTV28 plasmid was linearized using the EcoRI restriction enzyme. Meanwhile, the blaNDM-5 DNA fragment was amplified using the highly accurate PrimeSTAR Max DNA Polymerase (TaKaRa, Japan). Both the linearized vector and the amplified DNA fragment were subsequently purified using the TaKaRa MiniBEST Agarose Gel DNA Extraction Kit Ver.4.0 (TaKaRa, Japan). Next, the purified target fragment and the vector were seamlessly recombined using the Ready-to-Use Seamless Cloning Kit (Sangon, China) at 50°C for 30 minutes. The resulting ligated product was then successfully transformed into E. coli BW25113 competent cells and subsequently verified through sequencing.
Whole-genome sequencing
Whole-genome sequencing was performed on both the resistance evolved strains and the ancestral strains to identify single nucleotide polymorphism (SNP) variations and potential structural variations. Bacterial genomic DNA was extracted using TaKaRa MiniBEST Bacteria Genomic DNA Extraction Kit Ver.3.0 (TaKaRa, Japan). A chromosome library with an insert size of 300 bp was prepared and sequenced on the NextSeq 500 high-throughput sequencing platform (Illumina, USA). The raw paired-end reads were filtered using fastp v0.12.5 (24), and de novo assembly was performed using Unicycler v0.4.9b (25). The resulting scaffolds were annotated using Prokka v1.14.6 (26). Breseq v0.35.5 was used to align the raw paired-end reads from the evolved strains to the ancestral strain ECNX52, enabling the identification of SNP variations and potential structural variations (27). PCR and Sanger sequencing methods were employed to validate the SNP loci.
Transcriptome sequencing
Transcriptome sequencing was performed on both the resistance evolved strains and the ancestral strains. Total RNA was extracted using the RNeasy Mini kit (QIAGEN, Germany) according to the manufacturer’s instructions. The extracted RNA was then converted to cDNA using the SMART-Seq v4 Ultra Low Input RNA Kit (Takara, Japan). Next, a DNA library for sequencing was generated using the Nextera XT DNA Library Preparation Kit (Illumina, USA) and sequenced on the Illumina HiSeq 2000 platform (Illumina, USA). The raw paired-end reads were filtered using fastp v0.12.5 (24). The sequencing reads were aligned to the ancestral reference genome ECNX52 using HISAT2 (28). Quantification was performed using StringTie (29). The raw counts were normalized to fragments per kilobase million (FPKM) using edgeR (30). Differential expression genes were determined based on false discovery rate (FDR) and fold change (FC), with a cutoff of FDR < 0.05 and |log2FC|>1. Gene Ontology (GO) was annotated with eggNOG-mapper (31). GO functional enrichment analysis of differentially expressed genes was performed using clusterProfiler (32).
Functional validation of repA mutant sites
The plasmid pQF50 containing a promoter-less lacZ reporter was used for repA promoter analysis. The DNA fragments of the repA promoter region (repAP) were PCR amplified and inserted into KpnI sites upstream of the lacZ reporter in pQF50 to generate pQF50-repAP. Meanwhile, repA and repAMut (encoding the π protein) were inserted into pSTV28 plasmids using the same method mentioned above, respectively. The impact of pSTV28-repA and pSTV28-repAMut plasmids on the β-galactosidase activities of the pQF50-repAP plasmid were analyzed following the procedure described in the reference literature (33). Collect 1 mL of overnight bacterial culture and resuspend the pellet in 1 mL of Z buffer. Mix 500 μL of the bacterial culture with 500 μL of Z buffer in each reaction tube. Add 1.5 μL of β-mercaptoethanol, 100 μL of chloroform, and 50 μL of 0.1% SDS solution to each reaction tube. Invert the tubes thoroughly and incubate them at 30℃ on a shaker for 2 min. Add 200 μL of 4 mg/mL ONPG solution to each reaction tube, and record the reaction time when the liquid appears light yellow. Add 500 μL of 1 mol/L Na2CO3 to terminate the reaction. Measure the absorbance of the supernatant at OD420nm and OD550nm, and measure the bacterial culture density at OD600nm. β-galactosidase activities were calculated using the Miller Units formula: Miller Units = 1000 x [(OD420nm - 1.75 x OD550nm)] / (T x V x OD600nm) (33).
Results
The resistance of EM2N1, EM2N3 and EM4N1-EM4N4 to meropenem increased
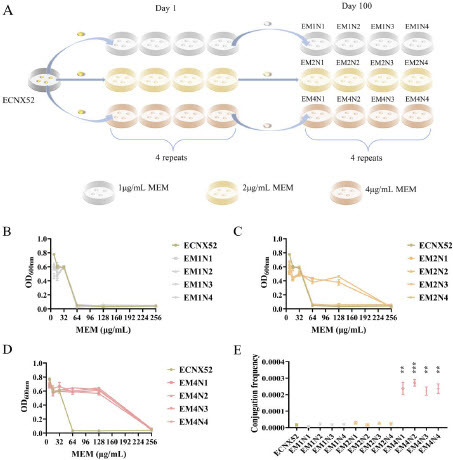
Evolution diagram of ECNX52 under different concentrations of MEM pressure was shown in A. After 100 days of 1 μg/mL continuous MEM pressure, the MICs of the four evolved clones EM1N1-EM1N4 did not show significant changes (B). Under 2 μg/mL continuous MEM pressure, the MICs of EM2N1 and EM2N3 increased four-fold, from 64 μg/mL to 256 μg/mL (C). Under 4 μg/mL MEM continuous pressure, all four evolved clones EM4N1-EM4N4 displayed higher resistance, with the MICs increasing from 64 μg/mL to 256 μg/mL, indicating the occurrence of resistant evolution (D). Besides, under 4 μg/mL continuous MEM pressure, the conjugation frequency of all four evolved clones EM4N1-EM4N4 significantly increased (P < 0.01) (E).
Figure 1. Changes in carbapenem resistance and conjugation frequency of evolved ECNX52 strains. A. Evolution diagram of ECNX52 under different concentrations of MEM pressure. B. Resistance changes of evolved ECNX52 under 1 μg/mL continuous MEM pressure. C. Resistance changes of evolved ECNX52 under 2 μg/mL continuous MEM pressure. D. Resistance changes of evolved ECNX52 under 4 μg/mL continuous MEM pressure. E. Conjugation frequency changes of evolved ECNX52 under different concentrations of MEM pressure. “**” means P < 0.01; “***” means P < 0.001.
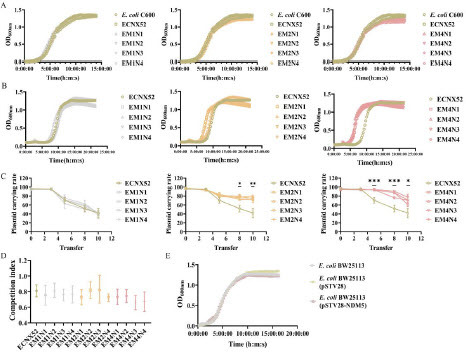
Fitness cost assessment of evolved strainsResistance evolution might bring some fitness costs, so we evaluated adaptability of ancestral and evolved strains through growth curves, paired competition, and plasmid stability experiments. First of all, plasmid pNX52-NDM-5 did not affect the growth of host bacteria E. coli C600. Compared to the ancestral strain ECNX52, the maximum growth rate (μ) of all evolved strains did not show significant changes in antibiotic-free LB medium (A). However, in LB medium containing 16 μg/mL MEM, the maximum growth rates (μ) of the resistance evolved strains EM2N1, EM2N3, and EM4N1∼EM4N4 were significantly higher than that of the ancestral strain ECNX52 (B), indicating higher adaptability of these evolved strains under antibiotic pressure. However, the increased adaptability to antibiotic environments might also came with certain fitness costs. Through continuous passaging in the antibiotics-free LB medium, the plasmid carriage rate in the ancestral ECNX52 strain gradually decreased. Compared to the ancestral strain, prolonged sub-MIC pressures (2 and 4 μg/mL) enhanced the plasmid carriage rate in antibiotic-free environments, but as the passaging time extended, the plasmid carriage rates also gradually decreased (C). Besides, ECNX52 (carrying ancestral pNX52-NDM-5 plasmid) showed CI values of less than 1 when competed with ancestral E. coli C600 in antibiotic-free LB medium, indicating that the propagation of pNX52-NDM-5 plasmid brought about a fitness defect to the bacterial host. Though the competition indexes of evolved strains with plasmid-free E. coli C600 did not show significant difference compared to that of ancestral strain ECNX52, we observed a decrease in CI value of EM1N1-EM1N4 (0.70 ± 0.04) compared to that of ancestral ECNX52 (0.81 ± 0.07) (D).
Figure 2. Fitness assessment of evolved ECNX52 strains. A. Growth curve of evolved ECNX52 strains in antibiotic-free LB medium. B. Growth curve of evolved ECNX52 strains in LB medium containing 16 μg/mL MEM. C. Stability of pNX52-NDM-5 plasmid in evolved ECNX52 strains. D. Competition index between evolved ECNX52 strains and E. coli C600. E. Fitness assessment of blaNDM-5 resistance gene. pSTV28-NDM5 is a blaNDM-5 overexpression plasmid with pSTV28 as the vector.
Bacterial host factors mediated resistance evolution in EM2N1 and EM2N3, while plasmid factors mediated resistance evolution in EM4N1-EM4N4
To explore the mechanisms underlying the resistance evolution in EM2N1, EM2N3, EM4N1-EM4N4, transcriptome sequencing was performed on the ancestral strain ECNX52, and the resistant evolved strains EM2N1, EM2N3, EM4N1-EM4N4. The transcriptome changes in EM2N1 and EM2N3 were quite different from those in EM4N1-EM4N4. In EM2N1 and EM2N3, 28 co-upregulated genes were all bacterial host genes and were significantly enriched in six Gene Ontology (GO) terms, including phosphoenolpyruvate-dependent sugar phosphotransferase system, transmembrane transporter complex and L-ascorbic acid transport (P < 0.05). The 11 co-downregulated genes were all bacterial host genes, too, mainly involved in cell outer membrane process (P = -0.051) (A, B), in which ompF showed the most significant downregulation (|log2FC|>3, P < 0.0001). Compared to the ancestral strain ECNX52, EM4N1-EM4N4 exhibited 65 co-upregulated genes, of which -47 were plasmid genes, suggesting the important role of plasmid gene expression in the resistance evolution of ECNX52 (A). Compared to the transcriptome of the ancestral strain ECNX52, the resistant strains EM4N1-EM4N4 showed significant expression of plasmid genes, including the resistance gene blaNDM-5 and conjugation-related genes, which explained the increased resistance level and conjugation frequency in EM4N1-EM4N4. The remaining -18 co-upregulated genes were bacterial host genes, mainly involved in the anaerobic electron transport chain, NarGHI complex, nitrate assimilation etc. (P < 0.05) (C). EM4N1-EM4N4 had 18 co-downregulated bacterial host genes, involved in the regulation of tricarboxylic acid cycle, glyoxylate cycle, and tartrate catabolic process etc. (P < 0.05), with no downregulated plasmid gene observed (A, C).
Figure 3. Transcriptomic and genomic changes in resistance evolved strains. A. Venn diagrams of differentially expressed genes in resistance evolved strains. The diagrams on the upper left and upper right showed upregulated and downregulated genes in EM2N1 and EM2N3 compared to the ancestral strain, respectively. The diagram on the lower left and lower right showed upregulated and downregulated genes in EM4N1-EM4N4 compared to the ancestral strain, respectively. B, C. Bubble charts of GO functional enrichment analysis of differentially expressed bacterial host genes in resistance evolved strains. Panel B demonstrated the GO functional enrichment analysis of differentially expressed host genes in EM2N1 and EM2N3 in comparison to the ancestral strain ECNX52, while panel C depicted the same analysis for EM4N1-EM4N4. The y-axis represented GO terms. The x-axis represented the ratio of differentially expressed genes (the ratio reflected genes related to the GO term in the differentially expressed genes to the total number of differentially expressed genes). The size of the bubble represented the number of enriched genes. The color of the bubble represented the value of P value, and the shape of the bubble represented the regulation direction of GO functional terms. D. Expression levels of resistance-related genes blaNDM-5, ompC, ompF, acrA, acrB, and tolC in resistance evolved strains using qRT-PCR. E. Changes in the copy number of plasmids in resistance evolved strains using qPCR. “*” means P < 0.05; “**” means P < 0.01; “***” means P < 0.001; “****” means P < 0.0001.
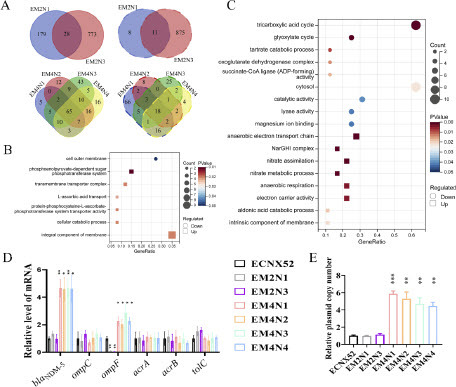
Next, we used qRT-PCR to verify RNA-seq results of the expression levels of some resistance related genes including blaNDM-5, outer membrane proteins ompC and ompF, and the efflux pump acrAB-tolC. qRT-PCR results were consistent with RNA-seq results in terms of these genes. As described above, the ompF gene was truly significantly down-regulated in EM2N1 and EM2N3 (P < 0.01) (D), suggesting decreased expression of outer membrane protein might contributed to the increased resistance to MEM in EM2N1 and EM2N3. OmpF pore protein provides a pathway for small hydrophilic antibiotics to reach the intracellular environment, such as β-lactams, tetracyclines, and fluoroquinolones. We tested whether EM2N1 and EM2N3 with decreased OmpF also evolved cross resistance to these antibiotics, as well as polymyxin usually used for treating CREC infection. Compared to the ancestral E. coli C600 strain, the empty evolved bacterial host HEM2N1 and HEM2N3 did not change the susceptibility profile, but there were some MIC changes. Decreased OmpF caused twofold increase in ceftazidime (from 0.25 to 0.5 μg/mL), meropenem (from 0.06 to 0.12 μg/mL), cefiderocol (from 0.06 to 0.12 μg/mL), levofloxacin (from 0.25 to 0.5 μg/mL) and tigecycline (from 0.06 to 0.12 μg/mL) MICs. When the blaNDM-5 existed, EM2N1 and EM2N3 showed a more obvious increase in resistance to ceftazidime (from 128 to 512 μg/mL) and meropenem (from 64 to 256 μg/mL). However, cefiderocol was effective to EM2N1 and EM2N3. Decreased OmpF changed MIC of cefiderocol from 1 μg/mL to 2 μg/mL in blaNDM-5 positive strains (Table S2).
The expression of blaNDM-5 was significantly up-regulated in EM4N1-EM4N4 (P < 0.05) (D), indicating that the increased resistance to MEM in EM4N1-EM4N4 is mainly mediated by plasmids. Overexpression of blaNDM-5 gene did not affect the growth of E. coli BW25113 (E), indicating increase of NDM-5 carbapenemases did less harm to bacterial hosts. To explore the mechanism of up-regulation of blaNDM-5, we detected the copy numbers of the pNX52-NDM-5 plasmid, and the results showed an increase in the plasmid copy numbers in EM4N1-EM4N4 (P < 0.01) (E).
To better depict the changes in evolved strains, we also performed whole-genome sequencing of the ancestral strain ECNX52 and resistance evolved strains EM2N1, EM2N3 and EM4N1-EM4N4. Besides, four evolved strains EM1N1-EM1N3 and EM2N2 that did not show increased resistance were sequenced as controls. By aligning the raw reads of EM1N1-EM1N3, EM2N1-EM2N3, and EM4N1-EM4N4 with the sequence of the ancestral strain ECNX52 using Breseq v0.35.5, we identified several mutation sites (Table S3). The mutations in EM4N1-EM4N4 mainly occurred in the replication protein repA D140Y (GAT→TAT) of the pNX52-NDM-5 plasmid and the type I fimbrial subunit fimA A64S (GCT→TCT) of the bacterial hosts.
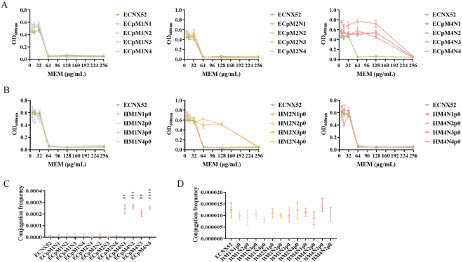
To verify decrease of outer membrane protein in bacterial host mediated resistance evolution in EM2N1 and EM2N3, as well as increase of plasmid copy number mediated resistance evolution in EM4N1-EM4N4, we constructed recombinant strains with ancestral hosts (evolved plasmids) and evolved hosts (ancestral plasmids), and tested their resistance and conjugation frequencies to evaluate whether evolved plasmids or evolved hosts were involved in mediating resistance evolution. Compared to ECNX52, the MIC of recombinant ancestral hosts (evolved plasmids) strains ECpM2N1 and ECpM2N3 did not change significantly, while the MICs of ECpM4N1-ECpM4N4 increased four-fold from 64 μg/mL to 256 μg/mL (A), and conjugation frequencies of ECpM4N1-ECpM4N4 also significantly increased (P < 0.01) (C), suggesting that the resistance evolution in EM4N1-EM4N4 was mainly mediated by evolved plasmids. The MICs of recombinant evolved hosts (ancestral plasmids) strains HM2N1p0 and HM2N3p0 increased four-fold compared to ECNX52, indicating that the resistance evolution in EM2N1 and EM2N3 was mainly mediated by evolved bacterial hosts (B). Besides, the conjugation frequencies of evolved hosts (ancestral plasmids) were not significantly different from ECNX52 (D).
Figure 4. Plasmid or host factors mediated resistance evolution. A. MICs of evolved plasmids in the ancestral host strain. ECpM1N1-ECpM4N4 were recombinant strains constructed by transforming the evolved plasmids into the ancestral E. coli C600. B. MICs of ancestral plasmids in evolved host strains. HM1N1p0-HM4N4p0 were recombinant strains constructed by transforming the ancestral plasmid p0 into the evolved host strains. C. Conjugation frequency of evolved plasmids in the ancestral host strain. “**” means P < 0.01; “***” means P < 0.001; “****” means P < 0.0001. D. Conjugation frequency of ancestral plasmids in evolved host strains.
To ascertain the stability of the increased resistance phenotype in strains undergoing resistance evolution, we conducted serial passaging for 30 days in antibiotic-free media. The results revealed that by the 10th day, both EM2NI and EM2N3 showed a decrease in meropenem MIC from 256 μg/mL to 64-128 μg/mL. As the passages continued, their MIC gradually returned to the level of the ancestral strain ECNX52 (32-64 μg/mL) (Figure S1A). We further examined the expression level of ompF and found that by day 10, it had reverted to the level of the ancestral strain ECNX52, indicating that transcriptional regulation could adjust in response to environmental changes (Figure S1B). In contrast, while the MIC and plasmid copy numbers of EM4N1-EM4N4 decreased with continued passaging, they still maintained a higher resistance level (64-128 μg/mL) than that of the ancestor strain (32-64 μg/mL) along with higher plasmid copy numbers (Figure S1C, D). Considering that repA was associated with plasmid copy number regulating, we also investigated the stability of the repA D140Y (GAT→TAT) mutation during passaging and found that it remained stable under the 30-day antibiotic-free conditions.
The replication protein repA D140Y (GAT→TAT) mutation of the pNX42-NDM-5 plasmid led to an increase in plasmid copy number
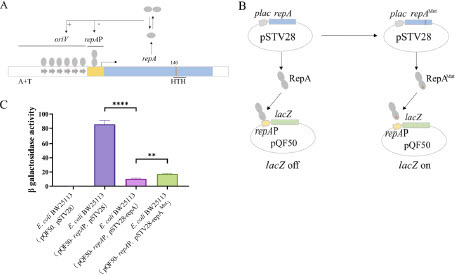
Since repA is closely related to plasmid replication, its mutation might cause changes in plasmid copy number. We further explored the role of this mutation site. According to literature [72, 73], RepA monomers bind to the six direct repeat sequences at the replication origin (oriV) to initiate pNX52-NDM-5 replication when RepA levels are relatively low. However, it has also been discovered that when RepA levels are high, RepA dimers bind to the RepA promoter (repAP), inhibiting RepA synthesis and consequently exerting a negative regulatory effect on plasmid replication (A). RepA recognizes DNA sequences dependent on the helix-turn-helix (HTH) motif structure. When the HTH sequence mutates, RepA dimers cannot bind to repAP, releasing the inhibition on pNX52-NDM-5 plasmid replication and increasing plasmid copy number. Using HTH motif prediction software GYM 2.0 to predict HTH sequence in RepA (http://users.cis.fiu.edu/~giri/bioinf/GYM2/prog.html), it was found that repA D140Y (GAT→TAT) mutation site was located near a potential HTH motif structure (Loc 139) (Figure S2). We cloned repAP into the lacZ reporter plasmid pQF50, overexpressed repA and repAMut using pSTV28 plasmid, and measured whether RepAMut influenced β-galactosidase activity of pQF50-repAP plasmid (B). Overexpression of repA significantly inhibited the promoter activity of repAP (P < 0.0001), while compared to the repA group, the β-galactosidase activity in the repAMut group was significantly enhanced (P < 0.01) (C), indicating that the mutation site repA D140Y (GAT→TAT) can increase plasmid copy number.
Figure 5. Functional validation of the replication protein repA D140Y (GAT→TAT) mutation in the pNX52-NDM-5 plasmid. A. Schematic diagram of the structure of the replication protein repA in the pNX52-NDM-5 plasmid. B. Schematic diagram of the lacZ reporter system used to validate the function of the repA D140Y (GAT→TAT) mutation. C. The repA D140Y (GAT→TAT) mutation reduced inhibition of promoter activity, leading to an increase in plasmid copy number. “**” means P < 0.01; “***” means P < 0.001.
Discussion
The World Health Organization has described antimicrobial resistance as a global public health crisis that must be urgently addressed. Previous studies have focused on the mechanisms of resistant mutants obtained from sensitive bacteria under the pressure of antimicrobial drugs, while less attention has been paid to the resistance evolution of complex plasmid-bacterial host system. Global dissemination of conjugative resistant plasmids has brought great harm, making the study of resistance evolution in conjugative resistant plasmid-bacterial host systems highly significant. Considering the alarming levels of antibiotic pollution, it is crucial to gain a comprehensive understanding of how bacteria and plasmids develop resistance evolution. In this study, we investigated the impact of various sub-MIC concentrations of MEM on the resistance evolution of ECNX52, which was a recombinant E. coli C600 strain with carbapenem resistant plasmid pNX52-NDM-5. The resistance of the four different clones that were subjected to a constant pressure of 1 μg/mL MEM (1/64 MIC) remained unchanged. However, two out of the four clones (EM2N1 and EM2N3) exhibited resistance evolution when exposed to a continuous pressure of 2 μg/mL MEM (1/32 MIC), leading to a four-fold increase in MIC. Moreover, when subjected to a continuous pressure of 4 μg/mL MEM (1/16 MIC), all four clones displayed resistance evolution, too, resulting in a four-fold increase in MIC compared to ancestral strain ECNX52.
Under the pressure of antibiotics, bacteria could acquire resistance through mutation or horizontal gene transfer of resistance genes, but both ways could bring about fitness costs by affecting protein stability and increasing energy burden, resulting in a decrease in growth rate or competition indexes (34). Though the maximum growth rates (μ) of plasmid-carrying strains were not significantly different from that of the control strain E. coli C600 in this study, we observed the failure of plasmid-carrying strains when competed with plasmid-free E. coli C600 strain (CI < 1), as well as the gradually decreased plasmid carriage rates in continuous antibiotic-free environment.In other studies, researchers also found that blaNDM-5-carrying IncX3 plasmid had minimal impact on the growth of the bacterial host and exhibited high stability (35). However, in competition with plasmid-free host bacteria, it showed fitness defects (36). Overall, these results indicated blaNDM-5-carrying IncX3 plasmid had minor fitness costs. Under prolonged 4 μg/mL meropenem pressure, the plasmid demonstrated improved stability in antibiotic-free environments but still displayed lower competitive fitness. We speculate that the increase in plasmid copy numbers may facilitate an increase in plasmid carriage rate but also comes with associated fitness costs.
Both plasmid and bacterial host factors could mediate resistance evolution. Outer membrane proteins and efflux pumps play important roles in the adaptive evolution of plasmid-bacterial host systems. Under tetracycline (TET) pressure, E. coli MG1655 carrying the MDR plasmid RK2 (encoding TET and ampicillin resistance genes) acquired chromosomal resistance mutations that reduced outer membrane permeability and increased efflux pump expression, resulting in cross-resistance to other drugs (5). Hoi-Kuan Kong et al. demonstrated that mutations in the outer membrane protein regulatory factor ompR contributed to the resistance evolution of plasmid-bacterial host systems under antibiotic pressure (38). In this study, downregulation of outer membrane protein ompF contributed to the resistance evolution in EM2N1 and EM2N3. We also tested whether decreasing ompF would influence the resistance of other antibiotics including ceftazidime, meropenem, cefiderocol, levofloxacin, tigecycline and polymyxin. While the reduced expression of ompF alone did not drive the sensitive bacteria to the resistance threshold, it could collaborate with beta-lactamases to produce a more pronounced resistance effect. The influence of OmpF on cefiderocol resistance was less substantial compared to other beta-lactam antibiotics, as cefiderocol penetrates the cell using an iron carrier (4). Different resistance mechanisms often work together to confer resistance. However, mechanisms of downregulation of ompF still need to be further investigated.
Increase in plasmid copy number facilitates the co-evolution of plasmid horizontal transmission and plasmid-encoded antibiotic resistance. A study found that higher conjugation rate of the resistant plasmid R1 was accompanied by mutations in the copA gene, resulting in an increased copy number of R1 and higher resistance level (39). In this study, we found that when under continuous pressure of 4 μg/mL MEM, the copy number of the pNX52-NDM-5 plasmid increased, leading to increased expression levels of resistance genes and conjugation-related genes, and higher conjugation frequency, The missense mutation of repA D140Y (GAT→TAT), could prevent the binding of repAMut to repAP, relieving the feedback inhibition and resulting in an increased copy number of the plasmid.
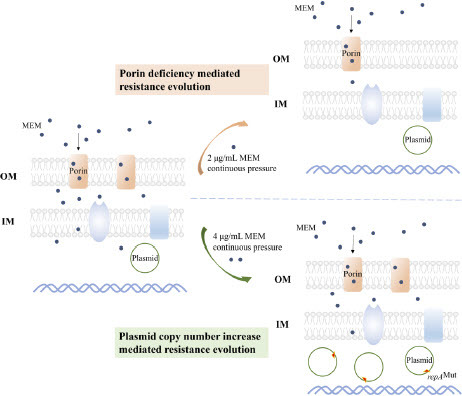
In summary, bacterial hosts and conjugative plasmids could undergo resistance evolution under certain concentrations of antimicrobial pressure by reducing the expression of outer membrane proteins or increasing plasmid copy numbers. blaNDM-5-carrying IncX3 plasmids demonstrated high resistance levels to carbapenems and adaptability to bacterial host, which could enhance their resistance and stability in response to increasing antimicrobial pressure (). In the context of “One Health”, a comprehensive perspective of human-animal-environment health is required to develop strategies for addressing bacterial resistance. Reducing unnecessary antimicrobial drug usage and antibiotic pollution is necessary to minimize the evolution of bacterial resistance.
Figure 6. Porin Deficiency or Plasmid Copy Number Increase Mediated Carbapenem-Resistant Escherichia coli Resistance Evolution. OM means outer membrane. IM means inner membrane. MEM means meropenem.
Conflict of Interests
The authors have no commercial or other associations that might pose conflict of interests.
Acknowledgements
We extend our sincere appreciation to Professor Jian Sun from South China Agricultural University for his generous gift of the pCasCure-Apr plasmid, which greatly facilitated our research.
Data availability
Raw microbiome sequencing data have been deposited in NCBI’s Sequencing Read Archive (SRA) database under Bioproject numbers PRJNA1044738.
Statistical analysis
Unless otherwise specified, all analyses were conducted using SPSS 19.0. Unpaired, two-tailed t-tests were used for the comparison of continuous variables. Chi-square tests or Fisher's exact tests were used for the comparison of categorical variables.
Ethical Considerations
Ethical approval not applicable.
Funding
This study was funded by the National Natural Science Foundation of China (81772249, 81871703), Natural Science Foundation of Guangdong Province (2021A1515010423, 2023A1515010607), and Science and Technology Projects in Guangzhou (202103000026). The funders did not participate in study design, data collection and interpretation, or the decision to submit the work for publication.
References
- Munita JM, Arias CA. 2016. Mechanisms of Antibiotic Resistance. Microbiol Spectr 4.
- Shen Z, Hu Y, Sun Q, Hu F, Zhou H, Shu L, Ma T, Shen Y, Wang Y, Li J, Walsh TR, Zhang R, Wang S. 2018. Emerging Carriage of NDM-5 and MCR-1 in Escherichia coli From Healthy People in Multiple Regions in China: A Cross Sectional Observational Study. EClinicalMedicine 6:11-20.
- Shen C, Zhong L-L, Yang Y, Doi Y, Paterson DL, Stoesser N, Ma F, El-Sayed Ahmed MAE-G, Feng S, Huang S, Li H-Y, Huang X, Wen X, Zhao Z, Lin M, Chen G, Liang W, Liang Y, Xia Y, Dai M, Chen D-Q, Zhang L, Liao K, Tian G-B. 2020. Dynamics of mcr-1 prevalence and mcr-1-positive Escherichia coli after the cessation of colistin use as a feed additive for animals in China: a prospective cross-sectional and whole genome sequencing-based molecular epidemiological study. The Lancet Microbe 1:e34-e43.
- Simner PJ, Mostafa HH, Bergman Y, Ante M, Tekle T, Adebayo A, Beisken S, Dzintars K, Tamma PD. 2021. Progressive Development of Cefiderocol Resistance in Escherichia coli During Therapy Is Associated with Increased blaNDM-5 Copy Number and Gene Expression. Clin Infect Dis doi:10.1093/cid/ciab888.
- Bottery MJ, Wood AJ, Brockhurst MA. 2017. Adaptive modulation of antibiotic resistance through intragenomic coevolution. Nat Ecol Evol 1:1364-1369.
- Loftie-Eaton W, Bashford K, Quinn H, Dong K, Millstein J, Hunter S, Thomason MK, Merrikh H, Ponciano JM, Top EM. 2017. Compensatory mutations improve general permissiveness to antibiotic resistance plasmids. Nat Ecol Evol 1:1354-1363.
- Jordt H, Stalder T, Kosterlitz O, Ponciano JM, Top EM, Kerr B. 2020. Coevolution of host-plasmid pairs facilitates the emergence of novel multidrug resistance. Nat Ecol Evol 4:863-869.
- Yang X, Dong N, Chan EW, Zhang R, Chen S. 2021. Carbapenem Resistance-Encoding and Virulence-Encoding Conjugative Plasmids in Klebsiella pneumoniae. Trends Microbiol 29:65-83.
- Harrison E, Guymer D, Spiers AJ, Paterson S, Brockhurst MA. 2015. Parallel compensatory evolution stabilizes plasmids across the parasitism-mutualism continuum. Curr Biol 25:2034-9.
- Hughes JM, Lohman BK, Deckert GE, Nichols EP, Settles M, Abdo Z, Top EM. 2012. The role of clonal interference in the evolutionary dynamics of plasmid-host adaptation. mBio 3:e00077-12.
- Larsson DGJ, Flach CF. 2022. Antibiotic resistance in the environment. Nat Rev Microbiol 20:257-269.
- Wang Y, Zhang R, Li J, Wu Z, Yin W, Schwarz S, Tyrrell JM, Zheng Y, Wang S, Shen Z, Liu Z, Liu J, Lei L, Li M, Zhang Q, Wu C, Zhang Q, Wu Y, Walsh TR, Shen J. 2017. Comprehensive resistome analysis reveals the prevalence of NDM and MCR-1 in Chinese poultry production. Nat Microbiol 2:16260.
- Li X, Fu Y, Shen M, Huang D, Du X, Hu Q, Zhou Y, Wang D, Yu Y. 2018. Dissemination of bla(NDM-5) gene via an IncX3-type plasmid among non-clonal Escherichia coli in China. Antimicrob Resist Infect Control 7:59.
- Dong H, Li Y, Cheng J, Xia Z, Liu W, Yan T, Chen F, Wang Z, Li R, Shi J, Qin S. 2022. Genomic Epidemiology Insights on NDM-Producing Pathogens Revealed the Pivotal Role of Plasmids on bla(NDM) Transmission. Microbiol Spectr 10:e0215621.
- Zuo H, Sugawara Y, Kayama S, Kawakami S, Yahara K, Sugai M. 2023. Genetic and phenotypic characterizations of IncX3 plasmids harboring bla (NDM-5) and bla (NDM-16b) in Japan. Microbiol Spectr 11:e0216723.
- Yang P, Xie Y, Feng P, Zong Z. 2014. blaNDM-5 carried by an IncX3 plasmid in Escherichia coli sequence type 167. Antimicrob Agents Chemother 58:7548-52.
- Hornsey M, Phee L, Wareham DW. 2011. A novel variant, NDM-5, of the New Delhi metallo-β-lactamase in a multidrug-resistant Escherichia coli ST648 isolate recovered from a patient in the United Kingdom. Antimicrob Agents Chemother 55:5952-4.
- Institute. CaLS. 2020. Performance standards for antimicrobial susceptibility testing: Thirty informational supplement, CLSI document M100-S30. Wayne, PA Clinical Laboratory Standards Institute.
- Xiang G, Lan K, Cai Y, Liao K, Zhao M, Tao J, Ma Y, Zeng J, Zhang W, Wu Z, Yu X, Liu Y, Lu Y, Xu C, Chen L, Tang Y-W, Chen C, Jia W, Huang B. 2021. Clinical Molecular and Genomic Epidemiology of Morganella morganii in China. 12.
- Zwietering MH, Jongenburger I, Rombouts FM, van 't Riet K. 1990. Modeling of the bacterial growth curve. Appl Environ Microbiol 56:1875-81.
- Yang J, Wang HH, Lu Y, Yi LX, Deng Y, Lv L, Burrus V, Liu JH. 2021. A ProQ/FinO family protein involved in plasmid copy number control favours fitness of bacteria carrying mcr-1-bearing IncI2 plasmids. Nucleic Acids Res 49:3981-3996.
- Hao M, He Y, Zhang H, Liao XP, Liu YH, Sun J, Du H, Kreiswirth BN, Chen L. 2020. CRISPR-Cas9-Mediated Carbapenemase Gene and Plasmid Curing in Carbapenem-Resistant Enterobacteriaceae. Antimicrob Agents Chemother 64.
- Sota M, Yano H, M Hughes J, Daughdrill GW, Abdo Z, Forney LJ, Top EM. 2010. Shifts in the host range of a promiscuous plasmid through parallel evolution of its replication initiation protein. The ISME Journal 4:1568-1580.
- Chen S, Zhou Y, Chen Y, Gu J. 2018. fastp: an ultra-fast all-in-one FASTQ preprocessor. Bioinformatics 34:i884-i890.
- Wick RR, Judd LM, Gorrie CL, Holt KE. 2017. Unicycler: Resolving bacterial genome assemblies from short and long sequencing reads. PLoS Comput Biol 13:e1005595.
- Seemann T. 2014. Prokka: rapid prokaryotic genome annotation. Bioinformatics 30:2068-9.
- Deatherage DE, Barrick JE. 2014. Identification of mutations in laboratory-evolved microbes from next-generation sequencing data using breseq. Methods in molecular biology (Clifton, NJ) 1151:165-188.
- Kim D, Paggi JM, Park C, Bennett C, Salzberg SL. 2019. Graph-based genome alignment and genotyping with HISAT2 and HISAT-genotype. Nat Biotechnol 37:907-915.
- Pertea M, Pertea GM, Antonescu CM, Chang TC, Mendell JT, Salzberg SL. 2015. StringTie enables improved reconstruction of a transcriptome from RNA-seq reads. Nat Biotechnol 33:290-5.
- Robinson MD, McCarthy DJ, Smyth GK. 2010. edgeR: a Bioconductor package for differential expression analysis of digital gene expression data. Bioinformatics (Oxford, England) 26:139-140.
- Cantalapiedra CP, Hernández-Plaza A, Letunic I, Bork P, Huerta-Cepas J. 2021. eggNOG-mapper v2: Functional Annotation, Orthology Assignments, and Domain Prediction at the Metagenomic Scale. Mol Biol Evol 38:5825-5829.
- Wu T, Hu E, Xu S, Chen M, Guo P, Dai Z, Feng T, Zhou L, Tang W, Zhan L, Fu X, Liu S, Bo X, Yu G. 2021. clusterProfiler 4.0: A universal enrichment tool for interpreting omics data. Innovation (Camb) 2:100141.
- Giacomini A, Corich V, Ollero FJ, Squartini A, Nuti MP. 1992. Experimental conditions may affect reproducibility of the beta-galactosidase assay. FEMS Microbiol Lett 100:87-90.
- MacLean RC, Hall AR, Perron GG, Buckling A. 2010. The population genetics of antibiotic resistance: integrating molecular mechanisms and treatment contexts. Nat Rev Genet 11:405-14.
- Hammer-Dedet F, Aujoulat F, Jumas-Bilak E, Licznar-Fajardo P. 2022. Persistence and Dissemination Capacities of a bla(NDM-5)-Harboring IncX-3 Plasmid in Escherichia coli Isolated from an Urban River in Montpellier, France. Antibiotics (Basel) 11.
- He T, Wei R, Zhang L, Sun L, Pang M, Wang R, Wang Y. 2017. Characterization of NDM-5-positive extensively resistant Escherichia coli isolates from dairy cows. Vet Microbiol 207:153-158.
- San Millan A, Peña-Miller R, Toll-Riera M, Halbert ZV, McLean AR, Cooper BS, MacLean RC. 2014. Positive selection and compensatory adaptation interact to stabilize non-transmissible plasmids. Nat Commun 5:5208.
- Kong HK, Pan Q, Lo WU, Liu X, Law COK, Chan TF, Ho PL, Lau TC. 2018. Fine-tuning carbapenem resistance by reducing porin permeability of bacteria activated in the selection process of conjugation. Sci Rep 8:15248.
- Dimitriu T, Matthews AC, Buckling A. 2021. Increased copy number couples the evolution of plasmid horizontal transmission and plasmid-encoded antibiotic resistance. Proc Natl Acad Sci U S A 118.