
 ?Mathematical formulae have been encoded as MathML and are displayed in this HTML version using MathJax in order to improve their display. Uncheck the box to turn MathJax off. This feature requires Javascript. Click on a formula to zoom.
Abstract
The global feed production has increased in the past few years. Despite the growing trend, the current production does not meet the demand in Kenya. The government of Kenya has initiated several efforts towards promoting fodder production to increase milk production and household income. This study analysed the effects of fodder production on household income in Homa Bay County, Kenya using the Propensity Score Matching (PSM) technique. The study used primary data collected through structured questionnaires in Homabay County, Kenya from a sample size of 300 smallholder farmers. Results indicated that years of schooling, herd size, household size, labour used in land preparation, and land size under fodder had a positive influence on the probability of farmers to mainly feed their livestock on Napier grass. On the contrary, the number of extension contacts negatively influenced the probability of farmers feeding their livestock on Napier grass. Results show that there was a significant difference between the incomes of farmers who fed their cattle on Napier grass and those who mainly grazed their cattle on natural grass. Specifically, smallholder farmers who fed their livestock on Napier grass reported a Kshs. 3,916.67 (USD 25.71) higher income than their counterparts who grazed their livestock on natural grass reflecting an increase by 24.94%. Thus, the study recommends the need for both the national and county governments to incorporate fodder production as a key area for livestock development agenda in their policy plans to improve the farmers’ income.
1. Introduction
Insufficient access to sufficient supplies of high-quality feed has a detrimental impact on the sustainability of the livestock industry in sub-Saharan Africa. The availability of feed is made worse by the consequences of climate change. However, in recent times the global feed production has indicated a positive growth in the past few years. In Africa for example, the dairy feed output increased by 10%, making dairy one of the few sectors to witness progress across all areas (Altech, Citation2018). Livestock feedstuff is differentiated into feed concentrates such as grains and oilseeds and roughage such as grass from pastures and crop residues (Pandey, Citation2011). Communities living in dry lands of Kenya are now embracing fodder production to increase their household income and food security in the occurrence of recurrent droughts as a result of climate variability (CNFA, Citation2013). Fodder trees play an important role as a feed source to sustain production in livestock and mitigate the effects of poor-quality feed on milk, especially during dry seasons in Kenya (Makau et al., Citation2020). For example, Place et al. (Citation2009) found that on average, 2 kilograms of Calliandra foliage (dry matter) fed to a dairy cow daily has been reported to increase daily milk production by approximately 1 litre. Analysis of gross margin indicates that production of pasture and fodder is a profitable venture and there is a significant market for it. Conversely, the institutional and regulatory structure that governs fodder production, processing, and marketing including private sector support is underdeveloped, leaving vulnerable farmers to unscrupulous market actors (MoALF, Citation2017).
Tropical grasses, legumes, and crop residues make up the majority of the forages that go into animal diets in Kenya (Mwendia et al., Citation2020). In both of the wet seasons in the predominantly bimodal regions, the bulk of the feed consists of fodder crops and weeds, while in the dry seasons, these are supplemented by crop residues (Paterson* et al., Citation1998). Notably, in developing countries like Kenya forests provide feed for livestock in the form of fodder for stall-feeding and grazing in the forest areas, however extraction of fodder resources from forests often leads to forest degradation (Pandey et al., Citation2014). In their study, Musalia et al. (Citation2016) found that most animal feeds came from crop residues such as millet straw, maize stalk, pigeon peas, beans, and sorghum. The most popular fodder species utilized by dairy producers in a zero grazing system in Kenya are Napier grass (33%) Rhodes grass (21%), maize (17%), and lucerne (8%). Other species had ratings of less than 2%. Napier grass makes up about 70% of all forages consumed by smallholders, making it the most often used fodder when grazing is prohibited (Mwendia et al., Citation2020). Hay (produced from Boma Rhodes and Brachiaria grass) and Lucern are the most frequently traded fodder, whereas Napier grass dominates sales between farmers within close vicinity. As a result of the shortest value chain of Napier grass, it is directly sold from the producer to the final user (Auma et al., Citation2018).
Fodder production has both direct and indirect effects on producer household income. The direct effect is through the sale of fodder (grass, hay, silage, crop residues) while the indirect effect is through the sale of milk produced and livestock sales. In smallholder farms in Kenya, the cost of feeding dairy animals accounts for between 60% and 80% of the total cost of production. Efficient feeding could significantly increase farmers’ profit margins (Auma et al., Citation2018). Subsequently, pastoral and agro-pastoral communities in ASALs in Kenya are gradually taking up the production of fodder not only in response to pasture inadequacy resulting from recurrent droughts but also as a supplement to income from livestock production (Ouma, Citation2017). In Mandera County, the Enhanced Livelihoods in the Mandera Triangle (ELMT) project reinforced communities in the county to improve livestock production through sensitization and provision of inputs used in fodder production (VSF-Suisse, Citation2009). Ouma (Citation2017) revealed that selling hay, grass seeds, and leasing out pasture were the three major ways income was generated translating to an average return of Ksh. 13500 (USD 88.62) per acre to the fodder farmers. The highest contribution of the household income was from selling grass as compared to pasture leasing which had the least contribution. With an increase in fodder production and milk yields, there has been a rise in the income of the rural smallholder by 25–100 euros (USD 27.19–108.77) per household per year. Women are observed to take part in the plantation of fodder trees and a lot of them have established fodder seedling nurseries to earn extra income (SPORE, Citation2015).
Further, Meyerhoff (Citation2012) found that some dryland areas in Kenya, including Baringo, Marsabit, and Laikipia, receive about 10 tons of indigenous grass seeds annually. This has contributed to more income benefits of about Kshs. 1.5 million (USD 9,784.74) per annum, with farmer groups benefiting from loans worth over Kshs. 750,000 (USD 4,923.51) using rehabilitated fields as collateral in loan acquisition. Some of the benefits that are obtained from fodder production in these areas include, hay and leasing out grazing, income received from the sale of grass seeds, use of grass for thatching, healthier livestock, grazing reserves, and improved livestock productivity (Wairore et al., Citation2015). Lugusa (Citation2015) did a study on fodder production and adaptation strategies in the drylands, in Baringo County Kenya. The study was carried out to map the contribution of fodder and grass seed value chains on household income. The findings from the study indicated that fodder production had the potential to address the cash needs of farmers in pastoral communities. The study emphasized the need to link the fodder farmers to reliable markets to cushion them from potentially low prices that are offered for the grass seeds. In addition, producers need to have access to more inputs in the fodder and grass seed value chain to lower the prices of inputs associated with the input market.
In Kenya, fodder farmers who adopted Brachiaria grass had an increased milk output, for instance, Maina et al. (Citation2020) found that farmers took on climate-smart push-pull technology that consumes Brachiaria grass since they observed that it provided feeds for livestock during the period of drought and this increased milk output. Similarly, Mawa et al. (Citation2014) found that the cost of fodder produced on farms significantly improved profit efficiency among farmers. An increase in milk production as a result of feeding fodder shrubs to dairy animals is experienced within a short time and this in turn facilitates quick evaluation and uptake by the farmers (Wambugu et al., Citation2011). Further, it was revealed that increased milk production was one of the benefits derived from fodder production and the use of silage (Kilelu et al., Citation2018). Access to quality fodder all year round is important to addressing the seasonality in fodder supply to meet market demand, decrease the cost of fodder production, and open the production potential of high genetic stock. Fodder conserved as hay is important in improving the production of milk (Tolera, Citation2017).
Feed insecurity associated with prolonged and recurrent droughts remains a perennial challenge impeding livestock production in Kenya. To promote fodder production, conservation, and marketing as well as technology transfer to increase cattle productivity, the Kenyan government works with research institutions and other development organizations like the Kenya Climate Smart Agriculture Project (KCSAP), the United States Agency for International Development (USAID), the Agricultural Sector Development Support Program (ASDSP), and the International Fund for Agriculture Development (IFAD) (Thomas et al., Citation2023). In Homa Bay County, Kenya, farmers have continued to adopt fodder production to address the pasture shortage as well as to have extra income generated from livestock production (Joshua & Augustine, Citation2018).
The County Governments in collaboration with the International Livestock Research Institute (ILRI) have initiated efforts towards promoting fodder production to increase milk production and improve household income. Farmers involved in fodder farming produced different types of fodder including Napier grass, Brachiaria grass, crop residues, banana leaves, sweet potato vines, hay, banana stems, and desmodium. Commercial fodder production by the farmers in Homa Bay County is likely to lead to land resilience for increased biomass production; livestock resilience for increased livestock production, milk, meat, hides, and skins; and livelihood resilience through improved livelihoods, incomes, and reduced poverty. This study contributes insights on emerging trends regarding fodder production in Homa Bay County, Kenya, focusing on households producing Napier grass and those grazing on natural grass on their incomes. Napier grass is the most preferred fodder as it can withstand considerable periods of drought, produces greater dry matter (DM) yields than other tropical grasses, and is of high nutritive value for dairy cattle particularly when supplemented with high-quality feeds such as legumes (Khan et al., Citation2014; Nyambati et al., Citation2010). While there are several studies conducted on the effects of fodder production on household income and welfare in different regions, such studies provide varied levels of the effects of fodder production on household income. Similarly, there is a dearth of literature on the effects of fodder production on household income in the Kenyan context, especially in Western Kenya. Thus, this study aimed to fill the above gap existing in the literature by determining the effects of fodder production on household income in Homabay County, Kenya. This study provides policies that can be implemented by the government of Kenya to improve fodder production which also increases livestock productivity. With increased livestock productivity, farmers’ income levels also increase. Finally, the findings from this study contribute to the achievement of Kenya Vision 2030, Malabo’s commitment to enhancing the resilience of at least 30% of households and production systems by 2025, and the United Nations (UN) sustainable development goals (SDGs) of eradicating poverty, reducing hunger and combating climate change.
2. Methodology
2.1. Study area
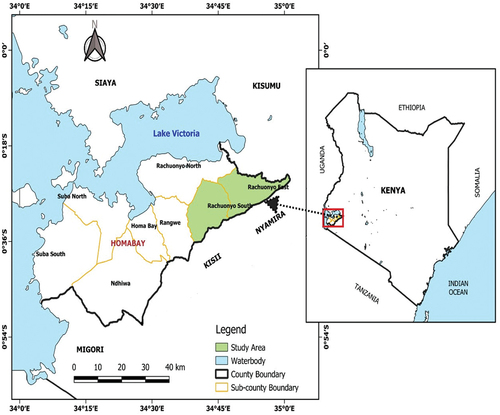
This study was undertaken in Homa Bay County, Kenya (Figure ). The County experiences an inland equatorial climate modified by the influence of altitude and its proximity to Lake Victoria which makes the area temperatures range from 17° C to 25°C. Homa Bay County is divided into two main relief areas namely; the upland plateau which starts at 1,220 meters above sea level and the lakeshore lowlands. The county experiences long rains starting from late March to June ranging from 800 mm-1800 m, and the short rains start in August to December and range from 250 mm-700 mm. Rachuonyo East and Rachuonyo South sub-counties receive reliable rainfall. Ecological zones in the areas range from Lower Midland2 to Lower Midland4 (LM2–LM4). The County has about 104,464 hectares for food crops 12,277 hectares for cash crops, 6000 hectares for horticultural crops, and 54 hectares for aquaculture (MoALF, Citation2016). It has 44,660 small farm holdings, between 1.2 to 3.0 acres on which food crops such as sweet potato, maize, cassava, and sorghum are grown. The region covers the upper and lower midland Agro-ecological zone and mainly consists of Humic Andosols, Orthic and Plinthic Acrisols soil types (MoALF, Citation2016) Fishing and agriculture including dairy farming are the main economic activities in the county. The main livestock kept in the County includes zebu cattle, the red Maasai sheep, the small East African goat, and indigenous poultry. Cattle, goats, and sheep are kept to cushion households against vulnerabilities as they can be sold to source for school fees and to offset medical costs whereas other farmers keep the livestock as a result of social factors such as payment of dowry. In Homabay County livestock has not been largely commercialized mainly because of limited grazing land among households. Furthermore, poverty levels as atof023 in Homa Bay county stand at 48% compared to the national poverty indicator at 45% (CIDP, Citation2023). Most of the farmers in the County depend on natural fodder. However, due to the climatic shocks in the County, some of the farmers shifted to feed conservation and diversification. Farmers in the warm and dry AEZs (LM2, LM3, LM4, and LM5) tend to farm Napier grass more as they are adversely affected by climate shocks (MoALF, Citation2016).
Figure 1. Map of the study area.
2.2. Sample and sample procedure
A multistage sampling technique was used. The first step was the purposive selection of two sub-counties (Rachuonyo East and Rachuonyo South). These two sub-counties were selected based on their response to the uptake of various fodder production technologies that were introduced by the Accelerated Value Chain Development (AVCD)program with the help of the International Livestock Research Institute (ILRI) as the lead project implementer in the region. Secondly, a systematic random sampling procedure was used where the first household to be interviewed was chosen randomly and the succeeding respondents were systematically selected after every second household. The sample size was determined using the formula by Cochran (Citation1963) for an infinite population (≥50000) as follows;
Where; n = required sample size; Z= confidence level (α = 0.05); p = proportion of the sample containing the major interest; q = 1-p and E=margin of error. Since the proportion of the population is not known with certainty, p = 0.5 is the assumption and q = 1–0.5 = 0.5, Z = 1.96 and E = 0.0566 (acceptable error term). According to Kothari (Citation2004), an error term of less than 10% is acceptable. Hence, the study used an error of 0.0566. This error was chosen to get the desired sample size that was able to fit the budget and the time duration for the study.
A sample of 300 farmers was selected from a population of fodder farmers in the two sub-counties. The 2019 Kenya National Bureau of Statistics (KNBS) data on the population of dairy cattle farmers in the 2 Sub-counties of interest (clusters) was used. A proportionate population size of respondents for each Sub-County was computed to get 300 respondents as shown in Table . Further, households that feed their livestock mostly on Napier grass and natural grass were selected in the ratio of 2:3 respectively. Farmers who mostly practice natural grazing provided the control.
Table 1. Distribution of sample size
2.3. Data collection
Primary data were collected electronically on Android smartphones and tablets through face-to-face interviews using a semi-structured questionnaire by a team of trained enumerators. Data was collected in June and July 2021 in Rachuonyo South and East sub-counties All the Ministry of Health guidelines against the COVID-19 virus were observed by the enumerators. The data obtained were then downloaded from Kobocollect as Comma-separated values (CSV) files and exported to STATA version 16.0 for analysis. To check the understandability and validity of the questionnaire before data collection, a pre-test was carried out. This helped in assessing the ease of respondents’ understanding of the questions and their appropriateness under the study context. It also helped in refining the questionnaire making it farmer-friendly.
2.4. Empirical model
2.4.1. Propensity score matching
This study used Propensity Score Matching (PSM). PSM is most appropriate for obtaining robust impact assessments (Bii, Citation2017). Previous studies on the impact of fodder production on household income have used similar techniques (Tesfaye et al., Citation2022). Farmers involved in fodder production produced different types of fodder, including Napier grass, Brachiaria grass, maize fodder, and desmodium. However, farmers in this study area mostly produced Napier grass with the rest of the farmers feeding their livestock mostly on natural grass since natural grass is the main source of feed for the majority of rural smallholder farmers in Homabay County. PSM is a two-step method where the first step is to determine the probability of participation which is estimated to calculate the propensity score for farmer households who participate in Napier grass production. In the second step, each farmer that grows Napier grass is matched with the farmer with a comparable propensity score to get the average treatment effect on treated (ATT). In this study, it is the average income effect of farmers that grow Napier grass.
It may not be possible to observe the outcome of the farmers that are involved in Napier grass production had they not produced Napier grass; hence it may be impossible to approximate the effect of Napier grass production on the income of each household. To solve this problem, households need to be assigned to treatment and control in experimental studies. However, for non-experimental studies, the fodder is not evenly distributed hence households choose what type of fodder to produce. The decision of a farmer to produce Napier grass or not is most likely grounded on self-selection since every farmer has different characteristics that may affect their involvement in decision-making and their welfare.
2.4.2. Estimation of propensity score
The probit model was used to estimate the predicted values of the probability of participation in Napier grass. The model is specified as in Equationequation 2(2)
(2) :
P(Xi) represents the probability of growing Napier grass, D = 1 for the growers and D = 0 for non-growers of Napier grass. The regression function is represented as in Equation 3
Where φ is the standard normal distribution, β0 represents the vector of coefficients, Xi is the vector of independent variables as in Table and εi is the error term.
Table 2. Covariates used for propensity score matching
There are several techniques used for matching, including local linear matching, radius, kernel stratification or interval matching and nearest neighbour matching. Rosenbaum and Rubin (Citation1983), emphasized the use of nearest-neighbour matching where each treatment is matched to the suitable control with the closest probability given a vector of observed covariates. This study thus used the nearest-neighbour matching technique.
According to Bryson et al. (Citation2002), introducing a common support state confirms that any grouping of observed characteristics in the set that is treated can be observed among the control group. Common support region is therefore the area where the minimum and maximum propensity scores of both the treatments and the controls are contained. In checking the region of common support, one should compare the minimum values and the maximum values of the propensity scores in both groups. This approach involves removing all the observations with propensity scores of less than the minima and more than the maxima in the other set. This ensured that observations that lie outside the region were rejected from the analysis.
In determining the effect of treating an individual i that is symbolized as λi is referred to as the difference between the potential outcome for treated and the potential outcome if not treated as illustrated in Equationequation 4(4)
(4) :
Where Yi = 1 for treatment (farmers growing Napier grass), Yi = 0, for control (farmers depending on Natural grass). In calculating the Average Treatment on Treated (ATT), the potential income from livestock output from farmers growing Napier grass is calculated from its counterfactual (farmers not growing Napier). Average Treatment on Untreated (ATU) is the difference between observed income and the counterfactual income for the farmers who are not growing Napier grass. The impact felt across all the farmers in the population was obtained by calculating the Average Treatment Effect (ATE) as in EquationEquation 5(5)
(5) :
E(λ) represents the expected or average value. The Average Treatment Effect on Treated (ATT) used in measuring the impact of fodder production on household income for the farmers growing Napier grass is represented in Equationequation 6(6)
(6) :
Average Treatment Effect on Untreated (ATU) as in EquationEquation 7(7)
(7) is used to measure the impact fodder production will have on the household income of the farmers that did not grow Napier grass (Counterfactual)
One of the problems is; that all the parameters cannot be observed since they are likely to depend on the counterfactual effects. For example, the average of a difference measures the difference of the averages, and the Average Treatment on the Treated was re-written as in Equationequation 8(8)
(8) :
Equation 15 represents the average effect that individuals who are treated would most likely obtain in the absence of the treatment, and this cannot be observed. On the other hand, the Y0 value for the farmers that are not treated is observed. Thus the causal effect (Δ) can be obtained in Equationequation 9(9)
(9) :
The difference between the causal effect (Δ) and ATT was attained by adding and subtracting the term, as in Equationequations 10(10)
(10) and Equation11
(11)
(11) :
SB denotes selection bias which is the difference between the counterfactual for farmers that are producing Napier grass (treated group) and the outcome that is observed for the controlled farmers (untreated/not producing Napier grass). If SB is equivalent to zero, then ATT was obtained by calculating the difference in mean between the observed mean for the treated and the untreated.
To obtain a better measure of the causal effect, one needs to deal with the selection bias effect. This can be obtained by pure randomization Successful randomization implies as in Equationequation 12(12)
(12) :
With successful randomization, the t-test would provide statistical insignificance.
2.5. Test for multicollinearity
A multicollinearity test was performed through the computation of the variance inflation factor (VIF) to ensure that the explanatory variables included in the model were not at all associated with one another. An estimation of a simple ordinary least square (OLS) regression was done for the dependent variable and the remaining explanatory variables. In ordinary least square regression, the VIF gauges how severe the multicollinearity is. Gujarati (2003) states that VIF demonstrates how the presence of multicollinearity causes an estimator’s variance to be inflated. VIF is calculated using the formula shown in EquationEquation 13(13)
(13) ;
where is the R2 of the regression with the ith independent variable as a dependent variable. The results of the VIF are presented in Table .
Table 3. Variance inflation factor (VIF) results
The VIF value of the predictor variables should neither be greater than 10 nor less than one (Gujarati, 2003). VIF value greater than 10 indicates multicollinearity (Gujarati, 2003). The mean VIF was 1.88. The VIF of the explanatory variables ranges from 1.09 to 3.97. The independent variables’ VIF is less than five. No significant correlations between any of the independent variables were established, ruling out the possibility of multicollinearity.
3. Results and discussion
3.1. Descriptive statistics
The household characteristics affecting the use of Napier grass and natural grazing among households raising cattle in Homa bay are household size, age, gender, education level, main occupation, group membership, types of cattle kept, total farm size and farm size under fodder. The results are presented in two tables: categorical variables in Table and continuous variables in Table .
Table 4. Categorical variables affecting use of Napier and natural grazing among farmers in Rachuonyo East and South sub-counties
Table 5. Continuous variables affecting use of Napier and natural grazing among farmers in Homa Bay County
Results in Table show that among the farmers who mainly fed their livestock on Napier grass, male farmers were 69% and females 31%, while male farmers were 72% and 28% female who grazed their cattle on natural grass. The chi-square results indicate that the gender of the Napier grass and natural grass farmers was statistically insignificant. This implies that the gender of the farmers was equally distributed among these two groups of farmers, but dominated by men. According to Maina et al. (Citation2020), male-headed households have access to land ownership, as well as resources and information that ensure that they can easily adopt new technologies.
Among Napier grass farmers, (3%) had no formal education, primary (18%), secondary (32%) and tertiary (47%) levels of education, respectively. On the other hand, 6%, 33%, 30% and 31% of the farmers who fed their cattle mainly on natural grass had no formal education, primary, secondary and tertiary level of education, respectively. The chi-square results indicate that education was statistically significant at a 1 per cent significance level, with implications that farmers who mainly fed their herd on Napier grass were more educated than those who grazed on natural grass. This finding is similar to that obtained by Mutimura et al. (Citation2018) which indicated that farmers who grew fodder had higher levels of education.
In terms of the main occupation, 29% of Napier grass and 40% of natural grass farmers respectively depended on business. On the other hand, 40% and 15% of Napier and natural grass farmers depended on formal employment. The result of the chi-square on main occupation was statistically significant at a 1% significance level, with the implication that Napier grass farmers had more resources in terms of occupation than natural grass farmers. This confirms the results by Njima (Citation2016) which indicated that the main occupation influences the decision of the farmers to grow fodder.
Results on group membership indicated that 65% of Napier grass farmers belonged to a cooperative group. On the other hand, 13% of natural grass farmers belonged to a group. The chi-square results indicated that group membership was statistically significant at a 1% significance level. This implies that the majority of farmers who mainly fed their cattle on Napier grass belonged to the cooperative group rather than those grazing on natural grass. According to Nchinda et al. (Citation2010), farmers who belong to groups are exposed to a variety of ideas as well as have easy access to information concerning new technology and innovation. In addition, these farmers have greater bargaining power, especially when they are purchasing farm inputs as well as marketing their farm output
In Table , the mean household size was 4 members for farmers who mainly fed their cattle on Napier grass and 5 members for farmers who practised natural grazing. The overall average household size was 4.85 members, which was higher than the national average of 3.4 persons (KNBS, 2019). Results of the t-test indicate that household size was significant at 5 per cent, with the implication that farmers who mainly fed their cattle on Napier grass had a smaller household size than farmers who mainly graze their cattle on natural grass. The larger household size provides family labour necessary for grazing animals. This is similar to the findings by Umeh et al. (Citation2016) which established that larger household size is the source of labour in agricultural production.
The average age of the farmers who mainly fed their cattle on Napier grass was 44 years, while those who grazed their cattle on natural grass were about 47 years. The t-test result indicates that the age of farmers was significant at a 5 per cent significance level. This implies that farmers who fed their cattle on Napier grass were younger than those who grazed cattle on natural grass. Younger farmers are responsive to fodder production technologies, including new types, such as Brachiaria, lucerne, and Boma Rhodes which have the potential to increase milk production among lactating cattle. This is contrary to the results obtained by Mutimura et al. (Citation2018) which found that older farmers were more likely to grow Brachiaria since they have more experience than younger farmers.
Results on the average number of cattle kept by farmers indicated that farmers feeding their cattle on Napier farms kept fewer animals (3.2) than those who mainly graze their animals on natural grass (3.4). However, the result of the t-test indicates that the total number of cattle was insignificant, thus explaining that there was no difference between the number of cattle owned among farmers who mainly fed their herd on Napier grass and those who mainly grazed on natural grass.
3.2. Estimation of the probability propensity scores
The probability of the households feeding their livestock on Napier grass and natural grass was estimated using the Probit model as in Table . All the observable covariates affecting participation and livestock income were considered in the model.
Table 6. Probit Estimation of factors influencing the decision of farmers to mainly feed their livestock on Napier grass
Results indicated that the estimated model performed well for the intended matching method with a Pseudo R2 of 90.45 per cent. The log-likelihood ratio for the model is −19.28 and the probability value of 0.000 implied that the regression coefficients were not equal to zero. Increased household size decreases the farmers’ probability of feeding their livestock on Napier grass by 43.17% at a 10 % significance level. This is probably because farmers with large household sizes use large proportions of their land to invest in crops that they consume directly while allocating less land for fodder production. This is similar to the findings by Davies and Gouveia (Citation2010) who found a negative significant relationship between household size and farmers’ participation in fodder production. However, this finding is different from Gebremedhin et al. (Citation2015) who mentioned that the size of farmers’ households is directly proportional to the demand for food as well as other income necessary to cater for other necessities, hence increasing the farmer’s participation in fodder production.
Increased herd size decreases the probability of farmers feeding their livestock on Napier grass by 39.31% at a 10% significance level. A possible reason is that farmers allocated small land sizes for fodder production thus the quantities of fodder produced remains insufficient to feed large herd size. This is different from the findings by Omollo et al. (Citation2018) who established that larger herd size influences the decision of farmers to grow fodder hence they would feed their cattle on fodder.
Labour required for land preparation was found to be statistically significant on the decision by the farmer to mainly feed their livestock on Napier by 67.69% at a 10% significance level. During land preparation, labour is important in incorporating fertilizers, reducing weeds, and increasing aeration as well as porosity in the soil (Baudron et al., Citation2019). In addition, more man-days for labour during land preparation makes the soil settle and facilitates the decomposition of soil organic matter (Baudron et al., Citation2019). Similarly, Turinawe et al. (Citation2012) mentioned that the demand for labour has a direct impact on the demand for fodder technologies with larger families likely to grow fodder.
Land size under fodder was found to increase the chances of feeding the livestock mainly on fodder by 1433% at a 1% significance level. Land is a productive asset that is used as collateral in accessing credit in investments for production activities (Komarek, Citation2010). The large size of land under fodder makes farmers produce more fodder which is adequate to feed their livestock and excess can be sold to get income that can cater for food and other necessities. This is in line with the study by Omollo et al. (Citation2018) which indicated that land size informs the decision of the farmer to grow fodder crops.
Access to extension contacts was found to decrease the likelihood of farmers feeding their livestock on Napier grass by 239.1%. This is contrary to previous findings where access to extension is likely to enhance the ability of farmers to join groups, where they receive training on fodder agronomy, fodder utilization and markets for their livestock output. As a result, these farmers decide to feed their livestock on various types of fodder, and hence high milk volume which translates to high household income. Our results are thus not in line with those obtained by Bahta and Bauer (Citation2007) which indicated that farmers who had more extension services were exposed to more information, especially on the current farming technology.
3.3. Region of common support
The region of common support is used to ensure that treatments have closer observations in the nearby propensity score distribution (Heckman et al., Citation1997). Results in Table and Figure indicate that there were about 106 cases in the treatment group that were outside the region of common support. The individuals between treatment and control groups in which the characteristics were observed could be compared since they fall in the region of common support, hence the inferences can be made about causality.
Figure 2. Region of common support from the propensity score matching.
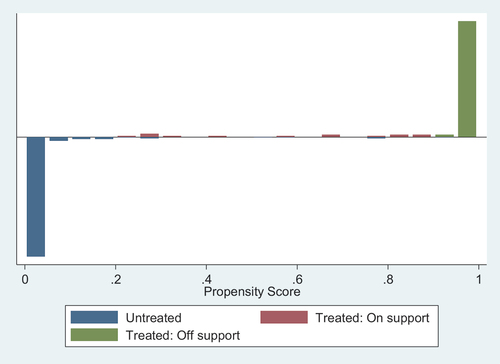
Table 7. Region of common support
Before determining the impact of fodder production on livestock income, balancing properties of propensity scores need to be taken into consideration in ensuring that observations have a distribution of the propensity scores or not. The balancing check of covariates is used to compare any significant differences between the matching algorithms by use of the nearest neighbour matching technique (Tolemariam, Citation2022). The balancing power between the estimators of the matched and unmatched households that feed their livestock on fodder was estimated using test methods such as reduction in mean, percentage reduction in bias and equality of means using the t-test.
3.4. Testing for covariate balance between treated and control groups
The covariate imbalance was checked after matching with a propensity score-test command. It shows a percentage reduction in bias, referred to as a standardized bias. According to Rosenbaum and Rubin (Citation1983), a good bias reduction is below 5%, although a reduction of below 10% is reasonable.
Table indicates that the matching was less biased in the covariates which were below 10%. The standardized bias difference before matching was ranging between 2.2% and 169.5%, with a statistical difference before matching. After matching, results indicated that the standardized bias difference was between 0.3% and 49.2% in absolute terms. This shows that there was a significant difference between the matched and unmatched data, hence the high degree of covariate balance between treatment and control groups was created.
Table 8. Propensity score test for covariates based on nearest neighbor matching technique
3.5. Average treatment effects on income
The average income earned by farmers was compared for the farmers who mainly fed their livestock on Napier grass and those who practised direct natural grazing to determine the impact of fodder production on household income. The results indicate that there was a significant difference (p > 0.08) between the incomes of farmers who mainly fed their livestock on Napier grass and those who practised natural grazing (Table ). The average income of farmers who mainly fed their livestock on Napier grass in a season was Ksh. 15707.04 (USD 103.11) which was a higher figure compared to the average income of farmers who mainly fed their livestock on natural grass, which was Kshs. 11790.48 (USD 77.40). This means that feeding livestock on Napier grass increases the income of farmers by Kshs. 3916.67 (USD 25,71) or by 24.94% after controlling for the differences in both socio-economic and institutional factors for both the treated and control groups. This suggests that fodder production and utilization play a significant role in improving the income status of livestock farmers in Rachuonyo East and Rachuonyo South Sub-counties.
Table 9. Average treatment effects on income
Farmers who mainly feed their livestock on Napier grass fetch higher income from livestock production compared to those who feed their livestock on natural grass. However, the difference in income was 24.94%, which could be explained by the adequate food supply for the livestock from fodder and the different forms of fodder utilized. The values of the controls and the treated outcome variable were close, with implications that the confounder can be simulated to provide a large outcome value. The study indicates that the ATT estimates for the income of the household are robust indicators of the effects of fodder production on livestock income.
3.6. Sensitivity Analysis
Since the PSM technique cannot fully adjust for unobservable characteristics, Aakvik (Citation2001) proposed using the Mantel and Haenszel (Citation1959) test statistic for detecting hidden bias (Tagel and Anne, 2015). Thus, the purpose of sensitivity analysis is to determine the robustness of the estimated treatment effects. Mhbounds was used in computing Mantel- Haenszel Bounds for variable treatment in checking for sensitivity analysis of the average treatment effects as well as the critical hidden bias. The Mantel-Haenszel non-parametric test compares the successful number of participants against the same expected number given that participation is zero. According to Becker and Caliendo (Citation2007), the hidden bias arises when unobserved factors influence the decision to participate in an activity. Sensitivity analysis was used to compare the baseline treatment effects together with the simulated treatment effects by comparing the values of the outcome effects and selection effects.
Table has the results of the Mhbounds where ┌ = 1 shows the absence of unobserved factors and they were increased by 0.05. Results of the sensitivity analysis indicate that the estimated treatment effects were insensitive to the unobserved bias, with gamma ranging from 1 to 1.5. A gamma level of 1.5 implies that all individuals with the same independent variables vector differ from those who feed their livestock on natural grass by a factor of about 0.5 per cent. The different levels of bounds indicate the degree to which unobserved negative and positive selection effect becomes significant. Results show that Q_mh+ and Q_mh- test statistic has almost similar results across the bounds as a result of the unobserved factors. The positive values of Q_mh+ imply a positive selection bias, where farmers that mainly feed their livestock on fodder have a high income from livestock. The insignificant values of P_mh+ and P_mh- indicate that there was no bias, hence there were no cases of underestimation and overestimation of the treated effect. Results indicated that the study was insensitive to bias that could make changes in income from livestock as a result of fodder production.
Table 10. Mantel- Haenszel for household income
4. Limitations of the study
The study is limited by the use of questionnaires to collect primary data since respondents rely on recall information, which may not be correct but is a frequent limitation of surveys of a similar nature. This study’s use of primary cross-sectional data and exclusive focus on fodder farmers in Homabay County, Kenya, is another drawback. An examination of how impact may change over time in the region might be possible using a longitudinal approach and qualitative data as well. Despite its limitations, this study offers some interesting viewpoints into the effects of fodder production on smallholder farmers’ household income in Homabay County, Kenya, and provides baseline information for conducting related case studies in other settings within the country and beyond.
5. Conclusion and policy recommendations
The findings of this study revealed that the quantity of labour put into land preparation, the area of land utilized for fodder production, the number of extension contacts, and accessibility to training all had a favourable influence on farmers’ likelihood of primarily feeding their livestock on Napier grass. On the other hand, the likelihood that farmers would feed their cattle with fodder was negatively influenced by household size, herd size, and the quantity of manure used. The findings reveal a significant income disparity between farmers who mostly grazed their cattle on natural grass and those who fed their cattle Napier grass. Compared to farmers who largely let their cattle graze on natural grass, those who predominantly fed their herds Napier grass made much more money. The use of various types of fodder and the sufficient supply of fodder are credited with this.
Farmers require access to information media, including television, radio, and other print media, thus the government and policymakers need to focus on these media sources. As a result, farmers would have more information on the different types of fodder, the volume produced, and the benefits. To increase farmers’ income, the national and county governments should make fodder production a priority for livestock development in their policy plans. This is because there was a significant difference in the incomes of farmers who mostly fed their cattle Napier grass against those who primarily grazed their cattle on natural pastures, indicating the potential for fodder to increase farmers’ income.
Contributions
All the authors contributed to this work.
Ethics approval
Ethical approval was granted by the Egerton University Ethics Review Committee and the National Commission for Science, Technology and Innovation (NACOSTI).
Data availability statement
The data that support the findings of this study are available from the corresponding author upon reasonable request.
Disclosure statement
No potential conflict of interest was reported by the author(s).
Additional information
Notes on contributors
Mary Stacey Ayuko
Mary Stacey Ayuko holds a Master of Science in Agricultural and Applied Economics (CMAAE) from Egerton University, Kenya/University of Pretoria, South Africa.
Job Kibiwot Lagat
Job Kibiwot Lagat is an Associate Professor of Agricultural Economics in the Department of Agricultural Economics and Agribusiness Management at Egerton University, Kenya.
Michael Hauser
Michael Hauser works at the Research Program Enabling Systems Transformation, International Crops Research Institute for the Semi-Arid Tropics (ICRISAT) & Institute for Development Research, University of Natural Resources and Life Sciences, Vienna
Kevin Okoth Ouko
Kevin Okoth Ouko is a Research Associate Consultant at WorldFish. He recently completed a PhD in Food Security and Sustainable Agriculture from Jaramogi Oginga Odinga University of Science and Technology, Kenya, and an MSc in Agricultural and Applied Economics from Egerton University, Kenya/University of Pretoria, South Africa. His research expertise includes food systems, food security, aquaculture value chains, climate change, development finance, and gender and social inclusions.
Dick Chune Midamba
Dick Chune Midamba is a PhD Candidate in Agricultural Economics at Maseno University, Kenya. He currently works at Equity Group Foundation as an Enterprises Development Officer. His research interest includes Technical efficiency, the adoption of sustainable agricultural technologies, Crop diversity, Resource optimization for cash–food crop production, and Sustainable agriculture.
References
- Aakvik, A. (2001). Bounding a matching estimator: The case of a Norwegian training program. Oxford Bulletin of Economics and Statistics, 63(1), 115–20. https://doi.org/10.1111/1468-0084.00211
- Altech. (2018). 7th Annual Alltech Global Feed Survey 2018. Alltech Global Feed Survey. Retrieved November 3, 2021 from https://www.alltech.com/press-release/2018-alltech-global-feed-survey-estimates-world-feed-production-excess-1-billion.
- Auma, J., Omondi, I., Githinji, J., Rao, E. J., Lukuyu, B., & Baltenweck, I. (2018). USAID- Kenya crops and dairy market systems activity: Feed and fodder value chain assessment. Nairobi. https://cgspace.cgiar.org/bitstream/handle/10568/100637/feed_fodder.pdf?sequence=3
- Bahta, S. T., & Bauer, S. (2007). Analysis of the determinants of market participation within the South African small-scale livestock sector. Tropentag Paper, Tropentag, October, 9–11.
- Baudron, F., Misiko, M., Getnet, B., Nazare, R., Sariah, J., & Kaumbutho, P. (2019). A farm-level assessment of labor and mechanization in Eastern and Southern Africa. Agronomy for Sustainable Development, 39(2), 1–13. https://doi.org/10.1007/s13593-019-0563-5
- Becker, S. O., & Caliendo, M. (2007). Sensitivity analysis for average treatment effects. The Stata Journal, 7(1), 71–83. https://doi.org/10.1177/1536867X0700700104
- Bii, K. (2017). Evaluation of Factors Influencing Smallholder Dairy Farmers’ Decision to Deliver Milk to Cooling Plants in Sotik Sub-County, Kenya, [ MSc. Thesis], Egerton University, .
- Bryson, A., Dorsett, R., & Purdon, S. (2002). The uses of propensity matching in the evaluation of active labour market policies. Working Paper No.4, Department for Work and Pensions. https://eprints.lse.ac.uk/4993/1/The_use_of_propensity_score_matching_in_the_evaluation_of_active_labour_market_policies.pdf
- CIDP. (2023). Homa Bay County Integrated Development Plan 2023-2027. https://repository.kippra.or.ke/handle/123456789/4354
- CNFA, C. N. (2013). Fodder fortification improves lives for farmers and livestock keepers in kenya’s tana river county. Retrieved 2021, from CNFA. http://www.cnfa.org/resource/fodder-fortification-improves-lives-for-farmers-andlivestock-keepers-in-kenyas-tana-river-county.
- Cochran, W. G. (1963). Sampling Technique (2nd ed.). John Wiley and Sons Inc.
- Davies, S. J., & Gouveia, A. (2010). Response of common carp fry fed diets containing a pea seed meal (Pisum sativum) subjected to different thermal processing methods. Aquaculture, 305(1–4), 117–123. https://doi.org/10.1016/j.aquaculture.2010.04.021
- Gebremedhin, B., Hoekstra, D., Tegegne, A., Shiferaw, K., & Bogale, A. (2015). Factors determining household market participation in small ruminant production in the highlands of Ethiopia. LIVES Working Paper 2. https://hdl.handle.net/10568/65204
- Heckman, J., Ichimura, H., & Todd, P. (1997). Matching as an econometric evaluation estimator: Evidence from evaluating a Job training programme. The Review of Economic Studies, 64(4), 605–654. https://doi.org/10.2307/2971733
- Joshua, O. O., & Augustine, O. (2018). Review of challenges and opportunities for dairy cattle farming under a mixed system of Homa Bay County, Western Kenya. Journal of Agricultural Extension & Rural Development, 10(10), 202–210. https://doi.org/10.5897/JAERD2018.0987
- Khan, Z. R., Midega, C. A. O., Nyang’au, I. M., Murage, A., Pittchar, J., Agutu, L. O., Amudavi, D. M., &Pickett, J.A. (2014). Farmers’ knowledge and perceptions of the stunting disease of Napier grass in Western Kenya. Plant Pathology, 63(6), 1426–1435. https://doi.org/10.1111/ppa.12215
- Kilelu, C. W., Koge, J., Kabuga, C., & Lee, J. (2018). Performance of emerging dairy services agri-enterprises a case study of youth-led service provider enterprises (SPE). https://library.wur.nl/WebQuery/wurpubs/fulltext/446466
- Komarek, A. (2010). The determinants of banana market commercialization in Western Uganda. African Journal of Agricultural Research, 5(9), 775–784.
- Kothari, C. R. (2004). Research methodology: Methods and techniques. New Age International. http://eprints.itn.ac.id/id/eprint/13616
- Lugusa, K. O. (2015). Fodder production as an Adaptation Strategy in the Drylands: A case study of Producer groups in Baringo County, Kenya. https://www.researchgate.net/profile/Klerkson-Lugusa/publication/286934640_Fodder_Production_as_an_Adaptation_Strategy_in_the_Drylands_A_Case_Study_of_Producer_Groups_in_Baringo_County_Kenya/links/5671488208ae2b1f87aee224/Fodder-Production-as-an-Adaptation-Strategy-in-the-Drylands-A-Case-Study-of-Producer-Groups-in-Baringo-County-Kenya.pdf
- Maina, K., Ritho, C. N., Lukuyu, B. A., & Rao, E. J. (2020). Socio-economic determinants and impact of adopting climate-smart Brachiaria grass among dairy farmers in Eastern and Western regions of Kenya. Heliyon, 6(6), e04335. https://doi.org/10.1016/j.heliyon.2020.e04335
- Makau, D. N., VanLeeuwen, J. A., Gitau, G. K., McKenna, S. L., Walton, C., Muraya, J., & Wichtel, J. J. (2020). Effects of Calliandra and Sesbania on daily milk production in dairy cows on commercial smallholder farms in Kenya. Veterinary Medicine International, 2020. https://doi.org/10.1155/2020/3262370
- Mantel, N., & Haenszel, W. (1959). Statistical aspects of the analysis of data from retrospective studies of disease. Journal of the National Cancer Institute, 22(4), 719–748. https://doi.org/10.1093/jnci/22.4.719
- Mawa, L. I., Kavoi, M. M., Baltenweck, I., & Poole, J.(2014). Profit efficiency of dairy farmers in Kenya: An application to smallholder farmers in Rift Valley and Central Province. Journal of Development and Agricultural Economics, 6(11), 455–465. https://doi.org/10.5897/JDAE2014.0561
- Meyerhoff, E. (2012). Pasture Development for land rehabilitation in Baringo: Retrieved May 05, 2022 http://www.agriculturesnetwork.org/magazines/east-africa/desertification/pasturedevelopment-for-land-rehabilitation-in-baringo.
- MoALF. (2016). Climate risk profile for Homa Bay County. In Kenya county climate risk profile series. The Ministry of Agriculture, livestock and fisheries (MoALF). Nairobi. https://hdl.handle.net/10568/80450
- MoALF. (2017). Repositioning the fodder value chain for sustainable livestock production in Kenya. https://icpald.org/wp-content/uploads/2018/05/Fodder-Conference-Report-16012018-Kenya.pdf
- Musalia, L. M., Odilla, G. A., Nderi, O. M., & Muleke, V. (2016). Current status of fodder production, conservation and marketing in the arid and semi-arid lands of Tharaka Nithi County, Kenya. African Journal of Agricultural Research, 11(26), 2337–2347. https://doi.org/10.5897/AJAR2016.11162
- Mutimura, M., Ebong, C., Rao, I. M., & Nsahlai, I. V.(2018). Effects of supplementation of brachiaria brizantha cv. Piatá and Napier grass with desmodium distortum on feed intake, digesta kinetics and milk production in crossbred dairy cows. Animal Nutrition, 4(2), 222–227. https://doi.org/10.1016/j.aninu.2018.01.006
- Mutimura, M., Ebong, C., Rao, I. M., & Nsahlai, I. V.(2018). Effects of supplementation of brachiaria brizantha cv. Piatá and Napier grass with desmodium distortum on feed intake, digesta kinetics and milk production in crossbred dairy cows. Animal Nutrition, 4(2), 222–227. https://doi.org/10.1016/j.aninu.2018.01.006
- Mwendia, S. W., Ohmstedt, U., & Peters, M. (2020). Forage seed systems in Kenya-2020 report. https://cgspace.cgiar.org/bitstream/handle/10568/111370/%5B60%5D%203.4.1.7.2%20Forage%20seed%20Systems%20In%20Kenya%20Report%20%28002%29-SM.pdf?sequence=1
- Nchinda, V. P., Ambe, T. E., Holvoet, N., Leke, W., Che, M. A., Nkwate, S. P., & Njualem, D. K.(2010). Factors influencing the adoption intensity of improved yam (Dioscorea spp.) seed technology in the western highlands and high guinea savannah zones of Cameroon. Journal of Applied Biosciences, 36, 2389–2402. https://www.cabdirect.org/cabdirect/abstract/20113087922
- Njima, P. M. (2016). An assessment of factors influencing production of hydroponics fodder among smallholder dairy farmers in Kiambu sub county, Kenya. [Doctoral dissertation]. University Of Nairobi. http://erepository.uonbi.ac.ke/handle/11295/97579
- Nyambati, E. M., Muyekho, F. N., Onginjo, E., & Lusweti, C. M. (2010). Production, characterization and nutritional quality of Napier grass [Pennisetum purpureum (Schum.)] cultivars in Western Kenya. African Journal of Plant Science, 4(12), 496–502. https://academicjournals.org/article/article1380128017_Nyambati%20et%20al.pdf
- Omollo, E. O., Wasonga, O. V., Elhadi, M. Y., & Mnene, W. N. (2018). Determinants of pastoral and agro-pastoral households’ participation in fodder production in Makueni and Kajiado counties, Kenya. Kenya, 8(1). https://doi.org/10.1186/s13570-018-0113-9
- Ouma, O. E. (2017). Analysis of fodder production and marketing in the rangelands of Southern Kenya. [Unpublished MSc. Thesis]. https://d1wqtxts1xzle7.cloudfront.net/82347715/Omollo_Erick_O_Analysis_of_Fodder_Production_and_Marketing_in_the_Rangelands_of_Southern_Kenya-libre.pdf?1647682603=&response-content-disposition=inline%3B+filename%3DAnalysis_of_Fodder_Production_and_Market.pdf&Expires=1702279369&Signature=LV06OHvcj-kMRZWI4FWaKcM6OKRxAseQu4fBM7PZDLXXjGOiqtO53v1Dx3f1r5H21ZF8j79v8q-R5CLjjfEuVd5kTwAItvlv6L6LXIeGB-IhXiPEIuiUL~gwS-IZmRTf5IQQySpgKVc6ugdTbjta6eOGV~e3u5T78OIU-PtzZ7MinnC760JsA0uH1IoDDfaBUBQsBYFM110doivThaj-Oa57g6RyTvVEpRwzOeciYR322SJF8mRhb101YT1kGhUNF5aUt79068GSIcxHYFmXjuszmTu-fkh-z~396rHqMHsVFI0I1XNOI~-LMvDh06Vrv1EmD09qrXfDGkcSoBbH0w__&Key-Pair-Id=APKAJLOHF5GGSLRBV4ZA
- Pandey, R. (2011). Consumption and valuation of livestock fodder under different forest types of Himalayas, India. Silva Lusitana, 19(2), 195–207.
- Pandey, R., Harrison, S., & Gupta, A. K. (2014). Resource availability versus resource extraction in forests: Analysis of forest fodder system in forest density classes in lower Himalayas, India. Small-Scale Forestry, 13(3), 267–279. https://doi.org/10.1007/s11842-013-9253-3
- Paterson*, R. T., Karanja, G. M., Nyaata, O. Z., Kariuki, I. W., & Roothaert, R. L. (1998). A review of tree fodder production and utilization within smallholder agroforestry systems in Kenya. Agroforestry Systems, 41(2), 181–199. https://doi.org/10.1023/A:1006066128640
- Place, F., Roothaert, R. L., Maina, L., Franzel, S., Sinja, J., & Wanjiku, J. (2009). The impact of fodder trees on milk production and income among smallholder dairy farmers in East Africa and the role of research. World Agroforestry Centre Occasional Paper. https://cgspace.cgiar.org/bitstream/handle/10568/2345/OP16490.pdf?sequence=3
- Rosenbaum, P., & Rubin, D. B. (1983). The central role of the propensity score in observational studies for causal effects. Biometrika, 70(1), 41–55. https://doi.org/10.1093/biomet/70.1.41
- SPORE. (2015). FEEDING AFRICAS LIVESTOCK: Fodder and forage solutions. Michael Hailu.
- Tesfaye, M., Gutema, P., & Xiao, X. (2022). Research article impact of improved forage technology adoption on dairy productivity and household income: A propensity score matching Estimation in Northern Ethiopia. Advances in Agriculture, 2022, 1–15. https://doi.org/10.1155/2022/6197119
- Thomas, K., Yegon, R., Nthiwa, D., & Migose, S. A. (2023). Strategies of positive deviants in fodder conservation among smallholder dairy farming systems in highlands and midlands of Kenya. https://doi.org/10.21203/rs.3.rs-2807273/v1
- Tolemariam, A. (2022). Impact assessment of input and output market development interventions by IPMS Project: The case of Gomma Woreda. MSc Thesis in Agriculture (Agricultural Economics). Haramaya University, Haramaya(Ethiopia). https://hdl.handle.net/10568/3168
- Tolera, A. (2017). Good practices in fodder and fodder seed production and marketing for increased Private sector investment. Proceedings of the Regional Workshop Organized by ICPALD/IGAD, April 6 to 7, 2017, Pelican Resort, Elementaita, Kenya (pp. 1–64).https://icpald.org/wp-content/uploads/2018/05/IGAD-Fodder-and-Fodder-seed-regional-workshop-proceedings-13-July-2017-No-Track.pdf
- Turinawe, A., Mugisha, J., & Kabirizi, J. (2012). Socio-economic evaluation of improved technologies in smallholder dairy farming systems in Uganda. Journal of Agricultural Science, 4(3). https://doi.org/10.5539/jas.v4n3p163
- Umeh, O. J., & Olajade, J. C. (2016). Comparative assessment of the Socio-Economic Factors Influencing Farmers’ Awareness and Utilization of Technologies from Agricultural Development Programme (ADP) in south-east agro-ecological zone. TLEP International Journal of Biotechnology. https://d1wqtxts1xzle7.cloudfront.net/49559934/Comparative_assessment_of_the_Socio-Economic_Factors_Influencing-libre.pdf?1476332787=&response-content-disposition=inline%3B+filename%3DComparative_assessment_of_the_Socio_Econ.pdf&Expires=1702280827&Signature=P96zan3TUw2gkHBPMvj8pRLd7NyEo0YmBGmMQnc0Fu6N2ibZgkdJRQJqIvwcoYK818FIe~jQ4cUVEDMiHFjfb0hq7bM8r4Q1TIe7eczVEtjmOdEj0csNm~YCOyYau8FNMQdf-NvS5CcTgCoV4rL3dIA2D89rBezzsrAeBqolJaRX~wQPu5Tdmj03bn9SpHugDucp8X1Pj~oL5nPDp6RvVjJjfhHwDNyiWh--9BCdswQnXvDrL5wr5gt00PB9DUrNVUPk06mf0VxFtt7aqhe1Opb6oNkikpCyvlLqs-gA4QiU9OWMSkcdx4CfbdqlT60WvcERigUl13NQqPoBNs7Cdg__&Key-Pair-Id=APKAJLOHF5GGSLRBV4ZA
- VSF-Suisse. (2009). ELMT technical brief. Retrieved 03 05/03/2021, 2021,From FODDER PRODUCTION: Experiences and Lessons Learnt: www.elmtrelpa.org/…/ELMT%20TECHNICAL%20BRIEF_fodder%20production
- Wairore, J., Mureithi, S., Wasonga, O., & Nyberg, G. (2015). Enclosing the commons: Reasons for the adoption and adaptation of enclosures in the arid and semi-arid rangelands of Chepareria, Kenya. Springerplus, 4(1), 1–11. https://doi.org/10.1186/s40064-015-1390-z
- Wambugu, C., Place, F., & Franzel, S. (2011). Research, development and scaling up the adoption of fodder shrub innovations in East Africa. International Journal of Agriculture, 9(1), 100–109. https://doi.org/10.3763/ijas.2010.0562