
 ?Mathematical formulae have been encoded as MathML and are displayed in this HTML version using MathJax in order to improve their display. Uncheck the box to turn MathJax off. This feature requires Javascript. Click on a formula to zoom.
Abstract
Although the 2030 Agenda’s aim of "zero hunger and malnutrition" has achieved tremendous progress, the prevalence of food insecurity and malnutrition is constantly rising worldwide. Hence, determining the variables influencing the food and nutrition security of wheat farmers in Arsi Zone of Ethiopia’s was the aim of this study. A random sampling technique was used to collect primary data from 422 households spread over three districts. Household dietary diversity score and calorie acquisition score were used to measure the nutrition and food security status, respectively. The result of descriptive statistics revealed that 70.85% of the sample households were food secure while the remaining 29.15% were insecure. Likewise, it was found that 26.07%, 52.61%, and 21.33% of the sample households had low, medium, and high nutritional levels, respectively. The result of the binary logit model pointed out that livestock holding, frequency of extension contact, inorganic fertilizer, irrigation, and vegetation coverage were positively associated with the likelihood of food security whereas family size and distance from the market were negatively associated with it. The results of ordered logit showed that the level of education, participation in safety-net programs, total income, farm size, market information, and soil fertility had positive and significant effects on household nutritional status while the distances to the market and health center were negatively associated with it. Thus, strong attention should be given in improving land, and livestock productivity, family planning, farmers’ education, soil fertility of wheat farms, interactions with extension agents, and utilizing irrigation technologies.
1. Introduction
The ever-increasing global population and the rising demand for food and nutrition security would not be sustainable unless considering its synergy with the environment. Similarly, malnutrition and food insecurity are still on the rise globally even though tremendous progress has been made toward the 2030 Agenda’s sustainable development goal of “zero hunger and malnutrition” (FAO et al., Citation2023). Hence, the issue of food and nutrition security has been a global concern for decades given the size of the population that suffers from hunger and malnutrition (Belachew, Citation2018). According to the FAO (Food and Agriculture Organization) (Citation2023) report, 735 million people worldwide experienced chronic hunger in 2022. Hence, in comparison to 7.9% in 2019, the percentage of the global population experiencing chronic hunger was approximately 9.2% in 2022. Besides, due to the growth in the population, rapid urbanization, and subsequent changes in consumption patterns, it is predicted that the world will require an additional 70% increments of food production to feed an additional 2.3 billion people by the year 2050 (FAO (Food & Agriculture Organization), Citation2020). In SSA, it is estimated that currently, about 20 million people need food assistance due to the impacts of drought, low productivity, displacement, significant reduction in rainfall, conflict, insecurity, COVID-19, and macroeconomic challenges (FEWSNET (Famine Early Warning Systems Network), Citation2021). A total of 37.7 million people in Ethiopia experienced in December 2021, up from 5.6 million in December 2016 due to drought, northern Ethiopian war, insecurity, and crop diseases among the main drivers (FAOSTAT (Food & Agriculture Organization statistics data), Citation2021).
Similarly, nutrition security, which is broader than the issue of hunger has been a current global issue given the number of people that suffer from malnutrition (FAO (Food & Agriculture Organization), Citation2023). Therefore, even if people consume enough calories to meet their daily needs, they may still suffer from hidden hunger, which can lead to a variety of problems, including children’s impaired physical and mental development, the rise in illness, mental retardation, blindness, and general declines in potential and production (Victora et al., Citation2008). Globally, malnutrition affects more than two billion people, which is about 25% of the world’s population (WHO, 2023), and rises from period to period mainly due to the existence of conflict, changes in climatic conditions, and COVID-19. Ethiopia has also the largest prevalence of undernourishment people accounting for more than 18 million people and has become the most prevalent country in undernourishment from SSA (ADB (Africa Development Bank), Citation2020). Therefore, it is estimated that chronic malnutrition eventually costs Ethiopia 16.5% of its GDP annually (WFP (World Food Program), Citation2020). Consequently, the development of a productive workforce and long life expectancy depend on guaranteeing the availability, accessibility, safety, and quality consumption of nutritious foods for all individuals at all times.
Wheat (Triticum aestivum and T. durum) is the second leading staple cereal crop next to corn in the world in terms of total production (FAO (Food & Agriculture Organization), Citation2020). Hence, its productivity increment plays a significant role in reducing food and nutrition insecurity (Atinafu et al., Citation2022). Nutritionally, since it is an important source of starch, and energy, notably protein, vitamins, dietary fiber, and phytochemicals, it is used to lower the risk of heart disease, type 2 diabetes, and certain types of cancer (Peter and Sandra, Citation2015). Similarly, Ethiopia is the first wheat-producing country in SSA followed by South Africa, Sudan, and Kenya (ATA (Agricultural Transformation Agency), Citation2020). Hence, in terms of total production wheat production ranks third next to maize and teff with 1.86 million hectares of land, and productivity of 31.11 quintals per hectare in the country (ESS (Ethiopian Statistical Service), Citation2022). Similarly, in the Oromia region, wheat production took the third rank with 1.95 million numbers of holders, 1.03 million hectares of land, and productivity of 33.64 quintals per hectare (ESS (Ethiopian Statistical Service), Citation2022). The same source pointed out that, in the study area, Arsi zone, wheat production had the second rank in terms of production next to maize with 393,316 numbers of holders, 256,172.2 hectares of land, and productivity of 35.30 quintals per hectare. Thus, it contributes significantly to the social and economic development of smallholder farmers in the study area and remains a strategic crop to meet the growth in demand for food (Zeleke et al., Citation2021). Though Ethiopia currently leads sub-Saharan Africa in wheat production, there is still an opportunity for improvement, as the country’s wheat output is insufficient to meet its needs (ATA (Agricultural Transformation Agency), Citation2022).
In Ethiopia, Tekle and Birhanu (2015), Adugna et al. (Citation2016), Kassie et al. (Citation2018), Tsegaye (Citation2018), Sime,(Citation2020), Mohammed et al. (Citation2021), Debeli et al. (Citation2021), Muleta and Getahun (Citation2021), Melese et al. (Citation2021), Fikire and Zegeye, (Citation2022), Getaneh et al. (Citation2022), and Bahiru et al. (Citation2023) looked at the status and factors that affect household level food security. Nevertheless, they only consider the factors that affect food security, ignoring the problem of nutrition security in their research. Similarly, Kassie and Workie (Citation2020), Tewabe and Belachew (Citation2020), Derbie et al. (Citation2022), and Wakwoya et al. (Citation2022) conducted their study on the determinants of nutritional status in Ethiopia. However, their studies were limited to children under five years of age, school-aged children, old age population, and pregnant women, respectively. Moreover, Yuya et al. (Citation2022) and Feyisa et al. (Citation2023), investigated the determinants of food and nutrition security altogether. Nevertheless, Feyisa et al. (Citation2023) restricted their investigation to households in central and eastern Ethiopia, and they employed a distinct measurement tool, the food consumption score, instead of the household calorie acquisition method utilized in this study. Infact, Yuya et al. (Citation2022) used the food consumption score, which is similar methodology to the current study. However, their study was carried out in a distinct agro-ecological setting from the Arsi zone, the current study’s study area.
Arsi Zone is consistently subject to transitory food insecurity, and to the socio-economic factors that generate and worsen conditions of chronic vulnerability to food insecurity due to drought and other various shocks (AZOANR (Arsi Zone Office of Agriculture & Rural Development), Citation2022). Hence, because of a significant reduction in productivity due to manmade and natural-related factors, the study area faced food security problems like that of other parts of the country (Tsegaye, Citation2018). Hence, the government has recognized these claims and included several districts of this zone in its national food security program (AZOANR (Arsi Zone Office of Agriculture & Rural Development), Citation2022). To the best of our knowledge, no similar study has yet measured the status and determinants of food and nutrition security altogether in the study area. Thus, to fill all these gaps and expand the scope of knowledge, this study aimed to measure the status and identify the factors influencing the food and nutrition security of wheat producers in the Arsi zone, known for the production of wheat.
2. Research methodology
2.1. Description of the study area
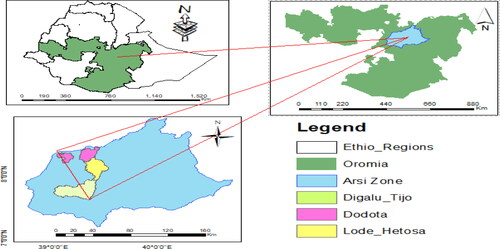
Arsi zone is situated within a total area of 21,008 km2 in the Oromia National Regional State of Ethiopia. It borders the Bale zone to the south, the West Arsi zone to the southwest, the East Shewa zone to the northwest, the Afar Region to the north, and the West Hararghe zone to the east. Assela town, the zone’s capital, is situated 75 kilometers south of Adama town and 175 kilometers from Addis Ababa ().
Figure 1. Location of the study area.
2.2. Data types and methods of collections
This study included both primary and secondary data. To improve some of the questions based on the feedback obtained from the pre-testing exercise, primary data was collected by trained enumerators using a semi-structured questionnaire that was prepared after conducting an informal survey. Secondary data was also gathered in the year 2022 from the Arsi zone and the selected districts offices of agriculture and rural development, published and unpublished documents that are relevant for the general description and verification of the primary data.
2. 3. Sampling technique and sample size
To select the sample households for this study, a multistage sampling technique was employed. In the first stage, the Arsi zone was selected purposively due to its potential in the production of wheat. In the second stage, out of the 25 districts in the Zone, three were purposefully chosen based on their potential for wheat production and the existence of wheat technology interventions. Hence, Digalu Tijo from the highland, Lode Hetosa from the midland, and Dodota district from the lowland were selected. In the third stage, 3 kebeles1 from Dodota, 4 Kebeles from Lode-Hetosa, and 5 kebeles from Digalu-Tijo districts were selected randomly based on the proportion of the number of kebeles in each district and hence, via the simple random sampling method, a total of twelve kebeles were chosen. Using random sampling techniques, 422 wheat-producing households were chosen in the final stage from the twelve kebeles chosen among the three districts, taking into account the proportionate sample size (). The formula presented by Kothari (Citation2004) was utilized to determine the sample size.
(1)
(1)
Table 1. Sample households distribution across districts and kebeles.
Where n is the sample size; Z (1.96) is the standard cumulative distribution at 95% confidence level; e is the level of precision; p (which is =0.5) is the estimated proportion of an attribute in the population, q = 1-p; and N is the size of the total wheat producer’s households from which the sample is drawn. The necessary sample size is therefore 384 according to the previously mentioned formula. Nonetheless, data were gathered from 422 households, taking into account a 10% non-response rate.
2. 4. Method of data analysis
To address the objectives of the study and analyze the data, both descriptive and econometric methods of data analysis were employed. Descriptive statistics, such as mean, percentage, standard deviation, chi-square, t-test, and F-test, were utilized to describe the data sets gathered from selected sample farmers. Similarly, binary logit and ordered logit models were used to determine the main factors that influence of food and nutrition security, respectively.
2.4.1. Measurement and determinants of food security
To measure the status of food security at the household level, this study employed a household calorie acquisition or food energy intake approach. Accordingly, 7 days’ household food consumption level data were collected and converted into kilocalories following nationally recommended conversion by EHNRI (Ethiopian Health and Nutrition Research Institute) (Citation2000). Then, the household’s daily calorie intake per adult equivalent was calculated by dividing the households’ daily calorie intake by the family size after adjusting for adult equivalent using the conversion factor for age and sex categories (Smith & Subandoro, Citation2007). Therefore, the Ethiopian government’s benchmark of 2550 kcal per day per adult was used to categorize each household’s food security status (FAO & WFP, Citation2019; MoFED, Citation2012). Consequently, y = 1 is assigned to households where daily caloric intake is greater than 2550, and y = 0 to all other households. In a similar vein, a binary logit model was used in this study to examine the key factors that affected the sample household’s food security status. Therefore, following Aldrich and Nelson (Citation1984) and Gujarati (Citation1995), the functional form of the logistic regression model is specified as follows
(2)
(2)
Where is the base of natural logarithms,
is the
explanatory variable,
is the probability that a household is food secure given
,
and
are regression parameters to be estimated. The ratio of the probability that a household was food secure to the probability that it was food insecure was given by:
(3)
(3)
Where represent a function of an explanatory variable
,
is the probability of the household being food secure and
is the probability of the household being food insecure. It also expressed as:
(4)
(4)
where
is a constant term
are slopes of the equation in the model,
is the log of the odds ratio, which is not only linear in
but also linear in the parameters,
is a vector of relevant household characteristics and
is a disturbance term.
2.4.2. Measurement and determinants of nutrition security
The nutrition security level was ascertained using the household dietary diversity score (HDDS). It is measured by summing the number of foods or food groups consumed over a reference period, usually a 24-hour. Therefore, to determine the food intake quality of the farm households, a total of twelve (12) food groups that were included in the household dietary diversity scores (HDDS (Household Dietary Diversity Score), Citation2006) and recommended by FAO (Food and Agricultural Organization) (Citation2010) were employed. Household dietary diversity score (HDDS) requires not only making food available and accessible but should be nutritionally well balanced within the body system (HDDS (Household Dietary Diversity Score), Citation2006). Hence, household dietary diversity scores (HDDS) ranged between 0-12 (FAO (Food & Agricultural Organization), Citation2007; Wineman, Citation2014). Thus, it can be classified as high dietary diversity if the score is >6, medium dietary diversity if the score is greater than three but ≤6, and low dietary diversity if the score is ≤3. The determinant of nutrition security status among the households was analyzed using the Ordered Logit model. Accordingly, the nutrition security level of the household was ordered as (1) lowest level of nutrition security, if the household falls in the range of lowest dietary diversity score; (2) medium level of nutrition security, if the household falls in the range of medium dietary diversity; and (3) higher level of nutrition security, if the household falls in the range of highest dietary diversity score. Thus, following Greene (Citation2003), the reduced form of the Ordered logit model is given as follows
(5)
(5)
Where is unobserved and Y is the observed level of nutrition security and involves ordered outcome, Y = 1 was given to households having the lowest level of nutrition security; Y = 2 was given to households having a medium level of nutrition security; and Y = 3 was given to households that have a high level of nutrition security.
is the level of nutrition security and the
are the independent variables determining the level of nutrition status.
are parameters estimated and
is the disturbance term. Based on the cumulative normal function Φ (β’ x), the likelihoods can be represented as follows
The enormous literature on measurement and determinants of food and nutrition security (Adugna et al., 2016; Kassie et al., Citation2018; Kassie and Workie (Citation2020; Tekle and Birhanu, Citation2015; Tsegaye, Citation2018); Sime, Citation2020; Tewabe & Belachew, Citation2020; Debeli et al., Citation2021; Melese et al., Citation2021; Mohammed et al., Citation2021; Muleta & Getahun, Citation2021; Derbie et al., Citation2022; Fikire and Zegeye (Citation2022); Getaneh et al., Citation2022; Wakwoya et al., Citation2022; Yuya et al., Citation2022; Bahiru et al., Citation2023; Feyisa et al., Citation2023)) was carefully reviewed. Potential factors for food and nutrition security were chosen based on their logical relationship to food and nutrition security and their applicability to the study area ().
Table 2. The study’s variable definitions, measurements and hypotheses.
3. Result and discussions
This section presents the findings from the econometrics and descriptive statistics models that were applied to meet the study’s objectives.
3.1. Descriptive statistical results
The summary statistics were described using both continuous and dummy variables. Hence, the following consecutive tables show the average variations in socioeconomic factors among sample households’ food and nutrition security.
3.1.1. Summary statistics of independent variables for the status of food security
below showed that among the households in the two groups, there were statistically significant mean differences in access to an improved wheat variety and early warning information. Hence, households that had access to improved wheat variety, and early warning information, had a better status for food security compared to their contemporaries. However, the outcome of the sex of the household head, training, access to irrigation, and vegetation coverage showed an insignificant value. Hence, for those variables, there were no statistically significant mean differences among the food-secure and insecure households (). The results also showed that there is a statistically significant mean difference between the food secure and insecure groups in terms of farming experience, family size, and farm size, number of livestock held, frequency of extension contact, chemical fertilizers, and distance to the closest market. Hence, the status of food security increases with decreasing family size, increasing number of contacts with extension agents, increasing farming experience, increasing farm size, increasing number of livestock holdings, increasing application of chemical fertilizers at an optimal rate, and decreasing distance from home to the nearest market.
Table 3. Summary statistics of explanatory variables used in the study (N = 422).
3.1.2. Summary statistics of independent variables for nutritional status
The result of test statistics revealed that there were statistically significant mean differences among household heads that have participated in the safety net program, access to early warning information, access to clean water, access to market information, and soil fertility status of wheat land between lower, medium and higher levels of nutritional status (). Hence, compared to other households, those that had taken part in the safety net program and had access to early warning information, clean water, market information and fertile farmland had better nutritional status. Similarly, among continuous explanatory variables, the mean difference between levels of nutrition is statistically significant for total annual income, farm size, distance to the closest market, and health centers. Hence, the higher the total income and the larger the farm sizes, the higher the level of nutritional status of sample households. However, the lower the distance traveled from the home to the closest market and health centers, the higher the level of nutritional status.
Table 4. Summary statistics of independent variables used in the nutritional status (N = 422).
3.2. Food and nutrition security status of the sample households
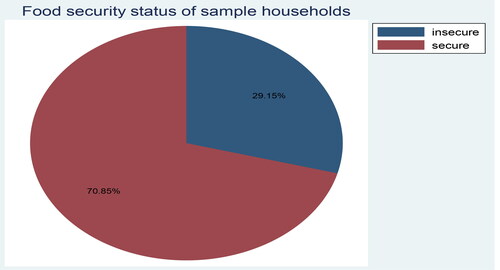
The household food security was determined using the household calorie acquisition method. Accordingly, the conventional conversion factor was used to convert the household’s food consumption during a seven-day period into calories. After dividing the total calories by the number of Adult Equivalents (AE) in the household, the results were divided by seven days to determine the average number of calories consumed per AE per day in a given family. Finally, the households were divided into food-secure and insecure categories based on the results, taking 2550 kcal as cut-off points that have been set by the Ethiopian Government (FAO & WFP, Citation2019) as the minimum daily subsistence requirement. Hence, based on this, the result of the study revealed that 70.85% of the total sample household was food secure while the remaining 29.15% was not ().
Figure 2. The study area’s households’ level of food security.
Source: Own computation based on survey data, 2022.
In contrast, a household dietary diversity score was used to determine the nutritional levels of the households. Thus, data on the variety of diets within households was gathered over the 24-hour recall period. The household dietary diversity score was then calculated by adding up the types of foods that the entire household ate. However, food eaten outside the home of the household was excluded. Thus, the result pointed out that the sample households had low, medium, and high nutritional levels, respectively, making up 26.07, 52.61, and 21.33% ().
Table 5. Household level of nutritional status.
3.3. Result of the econometrics model
The outcome of the factors that affect a household’s food and nutrition security are shown in this section. In order to determine the factors influencing household food and nutrition security, logistic regression and ordered logit models were used. The results are presented below.
3.3.1. Determinants of household-level food security status
Before model estimation, various tests were made to know whether or not the model surpasses various assumptions of logistic regression. Hence, multicollinearity tests among all the independent variables were conducted using the Variance Inflation Factor (VIF). The values of VIF for all variables entered into the model were very low and below 10 (Appendix), which indicates the absence of severe multicollinearity problems among the explanatory variables. Similarly, the result of the Breusch-Pagan test revealed that there was no problem with heteroskedasticity (P-value = 0.060) in the model. Ramsey RESET test, which was used to detect the presence of omitted variables, showed that there was no problem with omitted variables (P-value = 0.2304) in the model.
As previously mentioned, the model’s dependent variable is a binary that takes a value of 1 when the household is food secure and 0 in the other case. Therefore, the study area’s major factors that affect farm households’ food security status were determined using a binary logistic regression model. The model result pointed out that among 16 explanatory variables used in the model, seven of them namely; family size, frequency of extension contact, access to chemical fertilizers, access to irrigation, total livestock holdings, distance to the nearest market, and vegetation coverage, have a significant influence on food security status. The discussions about each significant variable are presented as follows
Family size: The findings showed that, at a 1% level of probability, family size negatively determines the status of food security at the household level. The negative sign implies that the probability of food security decreases with an increase in family size. The odds ratio of 0.173 for family size shows that, when all other factors are kept constant, an increase in the number of family members was associated with a 0.173 drop in the likelihood of food security. A farmer having more families could find it challenging to feed them. Therefore, compared to households with small family sizes, those with big family sizes experience financial disparities and food insecurity. This result is consistent with the findings of (Awoke et al., Citation2022; Feyisa et al., Citation2023; Biyena et al., 2021; Sani & Kemaw, Citation2019;Dessalegn, Citation2018; Yehuala et al., Citation2018). However, it contradicts the finding of Faustine (Citation2016), who comes to the conclusion that larger families provide more labor to production and are positively correlated with the household’s level of food security.
Total livestock holding: The results also showed that livestock ownership positively and significantly influences the level of household food security at a 1% level of likelihood. When all other factors are kept constant, the odds ratio of 1.525 indicates that the likelihood of being food secure increases by 1.525 for every unit of livestock owned in TLU. It means that livestock helps farm households provide food and cash for their families because farming requires financial investment. Additionally, when faced with food insecurity, farm households may resort to selling their livestock as a coping mechanism. Furthermore, raising livestock can be utilized to augment crop production to boost yield since they provide draft power and manure, which can help to preserve soil fertility. This result is consistent with the findings of Yehuala et al. (Citation2018), Moges and Melkamu (Citation2020), Mohammed et al. (Citation2021), Yuya et al. (Citation2022), Sintayehu and Abere (Citation2022) and Feyisa et al. (Citation2023). However, it contradicts the finding of Awoke et al. (Citation2022), who discovered that having more animals under bad management does not guarantee food security and is, therefore, negatively correlated with a household’s food security status.
Frequency of extension contact: At a 10% likelihood level, it determines the food security status of households positively and significantly. The odds ratio of 1.353 for the frequency of extension contact indicates that, when all other factors are held constant, the likelihood of being food secures increases by 1.353 with each increase in frequency of contact with the extension agent. Hence, households with a higher number of contact with extension agents are more likely to be food secure compared to their counterparts. This is due to the important role extension agents play in raising productivity, production, and hence, the status of food security. This result is conquered with the findings of Mustapha et al. (Citation2018), Haileyesus (Citation2019), Muleta and Getahun (Citation2021), and Feyisa et al. (Citation2023).
Chemical fertilizers: The results also showed that the amount of chemical fertilizer had a positive and statistically significant effect on the food security status of farm households at a 5% probability level. As to the interpretation of the odds ratio, the odds ratio of 6.033 for chemical fertilizer shows that as the amount of chemical fertilizers increases by one kg, the probability of being food secure increases by 6.033 when all other variables are kept constant. This is because using an optimum quantity of chemical fertilizers can boost agricultural productivity and hence, realize food security at the household level. This finding is in line with previous findings, which stated that there is a positive association between the amount of fertilizer applied in farming and the food security status (Dube et al.,Citation2018; Leza & Kuma, 2015; Stewart & Roberts, Citation2012). However, it contradicts the finding of Feyisa (Citation2018).
Access to irrigation: At a 10% probability level, it has a positive and significant effect on the food security status of households. When all other factors are held constant, a household that uses irrigation has a 2.516 increase in the likelihood of being food secure, according to the odds ratio of 2.516 for the variable. Therefore, compared to households without irrigation, those that use irrigation have a higher likelihood of food security. The rationale behind this is that during the dry season, households can boost their output by effectively utilizing the agricultural inputs and other resources at their disposal through irrigation. This result is also similar to the findings of Tafesse et al. (Citation2015), Agena (Citation2017), Ngema et al. (Citation2018), Mesele et al. (Citation2018), Sani and Kemaw (Citation2019), Gadisa(2021), and Zhang et al. (Citation2023).
Distance to the nearest market: It is also pointed out that distance from the nearest market center is negatively related to the status of household food security at a 1% level of probability. The negative sign suggests that for every kilometer that a farmer travels to get to the closest market centers, the likelihood of food security drops. When all other factors are kept constant, the odds ratio of 0.713 indicates that the likelihood of being food secure was reduced by 0.713 for every kilometer the farmer traveled to reach the closest market centers. This might be due to the fact that farm households face difficulty in obtaining market information and transporting their crops and livestock produce. Similarly, in periods of unpredictable risk and shocks, the heads of the household may not have access to formal support if their residence is far from the market centers. This finding is also consistent with that of Dagne (Citation2016).
Vegetation coverage: As expected, having land covered with vegetation determines household food security positively and significantly at a 1% probability level. When all other factors are kept constant, the odds ratio for vegetation coverage, which is 12.827, indicates that having vegetation on household property raises the probability of being food secure by 12.827. Hence, unless conserving the environment, the emphasis on production alone is not a sufficient condition to guarantee current and future food security. Similarly, building synergy and minimizing trade-offs between biodiversity conservation and sustainable agriculture can enhance food and nutrition security. This result is consistent with the findings of Yuya et al. (Citation2023) ().
Table 6. Determinants of household level food security status.
3.3.2. Determinants of household-level nutritional status
In order to assess the household-level determinants of nutritional status in the study area, the ordered logit model was utilized. The model result revealed that among 16 explanatory variables expected to determine the nutritional status of the household, eight of them namely: the level of education of the household head, productive safety net program, total income, farm size, distance to the nearest market, market information, fertility status and distance to health center significantly influenced the nutritional status of the household. The discussions about each significant variable are presented as follows:
Level of education: The likelihood of households being at lower, medium, and higher nutritional status is positively and significantly correlated with the level of education at the 1%, 10%, and 1% probability levels, respectively. The marginal effects of –0.0234 for being in the lower level of nutritional status show that, when all other factors are held constant, the risk of being in lower nutritional status drops by 2.34% for each year of schooling gained by the household head. However, the marginal effects of 0.0048 and 0.0185 for being in a medium and high nutritional status showed that as the level of education of the household head’s rises by one year of schooling, the probability of being in medium and high nutritional levels increases by 0.48 and 1.85%, respectively. The capacity to interpret nutritional information, which has a strong positive correlation with household dietary diversity, increases because families with formal education are more likely to recognize the value of crop diversification and consuming a varied diet. Similar results from other studies also showed that because educated household heads are more aware of the health benefits of a diverse diet, they have greater dietary diversity scores than uneducated ones (Melaku et al., Citation2019). This finding is in line with the results of Shewry and Hey (Citation2015), Magaña-Lemus et al. (Citation2016), Derso et al. (Citation2021), and Yuya et al. (Citation2022).
Productive safety net program (PSNP): Productive Safety Net Programme (PSNP) refers to a large-scale social protection intervention aimed at improving food and nutrition security and stabilizing asset levels. At a 5% and 10% probability level, respectively, it determines the probability of having a lower and higher level of nutritional status positively and significantly. The marginal effects of -0.1098 and 0.1131 showed that, as households participated in the PSNP program, the probability of having a low and high nutritional status decreased and increased by 10.98 and 11.31%, respectively, while other factors were kept constant. Hence, PSNP improved household level (calorie) availability and food security as well as dietary diversity at the household level. This result is consistent with the findings of Legesse Debela et al. (Citation2014). However, it contradicts the finding of Bahru et al. (Citation2020), who found that child anthropometry, child dietary diversity, and household food insecurity have not improved with PSNP.
Total income: Total annual income and the likelihood of household-level nutritional status are positively and significantly associated at a 10% probability level, demonstrating that household-level nutritional status improves as household annual income rises. The marginal effects of -0.0001 of total annual income for being in the lower level of nutritional status pointed out that when the household head’s total income increased by one birr, the likelihood of having a low nutritional status will be decreased by 0.01%, holding other variables constant. However, the marginal effects of 0.0001 of total annual income for being in the higher level of nutritional status pointed out that when the household head’s total income increased by one birr, the likelihood of being on a high level of nutritional status will be increased by 0.01%, holding other variables constant. This demonstrated that households with higher incomes could purchase the products and maintain a variety of diets. This result is consistent with the findings of Tsegaye et al. (Citation2020).
Farm size: At a 5% probability level, there is a positive and significant relationship between farm size and the probability of nutritional status at a household-level. The farm size marginal effects of -0.0392 and 0.0311 for being in a lower and higher level of nutrition, showed that holding other factors kept constant, the likelihood of having a low and high nutritional levels reduces and increases by 3.92 and 3.11%, respectively, as the farm size increases by one hectare. Because land is a major factor in determining food diversity, households with bigger cultivated land holdings had more diverse diets. This is because land is essential for growing foods with a variety of diets, as agriculture accounted for the bulk of household incomes in the study area. This result is consistent with the findings of Ochieng et al. (Citation2017) and Derso et al. (Citation2021).
Distance to the nearest market: At the 1% probability level, it determines the likelihood of the household having a lower nutritional status in a positive and significant way. However, at 10% and 1% probability levels, it was negatively related with the likelihood of having a medium and high nutritional status, respectively. The marginal effects of 0.0615 imply that keeping all other factors held constant, the probability of being in the lower level of nutritional status increases by 6.15% as the proximity to the nearest market increases by one km. However, the marginal effects of –0.0127, and –0.0487 for medium and higher levels of nutrition pointed out that keeping all other factors held constant, the probability of being in the medium, and high nutritional status decreases by 1.27, and 4.87% as the distance to the nearest market center increases by one km. It is taken into consideration due to its connection to the cost of transportation for obtaining market input and output. This finding is consistent with the results of Stifel and Minten (Citation2017), Derso et al. (Citation2021), Egbetokun et al. (2020), and Yuya et al. (Citation2022).
Access to market information: The likelihood of nutritional status at the household level is determined by access to market information positively and significantly at a 5% probability level. The market information marginal effects of –0.1907 for lower nutrition levels pointed out that keeping all other factors held constant, the probability of being in the lower nutritional status decreases by 19.07% as the households accessed the market information. However, the marginal effects of 0.1512 for higher levels of nutrition pointed out that keeping all other factors kept constant, the probability of being in the high nutritional status increases by 15.12%. The inference is that market information provides better access to nutrient-dense foods by reducing the time and expense of information seeking since it acts as a stand-in for data on agricultural and food crop prices. This finding is also in line with the findings of Hirvonen et al. (Citation2016), Stifel and Minten (Citation2017), Egbetokun et al. (2020), and Yuya et al. (Citation2022).
Soil fertility status: The status of soil fertility and the nutritional status are positively and significantly related at a 1%, 10%, and 1% level of probability, respectively. The soil fertility status marginal effects of -0.1933 for lower nutrition levels pointed out that keeping all other factors held constant, the likelihood of being in the lower nutritional levels decreases by 19.33% as the household farmland is fertile. However, the marginal effects of 0.0401, and 0.1532 for medium and higher levels of nutrition pointed out that keeping all other factors held constant, the probability of being in the medium and higher nutritional status increases by 4.01 and 15.32%, respectively. One probable explanation is that farmers who own fertile land are more likely to produce high-nutrient crops and earn more money from their farms, both of which raise the possibility of having a high nutritional status. This result is in line with the findings of Ahmed et al. (Citation2015) and Yuya et al. (Citation2022).
Distance to health center: This variable was also found to be positively and significantly related to the probability of being in the lower and medium level of nutrition of the household at a 1% and 10% probability level, respectively. However, it negatively and significantly determines the likelihood of being in a higher level of nutritional status at a 1% probability level. The marginal effects of 0.0779 and 0.0162 for lower and medium nutritional status pointed out that keeping all other factors held constant, the probability of being in the lower and medium level nutritional status increases by 7.79 and 1.62%, respectively, as the distance to the nearest health effects of -0.0618 for higher levels of nutrition pointed out that keeping all other factors held constant, the probability of being in the high nutritional status decreases by 6.18% as the distance to the nearest health center increases by one km. This finding is consistent with the results of Stifel and Minten (Citation2017) and Derso et al. (Citation2021) ().
Table 7. Determinants of household level nutritional status.
In general, from the result of descriptive statistics, we can deduce that around 74% of households have an average or higher level of nutrition, whereas nearly 71% are food secure. It is agreed that while food security is a prerequisite for nutrition security, it is not a sufficient condition. Therefore, with better nutrition-supportive decisions and behavior, nutrition security can be enhanced even in the presence of food insecurity (Klennert, Citation2005). Thus, food security is a crucial element of nutrition security. The findings of Hwalla et al. (Citation2016), Yuya et al. (Citation2022), and Feyisa et al. (Citation2023) are consistent with this outcome. Moreover, there were significant mean differences in access to early warning information, farm size, and distance to the nearest market for both food and nutrition security. Similarly, having access to early warning information enables farm households to ensure food and nutrition security. Therefore, giving households access to reliable information on a major disaster helps them to cope with shocks and get ready for the shock event. Besides, distance to the nearest market determines food and nutrition security. This suggests that the level of food and nutrition security increases with the distance traveled from the closest market. Hence, in order to achieve food and nutrition security, households must guarantee infrastructure access and establish a market nearby where they can easily sell their produce and purchase the necessary inputs.
However, among the major determinants incorporated in the models, distance to the nearest market centers is the only determinant that affects both food security and nutritional levels at the household level. This implies that what determines food security status might not determine the nutritional status. Hence, there is a big difference but close linkages between food and nutrition security. This result is also consistent with the findings of Yuya et al. (Citation2022) and Feyisa et al. (Citation2023).
4. Conclusion and recommendations
In the selected districts of the Arsi Zone, this study examined the factors that influence food and nutrition security at the household level. Primary data were gathered from 422 sample households using a semi-structured questionnaire. The household calorie acquisition and HDDS measurement tools were used to measure the status of food and nutritional security, respectively. The result of the study pointed out that 70.85% of the total sample household was food secure while the remaining 29.15% was food insecure. Similarly, the result of HDDS also found that 26.07, 52.61, and 21.33% of the total sample households were found in low, medium, and high nutritional levels, respectively. However, given the ever-increasing population together with the 2030 SDG of zero hunger and malnutrition, there is a need to do more to ensure food and nutrition security in the study area.
The result of the binary logit model revealed that the households that owned large numbers of livestock, those who had frequent contact with development agents, those who used an optimum level of chemical fertilizers on their plots, those who used irrigation and covered their land with vegetation were more likely to be food secure. On the other hand, the likelihood of food security decreased for households with larger family sizes and those located further from the closest market center. The result of the ordered logit model also revealed that households headed by a more educated head, those who participate in safety net programs, own larger land, who have greater total income, have access to market information, and those who have fertile farmland were more likely to be on a higher level of nutritional status. However, households with larger family sizes and those whose homes were farther away from the nearest market and health center were less likely to be on a higher level of nutrition.
The study’s findings suggest that increasing the amount of farmers’ education through various training programs, family planning, improving and distributing high-quality market information to smallholder farmers, continuously enhancing the soil fertility status of farmland, and using irrigation technologies are all essential for long-term household food and nutrition security. Increased contact with extension agents and the application of inorganic fertilizers at the recommended rate would both significantly improve the food and nutritional security of households. Finally, boosting the productivity of land and livestock should be taken into consideration to improve household food and nutrition security, as increasing the size of land holdings and livestock may not be realistic given the rapidly growing population.
However, given the fact that food security is seasonal-sensitive, the study only employed cross-sectional data, which obscures changes in food and nutrition security over time. Therefore, rather than depending on data obtained at a single point in time, future research should use panel data sets to find out more about the factors that influence the households’ food and nutrition security.
Authors’ contributions
Mustefa Bati: prepared the proposal, collected the data, analyzed, interpreted the data, and wrote the paper. Jema Haji, Kedir Jemal, and Fresenbat Zeleke provide valuable comments on the produced report.
About the Authors.docx
Download MS Word (108.3 KB)Acknowledgments
The authors of this study wish to express their deepest gratitude to the Ministry of Education for its financial support in undertaking this study. The authors would also like to thank Mattu and Haramaya University for their facilitation. Special thanks also go to Professor Jema Haji, Dr. Kedir Jemal, and Dr. Fresenbat Zeleke for their valuable comments, sampled respondents, enumerators involved in data collection, the agricultural office of each district and Arsi Zone office of agriculture and rural development would have special thanks for their direct and indirect contribution for the successful completion of this work. Finally, we would like to acknowledge the editor and reviewers of this journal.
Disclosure statement
The authors declare no conflict of interest.
Additional information
Funding
Notes on contributors

Mustefa Bati Geda
Mustefa Bati Geda is a lecturer and Assistant Professor of Agricultural Economics at the Department of Agricultural Economics, Mattu University, Ethiopia. He is currently a PhD candidate in the Discipline of Agricultural Economics at Haramaya University.
Jema Haji Mohammed
Jema Haji Mohammed is a professor of agricultural economics and lecturer at Haramaya University, Ethiopia.
Kedir Jemal Ibrahim
Kedir Jemal is an assistant professor of Agricultural Economics and is the head school of Agricultural Economics and Agribusiness, at Haramaya University, Ethiopia.
Fresenbet Zeleke Abshiro
Fresenbat Zeleke is also an assistant professor of Agricultural Economics in the School of Agricultural Economics and Agribusiness at Haramaya University, Ethiopia.
References
- ADB (Africa Development Bank). (2020). Africa Food Security Brief: Special Focus on Climate Change. Africa Food Security Statistics Department. Abidjan, Ivory Coast.
- Agena, M. A. (2017). Impact of small-scale irrigation on farmers’ cropping system choice, productivity and food security in Meskan District of Southern Ethiopia [Doctoral dissertation]. Haramaya University.
- Ahmed, F. F., Eugene, C. E., & Abah, P. O. (2015). Analysis of food security among farming households in Borno State. Nigeria. Journal of Agricultural Economics, Environment and Social Sciences, 1(1), 1–16.
- Aldrich, J. H., & Nelson, F. D. (1984). Linear probability, logit, and probit models (No. 45). Sage.
- ATA (Agricultural Transformation Agency). (2020). Transforming Agriculture in Ethiopia. Annual report, 2019/2020. Addis Ababa Ethiopia.
- ATA (Agricultural Transformation Agency). (2022). Transforming Agriculture in Ethiopia. Annual report, 2021/2022. Addis Ababa Ethiopia.
- Atinafu, A., Lejebo, M., & Alemu, A. (2022). Adoption of improved wheat production technology in Gorche district, Ethiopia. Agriculture & Food Security, 11(1), 3. https://doi.org/10.1186/s40066-021-00343-4
- Adugna Tafesse, Gazahgne Ayele, Mengistu Ketema and Endrias Geta. (2016). Food security and vulnerability to climate change in Eastern Ethiopia. Economics, 5(6): 81–88.
- Awoke, W., Eniyew, K., Agitew, G., & Meseret, B. (2022). Determinants of food security status of household in Central and North Gondar Zone, Ethiopia. Cogent Social Sciences, 8(1), 2040138. https://doi.org/10.1080/23311886.2022.2040138
- AZOANR (Arsi Zone Office of Agriculture and Rural Development). (2022). Arsi Zone office agriculture and rural development, annual report. Asella.
- Bahiru, A., Senapathy, M., & Bojago, E. (2023). Status of household food security, its determinants, and coping strategies in the Humbo district, Southern Ethiopia. Journal of Agriculture and Food Research, 11, 100461. https://doi.org/10.1016/j.jafr.2022.100461
- Bahru, B. A., Jebena, M. G., Birner, R., & Zeller, M. (2020). Impact of Ethiopia’s productive safety net program on household food security and child nutrition: a marginal structural modeling approach. SSM - Population Health, 12, 100660. https://doi.org/10.1016/j.ssmph.2020.100660
- Belachew D. (2018). Transitory coping strategies of food-insecure smallholder farmer households: the case of Ilu Gelan District, West Shoa Zone, Oromia Reginal State, Ethiopia. Agriculture & Food Security, 7, 1–11. https://doi.org/10.1186/s40066-018-0204-2
- Biyena, D. C., Wondu, H., & Mewded, B. (2021). Factors affecting household food security in Gumay Woreda of Jimma Zone of Oromia, Ethiopia. International Journal of Economic Behavior and Organization, 9(3), 85. https://doi.org/10.11648/j.ijebo.20210903.16
- CSA (Central Statistical Agency). (2007). The 2007 population and housing census of Ethiopia. Addis Ababa.
- Dagne, G. (2016). Determinants of food security in farm households in drought-prone areas of Oromia region: in case of Dodota District. Journal of Economics and Sustainable Development, 7(17), 1700–2222.
- Debeli C., Biyena, Wondu, H., & Mewded, B. (2021). Factors affecting household food security in Gumay Woreda of Jimma Zone of Oromia, Ethiopia. International Journal of Economic Behavior and Organization, 9(3), 85. DOI: 10.11648/j.ijebo.20210903.16
- Derbie, L., Oumer, A., Ayele, K., & Berhane, A. (2022). Determinants of nutritional status among old age population in eastern Ethiopia: A general linear model approach. Journal of Nutritional Science, 11, e70. https://doi.org/10.1017/jns.2022.62
- Derso, D., Tolossa, D., & Seyoum, A. (2021). Household dietary diversity in rural households of Oromia Regional state, Ethiopia: A cross-sectional study. Journal of Development and Agricultural Economics, 13(4), 304–313.
- Dessalegn, B. (2018). Transitory coping strategies of food-insecure smallholder farmer households: the case of Ilu Gelan District, West Shoa Zone, Oromia Reginal State, Ethiopia. Agriculture & Food Security, 7(1), 11. https://doi.org/10.1186/s40066-018-0204-2
- Dube, A. K., Haji, J., & Zemedu, L. (2018). Determinants of food insecurity and coping strategies of rural households: The case of Shalla District, West Arsi Zone, Oromia Region, Ethiopia. Journal of Development and Agricultural Economics, 10(6), 200–212.
- Egbetokun, O. A., & Fraser, G. C. G, Rhodes University. (2020). Factors influencing food consumption diversity among farming households in selected states in southwestern Nigeria. African Journal of Food, Agriculture, Nutrition and Development, 20(05), 16325–16342. https://doi.org/10.18697/ajfand.93.19065
- EHNRI (Ethiopian Health and Nutrition Research Institute). (2000). Kilocalories of different food groups. Addis Ababa.
- ESS (Ethiopian Statistical Service). (2022). Report on area and production of major crops (private peasant holdings, Meher Season). Agricultural Sample Survey. Addis Ababa.
- FAO (Food and Agricultural Organization). (2007). Nutrition and Consumer Protection Division with support from the Food Security Information for Action Programme and the Food and Nutrition Technical Assistance (FANTA) Project.
- FAO (Food and Agricultural Organization). (2010). Food security: Concepts and Measurement. In: Food Security: The Science, Sociology, and Economics of Food Production and access to Food. http://www.Org./Docrep/005/Y467/E06.
- FAO (Food and Agriculture Organization). (2020). The state of food security and nutrition in the world. Rome. http://www.fao.org/state-of-food-security-nutrition/en/
- FAO (Food and Agriculture Organization). (2023). The state of food security and nutrition in the world. Rome. http://www.fao.org/state-of-food-security-nutrition/en/
- FAO and WFP. (2019). Monitoring food security in countries with conflict situations. A joint FAO/WFP update for the members of the United Nations Security Council. August 2019. Rome
- FAO, IFAD, UNICEF, WFP and WHO. (2023). The State of Food Security and Nutrition in the World 2023. Urbanization, agrifood systems transformation and healthy diets across therural–urban continuum. Rome, FAO https://doi.org/10.4060/cc3017e
- FAOSTAT (Food and Agriculture Organization statistics data). (2021). The state of food insecurity in the world. Strengthening the enabling environment for food security and nutrition. FAO.
- Faustine, E. M. (2016). Coping strategies and household resilience to food insecurity in Chamwino and Manyoni districts, Tanzania (Doctoral dissertation, Sokoine University of Agriculture).
- FEWSNET (Famine Early Warning Systems Network). (2021). Worsening Drought Threatens Horn of Africa as Conflict-driven Emergency Persists in Northern Ethiopia. East Africa Food Security Alert. December 29, 2021.
- Feyisa, B. W., Haji, J., & Mirzabaev, A. (2023). Determinants of food and nutrition security: Evidence from crop-livestock mixed farming households of central and eastern Ethiopia. Journal of Agriculture and Food Research, 12, 100556. https://doi.org/10.1016/j.jafr.2023.100556
- Feyisa, M. N. (2018). Determinants of food insecurity among rural households of South Western Ethiopia. Journal of Development and Agricultural Economics, 10(12), 404–412.
- Fikire, A. H., & Zegeye, M. B. (2022). Determinants of rural household food security status in North Shewa Zone, Amhara Region, Ethiopia. The Scientific World Journal, 2022, 1–8. https://doi.org/10.1155/2022/9561063
- Getaneh, Y., Alemu, A., Ganewo, Z., & Haile, A. (2022). Food security status and determinants in North-Eastern rift valley of Ethiopia. Journal of Agriculture and Food Research, 8, 100290. https://doi.org/10.1016/j.jafr.2022.100290
- Greene, W. H. (2003). Econometric Analysis. Pearson Education India.
- Gujarati, D. N. (1995). Basic Econometrics. 3rd ed. McGraw-Hill.
- Haileyesus, M. (2019). The contribution of irrigation to food security in Farta Woreda, South Gondar Zone, Amhara National Regional State, Ethiopia [Doctoral dissertation, MSc Thesis]. Addis Ababa University.
- HDDS (Household Dietary Diversity Score). (2006). Household Dietary Diversity Score for Measurement of Household Food Access: Indicator guide, version 2.
- Hirvonen, K., Taffesse, A. S., & Hassen, I. W. (2016). Seasonality and household diets in Ethiopia. Public Health Nutrition, 19(10), 1723–1730. https://doi.org/10.1017/S1368980015003237
- Hwalla, N., El Labban, S., & Bahn, R. A. (2016). Nutrition security is an integral component of food security. Frontiers in Life Science, 9(3), 167–172. https://doi.org/10.1080/21553769.2016.1209133
- Kassie, G. W., & Workie, D. L. (2020). Determinants of under-nutrition among children under five years of age in Ethiopia. BMC Public Health, 20(1), 399. https://doi.org/10.1186/s12889-020-08539-2
- Kassie, M., Marenya, P., Tessema, Y., Jaleta, M., Zeng, D., Erenstein, O., & Rahut, D. (2018). Measuring farm and market level economic impacts of improved maize production technologies in Ethiopia: Evidence from panel data. Journal of Agricultural Economics, 69(1), 76–95. https://doi.org/10.1111/1477-9552.12221
- Klennert, K. (2005). Achieving food and nutrition security: Actions to meet the global challenge.
- Kothari, C. R. (2004). Research methodology, methods and techniques. 2nd ed. New Age International Ltd., Publishers.
- Legesse Debela, B., Shively, G., & Holden, S. (2014). Does Ethiopia’s Productive Safety Net Program Improve Child Nutrition? (No. 01/14). Centre for Land Tenure Studies Working Paper.
- Leza, T., & Kuma, B. (2015). Determinants of rural farm household food security in Boloso Sore District of Wolaita Zone in Ethiopia. Asian Journal of Agricultural Extension, Economics & Sociology, 5(2), 57–68. https://doi.org/10.9734/AJAEES/2015/14833
- Magaña-Lemus, D., Ishdorj, A., Rosson, C. P., & Lara-Álvarez, J. (2016). Determinants of household food insecurity in Mexico. Agricultural and Food Economics, 4(1), 20. https://doi.org/10.1186/s40100-016-0054-9
- Melaku, Y. A., Renzaho, A., Gill, T. K., Taylor, A. W., Dal Grande, E., de Courten, B., … & Kinfu, Y. (2019). Burden and trend of diet-related non-communicable diseases in Australia and comparison with 34 OECD countries, 1990–2015: Findings from the Global Burden of Disease Study 2015. European journal of nutrition, 58, 1299–1313. https://doi.org/10.1155/2022/3569950
- Melese, M., Tilahun, M., & Alemu, M. (2021). Household food insecurity and coping strategies in Southern Ethiopia. Agriculture & Food Security, 10(1), 1–12. https://doi.org/10.1186/s40066-021-00296-8
- Mesele, K., Asefa, P., & Anuja, T. (2018). Determinants of household food security in southern Tigray, northern Ethiopia. International Journal of Academic Research and Development, 3(2), 1463–1471.
- MOFED (Ministry of Finance and Economic Development). (2012). Development and Poverty in Ethiopia. Addis Ababa.
- Moges, A., & Melkamu, M. (2020). Determinants of rural household food insecurity status and coping strategies in case of Konso Woreda, Segen area people’s zone of Southern Ethiopia. International Journal of Business and Economics Research, 9(4), 202–206. https://doi.org/10.11648/j.ijber.20200904.16
- Mohammed, A., Wassie, S. B., & Teferi, E. T. (2021). Determinants of smallholders’ food security status in Kalu district, Northern Ethiopia. Challenges, 12(2), 17. https://doi.org/10.3390/challe12020017
- Muleta, G., & Getahun, A. (2021). Food security status and its determinant factors in Central Ethiopia: Empirical Evidence from Walmara District. Food Science and Quality Management, 108, 22–28.
- Mustapha, M., Kamaruddin, R. B., & Dewi, S. (2018). Factors affecting rural farming households food security status in Kano, Nigeria. International Journal of Management Research and Reviews, 8(9), 1.
- Ngema, P. Z., Sibanda, M., & Musemwa, L. (2018). Household food security status and its determinants in Maphumulo local municipality, South Africa. Sustainability, 10(9), 3307. https://doi.org/10.3390/su10093307
- Ochieng, J., Afari-Sefa, V., Lukumay, P. J., & Dubois, T. (2017). Determinants of dietary diversity and the potential role of men in improving household nutrition in Tanzania. PloS One, 12(12), e0189022. https://doi.org/10.1371/journal.pone.0189022
- Peter, R. Shewry and Sandra J. Hey. (2015). The contribution of wheat to human diet and health. Food and Energy Security, 4 (3): 178–202.
- Sani, S., & Kemaw, B. (2019). Analysis of households food insecurity and its coping mechanisms in Western Ethiopia. Agricultural and Food Economics, 7(1), 1–20. https://doi.org/10.1186/s40100-019-0124-x
- Shewry, P. R., & Hey, S. J. (2015). The contribution of wheat to human diet and health. Food and Energy Security, 4(3), 178–202. https://doi.org/10.1002/fes3.64
- Shewry, P. R., & Hey, S. J. (2015). The contribution of wheat to human diet and health. Food and energy security, 4(3), 178–202. doi: 10.1002/fes3.64.
- Sime, E. B. (2020). Determinants of household food insecurity in rural Ethiopia: Multiple linear regression (classical and Bayesian approaches). International Journal of Theoretical and Applied Mathematics, 6(5), 64–75. https://doi.org/10.11648/j.ijtam.20200605.12
- Sintayehu,M. W., & Abera, W. K. (2022). Household level determinants of food insecurity in rural Ethiopia. Journal of Food Quality, 2022. 3569950. DOI: 10.1155/2022/3569950
- Smith, L. C., & Subandoro, A. (2007). Measuring food security using household expenditure surveys (Vol. 3). Intl Food Policy Res Inst.
- Stewart, W. M., & Roberts, T. L. (2012). Food security and the role of fertilizer in supporting it. Procedia Engineering, 46, 76–82. https://doi.org/10.1016/j.proeng.2012.09.448
- Stifel, D., & Minten, B. (2017). Market access, well-being, and nutrition: Evidence from Ethiopia. World Development, 90, 229–241. https://doi.org/10.1016/j.worlddev.2016.09.009
- Sudda, M. M., Kusiluka, L. J. M., & Kassim, N. (2017). Animal health management practices in zero grazing dairy units in Arusha city, Tanzania. African Journal of Food, Agriculture, Nutrition and Development, 17(4), 12904–12915
- Tafesse, A., Ayele, G., Ketema, M., & Geta, E. (2015). Food security and adaptation strategies to climate change in Eastern Ethiopia. Business, Management and Economics Research, 1(3), 33–43.
- Tafesse, A., Ayele, G., Ketema, M., & Geta, E. (2016). Food security and vulnerability to climate change in eastern Ethiopia. Economics, 5(6), 81–88. DOI: 10.11648/j.eco.20160506.11
- Tekle,L & Birhanu, K. (2015). Determinants of rural farm household food security in Boloso Sore District of Wolaita Zone in Ethiopia. Asian J Agric Ext Econ Sociol, 5(2), 57-68. DOI: 10.9734/AJAEES/2015/14833
- Tewabe, T., & Belachew, A. (2020). Determinants of nutritional status in school-aged children in Mecha, Northwest Ethiopia. Current Therapeutic Research, Clinical and Experimental, 93, 100598. https://doi.org/10.1016/j.curtheres.2020.100598
- Tsegaye, D., Tamiru, D., & Belachew, T. (2020). Factors associated with dietary practice and nutritional status of pregnant women in rural communities of Illu aba Bor zone, Southwest Ethiopia. Nutrition and Dietary Supplements, UME, 12, 103–112. https://doi.org/10.2147/NDS.S257610
- Tsegaye, M. (2018). Determinants of food security in the Oromiya Region of Ethiopia. In Economic Growth and Development in Ethiopia: 39–65.
- Victora, C. G., Adair, L., Fall, C., Hallal, P. C., Martorell, R., Richter, L., & Sachdev, H. S. (2008). Maternal and child undernutrition: consequences for adult health and human capital. The lancet, 371(9609), 340–357.
- Victora, C. G., Adair, L., Fall, C., Hallal, P. C., Martorell, R., Richter, L., & Sachdev, H. S. (2008). Maternal and child under nutrition: consequences for adult health and human capital. The Lancet (London, England), 371(9609), 340–357. https://doi.org/10.1016/S0140-6736(07)61692-4
- Wakwoya, E. B., Belachew, T., & Girma, T. (2022). Determinants of nutritional status among pregnant women in East Shoa zone, Central Ethiopia. Frontiers in Nutrition, 9, 958591. https://doi.org/10.3389/fnut.2022.958591
- WFP (World Food Program). (2020). “Global food security update: Tracking food security trends in vulnerable countries”. World Food Programme, Issue 10, February 2020.
- Wineman, A. (2014). Multidimensional Household Food Security Measurement in Rural Zambia. Selected Paper prepared for presentation at the Agricultural and Applied Economics Association’s, AAEA Annual Meeting, Minneapolis, MN, July 27–29.
- Yehuala, S., Melak, D., & Mekuria, W. (2018). The status of household food insecurity: The case of West Belesa, North Gondar, Amhara region, Ethiopia. International Journal of Scientific Research and Management, 6(6), 158–166.
- Yuya, B. A., Mohammed, J. H., & Aredo, M. K. (2022). Socio-economic determinants of household-level food and nutrition security among smallholder farmers of Eastern Oromia. Ethiopia. World, 6(2), 19–30.
- Yuya, A.B., Haji, J., Ketema, M., & Jemal, K. (2023). Impacts and adaptation extents of climate smart agricultural practices among smallholder farmers of Ethiopia: Implication to food and nutrition security. Cogent Economics & Finance, 11(1), 2210911. DOI: 10.1080/23322039.2023.2210911
- Zeleke, B. D., Geleto, A. K., Komicha, H. H., & Asefa, S. (2021). Determinants of adopting improved bread wheat varieties in Arsi Highland, Oromia Region, Ethiopia: A double-hurdle approach. Cogent Economics & Finance, 9(1), 1932040. https://doi.org/10.1080/23322039.2021.1932040
- Zhang, Y., Gong, N., & Zhu, H. (2023). Vegetation dynamics and food security against the background of ecological restoration in Hubei Province, China. International Journal of Environmental Research and Public Health, 20(2), 1225. https://doi.org/10.3390/ijerph20021225