
Abstract
Estimates suggest that a substantial volume of food intended for human consumption is lost or wasted globally, underlining the importance of reducing food waste to address environmental concerns. This study examines the generation and associated carbon footprint of 25 different food waste fractions from ten Brazilian street markets. The aim is to identify hotspots within food product categories, analyse the causes of food waste and investigate potential risk factors that hinder the reduction of food waste. This research seeks to provide support when deciding on prevention and valorisation measures, and waste management strategies to enhance the sustainability of the agrifood system. The study reveals that 4.98 kg and 20.15 kg of food per stall are wasted every week in street markets at Ribeirão Preto and São Paulo, respectively, resulting in an average carbon footprint of 6.74 kg and 35.20 kg CO2 eq. per stall. The three food product categories that have the largest carbon footprint are (1) unavoidable food waste, (2) leaves, flowers and stems, and (3) meat. The annual food waste generation in Ribeirão Preto and São Paulo street markets is estimated to be 0.50 and 2.22 kg per capita per year, respectively. This suggests that diverting organic food waste, particularly unavoidable waste, from landfills to other waste management methods holds significant potential for reducing the carbon footprint. Leaves, flowers and stems as well as meat should be prioritized for prevention measures.
1. Introduction
Food loss and waste is a pressing global problem with significant environmental, social, and economic ramifications. The most recent quantifications of food loss and waste (FLW) are presented in the Food Loss and Food Waste Index (FAO, Citation2019; UNEP, Citation2021), which indicates that 14% of food is lost prior to reaching retail, and 931 million tonnes of food, an equivalent of 17%, are wasted from the retail to the consumer level. This equates to an alarming loss of nearly one-third of the food along the supply chain (FAO, Citation2019; UNEP, Citation2021). As stated by the UNITED NATIONS (Citation2020), approximately 8% of global greenhouse gas emissions are due to FLW. Moreover, FLW presents social ramifications and raises ethical issues, particularly when an estimated 700 million people are experiencing hunger, and another 3 billion individuals cannot afford a healthy diet (FAO, Citation2019; Ilo et al., 2020).
In response to the food waste issue, various international initiatives have been established. One of the notable efforts is the European Union’s Farm to Fork strategy, launched in May 2020, which aims to enhance the sustainability and resilience of the EU’s food system with a central focus on preventing food loss and waste (European Commission, 2020). Additionally, the United Nations’ Sustainable Development Goals (SDGs) emphasize the importance of addressing this issue, setting a specific target to halve food loss and waste by 2030 (UNITED NATIONS, Citation2020).
Several strategies have been launched in Brazil. One example is the Intersectoral Strategy for the Reduction of Food Loss and Waste. This initiative targets nationwide food waste reduction, focusing on food system governance, public policies, research and innovation, education and awareness, and food donation (CAISAN, 2018). However, there is still a lack of awareness regarding the magnitude of FLW. According to a survey conducted by the Brazilian Retail Association, 28% of supermarket chains lack a department specifically dedicated to food waste prevention (Abras, Citation2021). Additionally, there is limited data for a national estimation of FLW in Brazil, particularly at the retail level (UNEP, Citation2021).
Brazilian street markets are renowned for their diverse range of food products, featuring an array of fresh produce, street food, and local specialties. A significant challenge arises in the form of food waste due to the lack of adequate storage facilities, inefficient distribution networks, and a widespread preference for aesthetically perfect products (Bouju & Igergård, Citation2019; de Moraes et al., Citation2022; Santos et al., Citation2020b). The implications of food waste in street markets extend beyond the significant loss of valuable resources. It poses threats to food security, public health, and the environment.
Quantifying waste is a crucial initial step in understanding the causes of waste generation and developing strategies for prevention or valorization. Data acquired through waste quantification serves multiple purposes, including measuring the volume and sources of food waste, discerning the causes of waste generation, and identifying hotspots in the supply chain. Moreover, it is necessary to quantify food waste, not just in terms of mass but also in relevant environmental indicators. The integration of food waste quantification with life cycle assessment (LCA) is crucial in formulating strategies to curtail food waste and mitigate its carbon footprint. LCA is a standardized method to assess the environmental impacts associated with a product or service across its life cycle—from the cradle to the grave (ISO, Citation2006a; ISO, Citation2006b). Food waste quantification provides data on the volume and composition of generated waste, and LCA evaluates the carbon footprint at each stage of the food’s lifecycle, including production, processing, distribution, consumption, and disposal. Combining these two methodologies identifies products that have a large carbon footprint, hence allowing for relevant interventions to be prioritized.
This study analyses the quantities and carbon footprint of food waste generated in ten street markets in two Brazilian cities: São Paulo (SP) and Ribeirão Preto (RP). São Paulo, the largest city in Brazil, Latin America, and the southern hemisphere, contrasts with Ribeirão Preto, a mid-sized Brazilian municipality. Due to the different demographic characteristics of these cities, there might be a variation in the quantities and types of food products that are wasted. Therefore, a comparative analysis of food waste generation and its carbon footprint in these two cities is presented. If disparities between waste generation and carbon footprint are found, it could influence which food products are prioritized in prevention and valorisation strategies.
The primary objective of this research is to aid in the prevention and management of food waste in Brazilian street markets, an area that has not been widely studied using waste quantification and LCA. This study combines quantification of waste and LCA, and more specifically carbon footprint indicators, to identify hotspots, analyse potential risk factors and causes of waste generation. Our study focused on carbon footprint due to its global relevance and urgency, given the significant role the food system plays in greenhouse gas emissions.
2. Literature review
Several studies have reported substantial FLW within the Brazilian supply chain. For instance, a study quantifying FLW at a regional supply centre found that, 9.5 tonnes of fruit and vegetables were discarded every week due to excessive purchasing, unrefrigerated storage, and careless handling by customers and sellers (Santos et al., Citation2020b). Fehr and Romão (Citation2001) found that 16.6% of fruits and vegetables were wasted from the farm gate up to the retail stage in a medium-sized city. More recently, Brancoli et al. (Citation2022) estimated that street markets in São Paulo, waste 20.15 kg of food per stall, with the composition primarily consisting of unavoidable food waste.
Waste quantification is the first step for reducing food waste (Eriksson et al., Citation2017). The FUSIONS project has significantly contributed to this field by proposing a standard method for food loss and waste (FLW) quantification (Tostivint et al., Citation2016). Moreover, the Commission Delegated Decision 1957/2019 establishes minimum quality standards for assessing the effectiveness of food waste prevention measures and aims to create a standardized methodology (European Union, 2019). Recently, the establishment of UNI/TS 11820:2022 provides a common methodology for measuring and evaluating circularity, including food waste (RINA, 2022). Although this standard does not specifically target food waste, it can be applied to measure food waste within an organization’s value chain. As some researchers contend, a universally accepted standard methodology for FLW quantification is, perhaps, yet to be established (Hoehn et al., Citation2023; Withanage et al., Citation2021).
Scientific interest in quantifying FLW has increased in recent years, but the majority of studies have been conducted in developed countries, particularly in Europe and the United States. For example, Rousta and Bolton (Citation2019) studied improperly sorted waste quantities in Swedish households, identifying interventions to improve citizens’ sorting. In a Finnish context, Silvennoinen et al. (Citation2022) found fruits, vegetables, homemade food, bread, meat, and fish to be the most wasted food groups in avoidable household waste, with inedible food waste contributing the most. On the retail side, Eriksson et al. (Citation2012) found a positive correlation between unrecorded in-store waste and total waste in Swedish retail stores, suggesting that recording waste could be effective in waste reduction at the retail level. In the United States, Wilkie et al. (2015) focused on reducing plate waste in primary schools over a 5–8 days period using tray waste measurements. In a study conducted by Brancoli et al. (Citation2022), food waste from a Swedish supermarket was quantified, revealing that bread and beef were the primary contributors to climate change. The study suggested a greater potential for bread waste reduction due to its significantly larger mass than beef. Additionally, the study concluded that separating food waste from its packaging at the source and utilizing waste bread as animal feed were viable strategies for reducing greenhouse gas emissions. Investigating waste from farmers’ markets in Hangzhou, China, Jun et al. (Citation2022) discovered that leafy vegetables and bananas contributed most to waste, with waste generation varying by season and market size.
Considering these studies, it becomes evident that while there is a growing body of research on FLW quantification, much of it is concentrated in developed countries and specific parts of the supply chain, such as supermarkets and households. This leaves a notable research gap, particularly in understanding FLW dynamics in different settings, such as street markets in developing countries like Brazil. Our study aims to fill this gap by concentrating on the quantification and carbon footprint emissions of FLW in Brazilian street markets. Through this exploration of an underrepresented area, we strive to provide meaningful contributions to sustainable food waste management and assist in formulating food waste prevention strategies.
3. Materials and methods
3.1. Waste quantification
In this study, food loss and waste (FLW) is defined as food, along with any associated inedible parts, that has been removed from the human food supply chain and disposed of in landfills, through controlled combustion, in sewage systems, by anaerobic digestion, via composting, or through land application (UNEP, Citation2021).
This research examined ten street markets in São Paulo and Ribeirão Preto. These two cities have different characteristics. São Paulo, as a populous urban and economic centre, offers insights into the food waste generated in a densely populated, highly urbanized context. Ribeirão Preto, located in the middle of a series of neighbouring municipalities in which agriculture is the main economic activity, allows for understanding food waste generated in street markets that are located closer to farming activities.
The selection of street markets was done by convenience, guided by agreements with waste collection companies, ensuring the uncompressed transportation of generated waste to sorting sites. As a secondary consideration, a diverse range of street market sizes was taken into account to ensure a comprehensive representation in the study.
The waste quantification and characterization involves the physical separation, weighing, and categorization of waste. Prior quantification of food waste in São Paulo’s street markets has been reported (Brancoli et al., Citation2022), and the present study used the same waste quantification method in Ribeirão Preto. During the waste compositional analysis, which was conducted after the street market operations were completed for the day, the municipality followed its regular cleaning routine. Waste generated by stalls was bagged, collected, and transported to the analysis site. The only deviation from the municipality’s usual process was the utilization of a regular truck instead of compactor trucks, chosen to maintain the characteristics of the waste. To prevent bias, vendors were unaware of the study. Furthermore, waste characterization was conducted on the entirety of the collected waste material, i.e. no sampling was conducted (Brancoli et al., Citation2022).
At the sorting site, waste arrived daily at 5 pm, stored until the next day, and then underwent compositional analysis. Information on each street market is given in . The initial step involved weighing the total waste using a digital scale with 10 g accuracy. Subsequently, waste was manually sorted into 200-L drum-type containers according to waste categories at Level II (). Information on the number of customers is not available due to challenges in obtaining accurate and consistent data across various markets and time periods.
Table 1. Street markets that were studied in São Paulo (SP) and Ribeirão Preto (RP).
Table 2. Waste category levels (adapted from Brancoli et al. (Citation2022)).
The present study adopted a waste categorization () that was developed by Brancoli et al. (Citation2022) and used for the quantification of street market waste in São Paulo. The framework employs a three-tiered approach with progressively increasing levels of detail. The primary objective is to facilitate the comparability of different quantification studies with varying scopes.
Level 0 of the waste quantification process includes both unavoidable and avoidable waste, as well as packaging and external waste. Avoidable food waste consists of edible food that was discarded before being consumed. Unavoidable food waste refers to non-consumable portions of food products, such as peels (UNEP, Citation2021). Food that consists of unseparated avoidable and unavoidable parts thrown away before eating are regarded as avoidable food waste only. Packaging waste consists of the retail packaging from street markets and the materials used to transport these products, such as wood, straw, etc.
External waste refers to materials collected but not sold at the street market, such as diapers, household waste, and construction waste. Although it is not the waste from unsold food at the street market, it can contaminate the organic waste flow being transported to waste management schemes, and it may therefore be relevant to waste management.
In Level I, the avoidable fraction is subdivided into six food-group categories: (1) leaves, flowers and stems (2) processed products (3) tubers, bulbs, and roots, (4) vegetables, (5) fruits, and (6) meat. The fractions in level II are further categorised into 25 products, all of which are separated at the product level. The processed products include fruits and vegetables that have been washed, peeled, sliced, or minced and sold in packaging, generally in plastic trays. The category of unavoidable food waste consists of four products: peels; sugarcane bagasse, a by-product of sugarcane juice production; corn straw; and coconut shells, a by-product of the extraction of coconut water, a common beverage sold on Brazilian street markets (Brancoli et al., Citation2022).
This approach enables a classification that applies to the various quantification objectives. For example Level 0 is adequate for estimating the potential for food waste prevention, whereas more detailed data (e.g. Level I or Level II) is required if the objective is, for example, to investigate hotspots for specific waste fractions.
3.2. Life cycle analysis
3.2.1. Goal and scope definition
The objective of this research is to assess the carbon footprint of various food items that are frequently wasted at street markets. The goal is to ascertain the carbon footprint profiles for the cities of São Paulo and Ribeirão Preto, which enables the identification of hotspots, i.e. processes and activities that significantly impact the climate. The findings should aid in prioritizing investigations into the causes of food waste generation and support the development of viable solutions to reduce its carbon footprint by waste prevention and valorisation.
The functional unit is the average amount and composition of food waste generated per stall on each market day. The waste from individual stalls is mixed before collection and transportation to the sorting site and the study initially quantified the total amount and composition of waste generated by the entire market. The choice of ‘per stall’ as the functional unit facilitates comparisons across a variety of markets with different number of stalls within the studied cities. Additionally, this approach is beneficial for extrapolating data to the city level, since municipalities often possess detailed data on the number of stalls in each market. The system boundary is cradle to grave, which includes all stages from initial production through to waste management.
The production of agricultural products included land use, seedlings, fertiliser, pesticides, machinery work, electricity, irrigation, transportation, cooling during transportation, water washing, and other processes, such as packaging of fertiliser and pesticide. illustrates the various steps involved in the production of vegetable products, as well as meat, which includes animal husbandry, slaughter, electricity consumption, and transportation. The impacts from agricultural production for the unavoidable fraction is assumed to be zero since this fraction is the byproduct of the edible food that is grown for human consumption, and the edible part has already been consumed.
Figure 1. System boundaries for cradle-to-grave LCA.
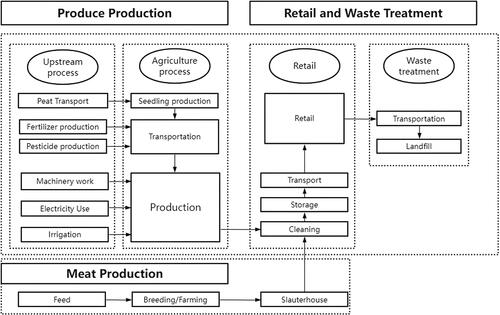
While the packaging materials associated with the production phase, such as those used for fertilizers and pesticides, are included in this study, it is important to note that waste categories related to packaging waste and external waste () were not included in the LCA. The carbon footprint was assessed using global warming potential, based on ReCiPe 2016 midpoint method, Hierarchist version (Huijbregts et al., Citation2016) as available in SimaPro.
3.2.2. Life cycle inventory analysis
The life cycle of the product was modelled using the SimaPro 9.3.0.3 software. The life cycle includes four stages: production, transportation, street market sales, and disposal. The agricultural production processes range from seed production to harvesting. provides details of the system boundaries used in the present study. The details of the modelling of the different food waste categories are presented in Appendix A—Waste fractions modelling.
The process for food production was modified from the ecoinvent database (Wernet et al., Citation2016). This includes data of energy use, electricity consumption, transportation, chemical production, agriculture, and waste management. Most inventory data is global, and it was necessary to adapt it to fit the Brazilian context. Regional variations in fertilizer application significantly affect the carbon footprint of agricultural production. To ensure the accuracy of the LCA, all inventoried fertilizers were adapted from the ecoinvent dataset to align with local conditions, based on published literature or official websites; more details and sources can be found in Appendix B—Inventory data modified from ecoinvent. Other inventoried processes, such as irrigation, seedling production, electricity use and machinery work, were investigated and modified to match typical Brazilian agricultural production practices. The remaining data for agricultural production were derived from the global average models (Wernet et al., Citation2016). Transportation in this section refers to movement from a farm to a street market and street market to the open dump site. Any transportation-related data from the primary production are mentioned above in the production section which are not included in this part. e.g. transportation of fertilizers, are included in the production phase. The transportation from production to the street markets was modelled using the ecoinvent, global market model. The distance from the street markets to the open dump site is 25 km (SP) and 63 km (RB), respectively.
In Brazil, virtually all waste is disposed in open dumps or landfills (Lino et al., Citation2023). Therefore, end of life was modelled as landfilling.
3.3. Data analysis
Data related to waste sorting were manually collected and presented as the average waste generated per stall for each category. This is calculated by dividing the total mass of each type of waste generated at the street market by the number of stalls in operation. Descriptive statistics were then employed to summarize and characterize the dataset, considering measures of central tendency such as mean and median, along with indicators of variability including standard deviation and coefficient of variation.
Moreover, the data was extrapolated to the city-level for one year to provide a preliminary estimate of the total amount of waste generated by street markets in São Paulo and Ribeirão Preto. This extrapolation was done by multiplying the average waste generation per stall by the number of stalls operating throughout a year in each city. This assumes that the average size of stalls in both cities is similar.
4. Results
4.1. Comparison between street markets
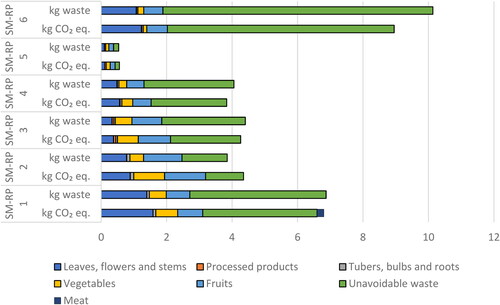
reveals that among the street markets in Ribeirão Preto, SM-RP 6 generated the highest amount of waste, with 10.13 kg of waste per stall and a carbon footprint of 8.94 kg CO2 eq. SM-RP 5, on the other hand, had the lowest waste generation and carbon footprint, producing only 0.54 kg of waste and 0.56 kg CO2 eq. per stall, respectively; overall, about one-third of the waste generated in Ribeirão Preto was classified as unavoidable. The results of the waste compositional analysis are described in Appendix C—Waste quantification data (kg per street market) from São Paulo (SP) and Ribeirão Preto (RP).
Figure 2. Amount of food waste (kg per stall) and respective carbon footprint (kg CO2 eq. per stall) in Ribeirão Preto’s street markets (SM-RP) categorised at level I.
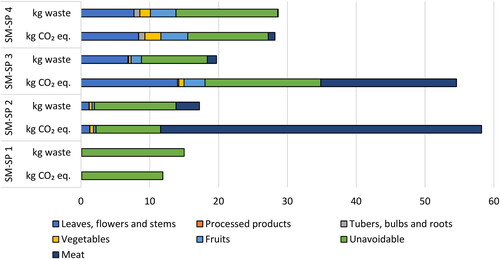
In São Paulo’s street markets (), waste production was higher than that of Ribeirão Preto, ranging from 15 kg per stall in SM-SP 1 to 28.66 kg per stall in SM-SP 4. Despite this, the greatest carbon footprint was observed from SM-SP 2, with 58.22 kg CO2 eq., largely attributed to the significant amount of wasted meat. This is because meat products greatly contribute to carbon footprint. SM-SP 3 had the second highest carbon footprint of 35.5 kg CO2 eq.
Figure 3. Amount of food waste (kg per stall) and respective carbon footprint (kg CO2 eq. per stall) in São Paulo street markets (SM-SP) categorised at level I.
Unavoidable food waste is the food waste category that has the largest mass in all street markets. Waste generation under this category varied widely, ranging from 0.16 kg per stall in SM-RP 5 to 14.89 kg per stall in SM-SP 1, equating to 0.13 kg CO2 eq. and 11.69 kg CO2 eq., respectively.
Two waste products (at Level II) were identified as the largest contributors to the mass and carbon footprint of unavoidable waste: coconut shells and sugarcane bagasse. Specifically, the average waste of coconut shells accounted for 27% (RP) and 47% (SP) of the total mass of unavoidable waste, while sugarcane bagasse was responsible for approximately 30% in both cities. This reflects the cultural food preferences, where coconut water and sugarcane juice are commonly consumed beverages. Additionally, a large amount of corn husk was wasted, which is attributed to the popularity of pamonha - a traditional food made from corn - which is widely sold at these markets.
The food waste category that has the second highest mass is leaves, flowers and stems, although the variation between street markets is large, from a negligible amount in SM-SP 1 to a significant 7.71 kg in SM-SP 4. This results in a maximum carbon footprint of 8.38 kg CO2 eq. Following this, the categories of fruits, vegetables, and tubers, bulbs, and roots (TBRs) were the next highest contributors to the mass of food waste. It is notable that the category of processed products has a relatively low mass of waste and bore the smallest carbon footprint across most of the street markets studied.
and together with show that there may be a correlation between the size of the street market (measured in terms of the number of stalls) and the per-stall waste generation rates. Within a city, stalls positioned within larger street markets seem to generate more waste and have a greater carbon footprint compared to their counterparts in smaller street markets. For instance, in Ribeirão Preto, where SM-RP 6 and SM-RP 1—the street markets hosting the highest number of stalls (68 and 55, respectively)—have the most waste and CO2 eq. emissions per stall. Conversely, SM-RP 5, having the fewest stalls, generates the least waste and CO2 eq. emissions per stall. A similar trend is noticeable in São Paulo, where SM-SP 2, which hosts 73 stalls, has the highest carbon footprint. In contrast, SM-SP 1, with only three stalls, is associated with the lowest CO2 eq. emission and waste. This observation is in agreement with those of Jun et al. (Citation2022), who identified a positive correlation between the volume of fruit and vegetable waste, the size of farmers’ markets, and the volume of sales.
4.2. Comparative results—São Paulo and Ribeirão Preto
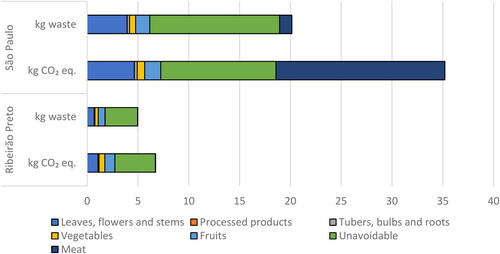
The comparison of waste quantification and carbon footprint between the two cities, Ribeirão Preto and São Paulo, uncovers both similarities and differences (). The quantities of waste, its composition, and associated carbon footprint in the two cities were markedly different. Ribeirão Preto had lower waste generation per stall compared to São Paulo. São Paulo generated approximately 20.15 kg of waste per stall, with an average carbon footprint of 35.20 kg CO2 eq. This is significantly higher than Ribeirão Preto, which generated around 4.98 kg of food waste per stall and 6.74 kg CO2 eq. In other words, the quantity of waste generated and the carbon footprint per stall in São Paulo are approximately four and seven times greater, respectively, than those in Ribeirão Preto.
Figure 4. Average mass (kg per stall) and respective carbon footprint (kg CO2 eq. per stall) in Ribeirão Preto and São Paulo street markets (SM) categorised at level I.
This discrepancy in waste levels could be explained by some characteristics of the cities. The majority of vendors in São Paulo’s street markets purchase their products from CEAGESP (Companhia de Entrepostos e Armazéns Gerais de São Paulo), the largest wholesaler of fruits and vegetables in Brazil. In Ribeirão Preto, a significant fraction of vendors also produce the food, a characteristic that potentially favours lower levels of waste generation relative to São Paulo. This dual role often implies a shorter supply chain, affording the opportunity to harvest produce closer to the point of sale and thereby decreasing damage during storage and transportation. Furthermore, these vendor-producers exert direct control over the volume of produce they transport to the market, enabling them to align supply more accurately with anticipated demand and subsequently reduce the surplus of unsold produce. Another consequence of this operational model is the broader spectrum of options for utilizing unsold produce, which would otherwise increase waste. Such produce might be repurposed by the vendor-producers for various uses, including animal feed, or processing into other consumable goods. Lastly, the direct-to-consumer sales model often grants greater flexibility regarding the aesthetic standards of produce. As a result, vendor-producers can market produce that might not meet the cosmetic criteria of wholesalers but remains perfectly edible, providing an additional avenue for waste reduction.
The food waste composition in São Paulo’s street markets was dominated by unavoidable waste, particularly coconut shells and sugarcane bagasse. Meat and unavoidable waste made the largest contribution to the carbon footprint in São Paulo. Similar trends were observed in Ribeirão Preto, with unavoidable waste being the largest waste category by mass. However, contrary to São Paulo, the unavoidable waste category was also the largest contributor to the carbon footprint of the street markets. Processed products had almost no impact on mass or carbon footprint in both cities due to the low amounts of waste in this category.
shows the average results for São Paulo and Ribeirão Preto. The results for the mass category are shown for avoidable and unavoidable waste, and the carbon footprint are presented for the different phases in the life cycle of the product, namely, production, transportation, and end-of-life. The production phase in this context comprises activities related to the cultivation of produce and the animal husbandry required to produce meat, in addition to subsequent operations involved in storage and clearance. The transportation phase, on the other hand, specifically corresponds to the conveyance of products from their point of production to the street markets. The results reveal that the production phase accounts for 16.7 kg CO2 eq., which is 47% of the total climate change in São Paulo, and of this 93% is from meat, even though the mass of meat waste is much smaller than other waste fractions (the mass of meat waste is 6% of total waste in São Paulo street markets). Meat production significantly contributes to global CO2 eq. emissions due to a range of factors. These include land use changes, particularly deforestation for pastures or feed crops, which release stored carbon into the atmosphere. Methane emissions from ruminant animals, like cattle, are also a major factor given methane’s high global warming potential. Additionally, the cultivation, harvesting, and transportation of grain or soy for feed production; the decomposition of animal waste; energy consumption in modern intensive farming practices; and the energy requirements for meat processing, refrigeration, and transportation all contribute to the substantial CO2 eq. emissions associated with meat production.
Figure 5. Waste mass and relative CO2 eq. contributions from São Paulo and Ribeirão Preto.
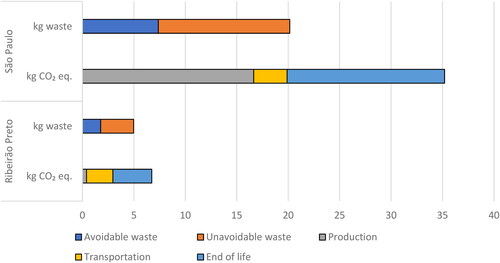
Transportation accounts for 38% and 9% of the total carbon footprint in Ribeirão Preto and São Paulo, respectively. The end of life is a major source of carbon footprint in both cities, accounting for 56% in Ribeirão Preto and 44% in São Paulo, respectively. This is mainly because waste is landfilled, which is common in developing countries. Landfills are common due to small waste management budgets and a lack of trained personnel (Ali et al., Citation2014). Such disposal sites, typically landfills or unregulated waste dumps, present a significant risk to both groundwater resources and soil quality. This concern is especially pronounced in the case of unavoidable waste, which, constituting approximately 65% of the total waste mass in both cities, represents the largest waste fraction.
4.3. Data extrapolation to the city level
The yearly food waste generated for the entire cities of São Paulo and Ribeirão Preto was estimated by extrapolating the waste generation per stall from the 10 street markets in these cities (Hanson et al., Citation2016). The extrapolation offers insights into the patterns and scales in street market settings, potentially guiding policymakers, stakeholders, and future research in understanding the extent of food waste issues in similar contexts. Information about the street markets included in this study can be found in .
In addition, the standard deviation, standard error of the mean, coefficient of variation, and first and third quartiles were calculated. These data are presented in and show the variability within the dataset. It’s important to emphasize that this extrapolation is not intended to be a definitive representation of all street markets but serves as a valuable indicator of the differences in waste generated between these two cities.
Table 3. Descriptive statistics of waste generation rates at street markets in São Paulo and Ribeirão Preto.
The average food waste generated in São Paulo was 20.15 ± 5.19 kg per stall. With 871 registered street markets operating 52 weeks a year, and a total of 48,004 stalls (Prefeitura de São Paulo, Citation2020), the annual food waste generation in São Paulo was estimated to be 50,300 ± 12955 tonnes. This yields a carbon footprint of approximately 87,869 tonnes of CO2 eq. per year.
There were 35 registered street markets in Ribeirão Preto in 2022 (Prefeitura de Ribeirão Preto, Citation2023). Data for the number of stalls was not available. However, based on the average number of stalls from the six street markets included in this study, the total number of stalls was estimated to be 1,435. Assuming these markets also operate throughout the 52 weeks of the year, it was estimated that Ribeirão Preto generates 372 ± 220 tonnes of food waste per year, which yields 503 tonnes of CO2 eq. These values are then divided by the population of each city, resulting in an estimated annual waste generation at street markets in São Paulo and Ribeirão Preto of 2.22 kg/capita and 0.50 kg/capita, respectively (Galindo et al., Citation2022, UNITED NATIONS, Citation2020) ().
Table 4. Data extrapolation to city-level (CF: Carbon Footprint).
In Ribeirão Preto, the annual amount of avoidable food waste was estimated to be 132 tonnes, while the amount of unavoidable food waste was 240 tonnes (). Due to the dominance of unavoidable food waste, the end of life was the phase of the food products’ life cycle that contributed the most to the impacts, accounting for approximately 56% of the total emissions. The results indicate that actions that divert organic waste from landfills have the greatest potential to reduce the carbon footprint of food waste generated at street markets in Ribeirão Preto.
5. Discussion
5.1. Hotspots
A hotspot is a product, product category, process, or lifecycle stage that contributes significantly to the impact of interest. Based on the findings of the waste compositional analysis and the life cycle assessment, (1) unavoidable waste, (2) leaves, flowers and stems, and (3) meat were identified as three hotspots.
The results reveal that approximately 65% of the total mass comes from unavoidable waste. The unavoidable waste consists of coconut shells, sugarcane bagasse, corn straw and peels. This can be explained by the popular consumption of sugarcane juice, coconut water and pamonha (traditional corn-based food). The high carbon footprint is associated with the high amounts that are sent to landfills, and it suggests that valorisation, or other waste management methods, of this type of waste is essential to decrease the carbon footprint of food waste at street markets.
Leaves, flowers and stems (LFS) accounted for the largest category of avoidable food waste in terms of mass, and due to resource use and emissions in both agricultural production and end-of-life, it also contributed most to the carbon footprint in Ribeirão Preto. LFS consists primarily of individual leaves, particularly lettuce, and stems (Brancoli et al., Citation2022). The findings from this study are in agreement with those of de Brito Nogueira et al. (Citation2020), who reported that the greatest quantity of processing waste came from leafy vegetables because of the removal of stems and damage to leaves. Vendors usually remove the outer layers of leafy products during the day to improve their appearance (de Brito Nogueira et al., Citation2020). Low humidity and high temperatures during sales, as well as consumers handling the products, are common causes of damage (Brancoli et al., Citation2022). The phenomena observed in Brazil mirror similar challenges with leafy waste in other parts of the world. For instance, Eriksson et al. (Citation2012) report that Swedish retailers generate a substantial amount of leafy waste. In a study of South Florida grocery stores, Mijares et al. (Citation2021) found that 28% of total waste was comprised of leafy products. This can be explained by the fact that leafy products are particularly vulnerable to mechanical harm, fungal or bacterial deterioration, water loss, and chlorophyll degradation (Lana & Moita, Citation2020).
Meat is also an important source of greenhouse gas emissions (Willett et al., Citation2019). According to a United Nations Food and Agriculture Organisation (FAO) report, the global livestock sector accounts for approximately 14.5% of global greenhouse gas emissions, with beef and dairy products being the largest contributors (Gerber et al., Citation2021). In this study, meat has a relatively high carbon footprint in some of the street markets in São Paulo. However, the mass of meat waste is relatively low compared to other products, primarily due to its high economic value which encourages vendors to prevent its waste.
The processed products generated the lowest amount of waste and CO2 eq. This result is unexpected given that the shelf life for these products after processing is typically one day, which could lead to a considerable amount of waste. According to interviews, vendors frequently process the product themselves so that they can better control the supply in accordance with demand.
5.2. Opportunities for reducing carbon footprint
Unavoidable waste is one of the main contributors to mass and carbon footprint from waste at São Paulo and Ribeirão Preto street markets. This waste is assumed to be landfilled in this study, which is the typical waste management method in Brazil. Landfilling has a large impact on the climate. Thus, alternatives to valorise unavoidable waste should be investigated and evaluated in relation to its potential climate benefits.
Although combustion is one alternative, based on the waste hierarchy, it is not recommended due to its low efficiency for food waste, the production of ash in boilers and incomplete biomass combustion, which releases pollutants like carbon monoxide, methane, nitrogen oxides, benzene, formaldehyde, aromatics, and respirable particulate matter into the air. This can cause fouling, scaling, and corrosion of the heat transfer surfaces and hazardous effects on human health and the environment (Prasara-A et al., Citation2019).
Anaerobic digestion and composting are environmentally friendly and efficient alternatives for recycling unavoidable food waste. These pathways rely on the biological breakdown of the organic material, and take place under anaerobic and aerobic conditions, respectively. Biogas is one of the products of anaerobic digestion, and the energy in biogas can be utilized for generating electricity and heat, as well as fuel for vehicles and cooking fuel (Balat & Balat, Citation2009). In comparison to combustion, anaerobic digestion can reduce greenhouse gas emissions by up to a factor of thirteen (Bernstad Saraiva Schott & Andersson, Citation2015). Composting food waste can be beneficial since it avoids landfilling, but it can also provide benefits through the production of compost, a nutrient-rich product that can substitute the use of mineral fertilisers and improve soil structure (Cerda et al., Citation2018). Nevertheless, the complex and recalcitrant structure of sugarcane bagasse and coconut shells deems them resistant to degradation and poses a significant impediment to anaerobic digestion and composting. Therefore, pretreatment methods may be required to deconstruct the materials for microbial digestion (Agarwal et al., Citation2022).
Coconut shell is a major source of unavoidable waste in Brazilian street markets and, in fact, Brazil is the fifth-largest coconut producer in the world (Curia et al., Citation2021). In addition to anaerobic digestion and composting, the biomass content of coconut husk allows for a variety of other applications. For instance, the fibrous nature of the husk can be exploited for the production of biochar, a carbon-rich product obtained through pyrolysis. Biochar has been recognized for its potential in carbon sequestration, soil amendment, and even as a source of renewable energy (Lehmann & Joseph, Citation2015).
Leafy products are the most common waste in the avoidable waste category. Prevention should be prioritised, which can be achieved by understanding the main causes of this type of waste. Vendors cited a lack of knowledge of proper storage methods and a lack of infrastructure that would permit proper storage and display of products during transportation and sale as leading causes of food waste. Furthermore, excessive handling by vendors and consumers has been observed, along with the improper display of products at the stalls. The interviews also revealed that street market vendors have a low awareness of the topic of food waste. Concerning valorisation pathways, Mahgoub et al. (Citation2018) report that leafy vegetable waste is an excellent source of nutrients that can potentially be used as animal feed.
5.3. Potential risk factors for, and causes of, waste generation
There are several potential risk factors for, and causes of, food waste at street markets. One of the major causes of food waste at street markets is the perishability of produce. Due to a lack of understanding of adequate storage techniques and restricted access to infrastructure, vendors often struggle to keep the products fresh throughout transportation and sale. This leads to a significant amount of food waste.
The problem is exacerbated by a lack of knowledge and awareness. Both vendors and customers may lack knowledge and awareness regarding food waste. Vendors may not be aware of the amount and composition of waste they generate, making it challenging for them to implement effective waste reduction measures. Additionally, vendors may not be familiar with methods to utilize unsold parts of fruits and vegetables. Similarly, customers often handle food improperly and excessively due to insufficient instruction.
Another risk factor is the low economic benefit. When considering waste reduction and valorisation methods, vendors typically prioritize options that provide immediate economic benefit. While there are social and environmental benefits associated with sustainable waste management practices, these may not be immediately visible or directly contribute to vendors’ earnings. Therefore, in the day-to-day reality of the market, choices are frequently driven by the simplest economic benefits, i.e. what brings in revenue or reduces costs.
The absence of specific laws and regulations concerning food waste in street markets can contribute to the problem. Clear guidelines and regulations can help enforce waste reduction practices and encourage vendors and customers to adopt more sustainable behaviours. The size of the market and its sales volume also play a significant role since these may correlate with the amount of waste generated. Larger markets with higher sales volume tend to produce more waste per stall (Jun et al., Citation2022). This can be attributed to factors such as inventory control challenges and inadequate forecasting of demand, leading to over-purchasing and subsequent waste (Jun et al., Citation2022).
Finally, conditions within street markets, including temperature, humidity, and sanitary conditions, can impact the shelf life of products and the handling methods employed by vendors. Poor conditions may accelerate spoilage and contribute to increased food waste.
5.4. Limitations related to life cycle inventory data
Some of the inventory data, such as information pertaining to fertilizer, was extracted from a variety of articles and authoritative websites (Appendix B—Inventory data modified from ecoinvent). Due to the absence of comprehensive data, other inventory data linked to the production process, including aspects like pesticide use, seedling production, and transportation mode, were obtained from global average models from the ecoinvent database, specifically the Global (GLO) and Rest of World (ROW) models.
However, it is important to stress that there exists a considerable degree of variability across different regions, and even between individual farms. For example, aspects like transportation distances and the type of vehicles used, as estimated by the GLO and ROW models, can vary widely depending on the specific region being modelled. As such, data extracted from GLO or ROW models bear a degree of uncertainty and may require adjustment, especially in the context of regions or countries with unique characteristics, like Brazil. Additionally, the carbon footprint of the items grouped under ‘other’ at the Level II category was modelled as an average of other products in the same category. Despite these uncertainties and variations, which may influence the results, we do not anticipate that they will alter the conclusions of the study.
6. Conclusion
This study conducted a comprehensive investigation into food waste generated at street markets, considering the amount, type, and associated carbon footprint in two Brazilian cities, Ribeirão Preto and São Paulo. Street markets in São Paulo had a significantly higher per-stall waste production and consequent carbon footprint than those in Ribeirão Preto. Our findings revealed that 4.98 kg and 20.15 kg per stall of food were wasted in Ribeirão Preto and São Paulo, respectively, leading to CO2 eq. emissions of 6.74 kg and 35.20 kg, respectively.
Unavoidable food waste, LFS and meat, were identified as hotspots. Unavoidable food waste is one of the largest contributors to climate change in both cities, primarily due to its high volume and the waste treatment process, which is landfilling. Unavoidable waste accounted for approximately 65% of the total mass and 30% to 60% of the CO2 eq. emissions. As such, it is important to prioritize the valorisation of unavoidable waste, and implementing alternative waste treatment methods could potentially reduce the carbon footprint associated with this waste fraction. Leaves, flowers and stems were the second largest contributor in the avoidable waste category (after meat), constituting 13%–16% of the total greenhouse gas emissions. As a result, LFS should be prioritized in both prevention and valorisation measures, including potential use as animal feed. Reducing the mass of meat waste may present challenges, given the small amounts of waste currently observed. Our findings underscore the significant environmental implications of food waste management at street markets and suggest potential areas for intervention to reduce their carbon footprint. Further research is required to evaluate the efficacy of such intervention measures and their potential scalability to other contexts.
Authors contributions
Conceptualization, Z.L. and P.B.; methodology, Z.L. and P.B.; validation, Z.L., P.B. and K.R.; formal analysis, Z.L., P.B. and K.R.; investigation, Z.L.; resources, Z.L., P.B., K.R. and K.B.; data curation, Z.L., P.B. and K.R.; writing—original draft preparation, Z.L.; writing—review and editing, Z.L., P.B., K.R. and K.B.; visualization, Z.L.; supervision, Z.L., P.B., K.R. and K.B.; project administration, Z.L., P.B. and K.R.; funding acquisition, Z.L., P.B., K.R. and K.B. All authors have read and agreed to the published version of the manuscript.
This research was funded by Swedish Environmental Protection Agency (Naturvårdsverket).
Declaration of generative AI and AI assisted technologies in the writing process
During the preparation of this work, the author(s) used CHATGPT to enhance the readability and language of the manuscript. After using this tool, the author(s) reviewed and edited the content as needed and take(s) full responsibility for the content of the publication.
Acknowledgments
The authors are grateful for funding from the Swedish Environmental Protection Agency (Naturvårdsverket). We also acknowledge support from the municipality of São Paulo and Ribeirão Preto, and the São Paulo municipal urban cleaning authority (AMLURB).
Disclosure statement
The authors declare no conflict of interest.
References
- Abras, A. B. D. S. A. (2021). 21 Avaliação de perdas no varejo brasileiro de supermercados. ABRAS.
- Agarwal, N. K., Kumar, M., Ghosh, P., Kumar, S. S., Singh, L., Vijay, V. K., & Kumar, V. (2022). Anaerobic digestion of sugarcane bagasse for biogas production and digestate valorization. Chemosphere, 295, 1. https://doi.org/10.1016/j.chemosphere.2022.133893
- AICL. (2017). Cabbage (Brassica oleracea) on a clay soil. AICL/Fertilizers.
- Ali, S. M., Pervaiz, A., Afzal, B., Hamid, N., & Yasmin, A. (2014). Open dumping of municipal solid waste and its hazardous impacts on soil and vegetation diversity at waste dumping sites of Islamabad city. Journal of King Saud University - Science, 26(1), 59–18. https://doi.org/10.1016/j.jksus.2013.08.003
- Amaro, G. B., Hanashiro, M. M., Pinheiro, J. B., Madeira, N. R., & Faustino, R. M. E. B. (2021). Recomendações técnicas para o cultivo de abóboras e morangas. Embrapa Hortaliças - Circular Técnica (INFOTECA-E), 42.
- Balat, M., & Balat, H. (2009). Biogas as a renewable energy source—a review. Energy Sources, Part A, 31(14), 1280–1293. https://doi.org/10.1080/15567030802089565
- Bernstad Saraiva Schott, A., & Andersson, T. (2015). Food waste minimization from a life-cycle perspective. Journal of Environmental Management, 147, 219–226. https://doi.org/10.1016/j.jenvman.2014.07.048
- Bouju, C., & Igergård, F. (2019). Wasted potential: Potential of a food waste prevention model for the São Paulo street markets-A minor field study.
- Brancoli, P., Makishi, F., Lima, P. G., & Rousta, K. (2022). Compositional analysis of street market food waste in Brazil. Sustainability, 14(12), 7014. https://doi.org/10.3390/su14127014
- Carvalho, A. D. F., Silva, G. O., & Ragassi, C. F. (2021). Sistemas de Produção n° 2 - Cenoura Daucus Carota L. EMBRAPA Hortaliças.
- Cenoura, D. C.L., Carvalho, A. D. F. D., Silva, G. O. D., & Ragassi, C. F. (2021). Sistemas de Produção n° 2. Embrapa.
- Cerda, A., Artola, A., Font, X., Barrena, R., Gea, T., & Sánchez, A. (2018). Composting of food wastes: Status and challenges. Bioresource Technology, 248(Pt A), 57–67. https://doi.org/10.1016/j.biortech.2017.06.133
- Ceuppens, S., Hessel, C. T., DE Quadros Rodrigues, R., Bartz, S., Tondo, E. C., & Uyttendaele, M. (2014). Microbiological quality and safety assessment of lettuce production in Brazil. International Journal of Food Microbiology, 181, 67–76. https://doi.org/10.1016/j.ijfoodmicro.2014.04.025
- Coltro, L., & Karaski, T. U. (2019). Environmental indicators of banana production in Brazil: Cavendish and Prata varieties. Journal of Cleaner Production, 207, 363–378. https://doi.org/10.1016/j.jclepro.2018.09.258
- Costa, C. S. R., Henz, G. P., Lopes, C. A., Ribeiro, C. S. C., Cruz, D. M. R., França, F. H., Reifschneider, F. J. B., Henz, G. P., Silva, H. R., Pessoa, H. S., Bianchetti, L. B., Junqueira, N. V., Makishima, N., Fontes, R. R., Carvalho, S. I. C., & Pereira, W. (2007). Pimenta (Capsicum spp.). EMBRAPA.
- Curia, A. C., Souza, A. R. D., Zaro, J. R., Barbieri, M. R. R., Kappler, G., & Moraes, C. A. M. (2021). Waste Management and Application of Coconut Biomass and Fibre. In M. Jawaid, & A. Khan (Eds.), Vegetable Fiber Composites and their Technological Applications. Composites Science and Technology (pp. 215–237). Springer, Singapore. https://doi.org/10.1007/978-981-16-1854-3_9
- da Costa Mello, S., Tonhati, R., Neto, D. D., Darapuneni, M., & Pavuluri, K. (2018). Response of tomato to polyhalite as a multi-nutrient fertilizer in southeast Brazil. Journal of Plant Nutrition, 41(16), 2126–2140. https://doi.org/10.1080/01904167.2018.1497178
- da Silva, R. B., Antunes, T., Rosa, J. S., Packer, A. P., Bento, C. B., DO Carmo, J. B., & DE Melo Silva, F. A. (2022). CO2, CH4 and N2O emissions after fertilizer application in banana plantations located in the Brazilian Atlantic Forest. Soil Use and Management, 38(4), 1597–1613. https://doi.org/10.1111/sum.12822
- de Brito Nogueira, T. B., da Silva, T. P. M., de Araújo Luiz, D., de Andrade, C. J., de Andrade, L. M., Ferreira, M. S. L., & Fai, A. E. C. (2020). Fruits and vegetable-processing waste: a case study in two markets at Rio de Janeiro, RJ, Brazil. Environmental Science and Pollution Research International, 27(15), 18530–18540. https://doi.org/10.1007/s11356-020-08244-y
- de Freitas, G. B. R., Márcio, S., Santos, R. H. S., Freitas, L. M. D. S., & Resende, L. D. A. (2011). Broccoli yield in response to top-dressing fertilization with green manure and biofertilizer. Revista Ceres, 58(5), 645–650. https://doi.org/10.1590/S0034-737X2011000500016
- de Moraes, C. C., Costa, F. H. D. O., DA Silva, A. L., César, A. D. S., Delai, I., & Pereira, C. R. (2022). Causes and prevention practices of food waste in fruit and vegetable supply chains: How is Brazil dealing with these issues? Waste Management (New York, N.Y.), 154, 320–330. https://doi.org/10.1016/j.wasman.2022.10.021
- de Resende, G. M., Yuri, J. E., & Mota, J. H. (2013). Alface: efeito testado. Embrapa Semiárido. EMPRABA.
- Eriksson, M., Persson Osowski, C., Malefors, C., Björkman, J., & Eriksson, E. (2017). Quantification of food waste in public catering: A case study from a Swedish municipality. Waste Management (New York, N.Y.), 61, 415–422. https://doi.org/10.1016/j.wasman.2017.01.035
- Eriksson, M., Strid, I., & Hansson, P.-A. (2012). Food losses in six Swedish retail stores: Wastage of fruit and vegetables in relation to quantities delivered. Resources, Conservation and Recycling, 68, 14–20. https://doi.org/10.1016/j.resconrec.2012.08.001
- FAO. (2019). The State of Food and Agriculture 2019. Moving forward on food loss and waste reduction.,
- Fehr, M., & Romão, D. C. (2001). Measurement of fruit and vegetable losses in Brazil: a case study. Environment, Development and Sustainability, 3(3), 253–263. https://doi.org/10.1023/A:1012773330384
- Fernandes, A. M., Reis, A., Carvalho, A. D. F., Bortoletto, A. C., & Pereira, A. S. (2004). Como Plantar Batata. EMBRAPA.
- Galindo, E., Teixeira, M. A., Araújo, M., Motta, R., Pessoa, M., Mendes, L., & Rennó, L. (2022). Efeitos da pandemia na alimentação e na situação da segurança alimentar no Brasil.
- Gerber, P. J., Steinfeld, H., Henderson, B., Mottet, A., Opio, C., Dijkman, J., Falcucci, A., & Tempio, G. (2021). Tackling climate change through livestock: A global assessment of emissions and mitigation opportunities. Food and Agriculture Organization of the United Nations (FAO).
- Hanson, C., Lipinski, B., Robertson, K., Dias, D., Gavilan, I., Gréverath, P., Ritter, S., Fonseca, J., Vanotterdijk, R., & Timmermans, T. (2016). Food loss and waste accounting and reporting standard. United States of America: The World Resources Institute.
- Hoehn, D.,Vázquez-Rowe, I.,Kahhat, R.,Margallo, M.,Laso, J.,Fernández-Ríos, A.,Ruiz-Salmón, I., &Aldaco, R. (2023). A critical review on food loss and waste quantification approaches: Is there a need to develop alternatives beyond the currently widespread pathways?. Resources, Conservation and Recycling, 188, 106671 10.1016/j.resconrec.2022.106671
- Huijbregts, M. A. J., Steinmann, Z. J. N., Elshout, P. M. F., Stam, G., Verones, F., Vieira, M. D. M., Hollander, A., Zijp, M., & VAN Zelm, R. (2016). ReCiPe 2016: a harmonized life cycle impact assessment method at midpoint and endpoint level. The International Journal of Life Cycle Assessment, 22.10.1007/s11367-016-1246-y.
- Ilo, F. A. O., & Ifad, W. H. O. (2020). Impact of COVID-19 on people’s livelihoods, their health and our food systems [Online]. Available: https://www.who.int/news/item/13-10-2020-impact-of-covid-19-on-people's-livelihoods-their-health-and-our-food-systems [Accessed on 29 August 2022].
- ISO. (2006a). ISO 14040:2006 Environmental management–life cycle assessment–principles and framework. International. Standardization Organization.: In International Organization for Standardization.
- ISO. (2006b). ISO 14044:2006 environmental management: Life cycle assessments: requirements and guidelines. International. Standardization Organization.: In International Organization for Standardization.
- Jun, Y., Yifan, W., Qiongyin, W., Shuo, Z., Meizhen, W., Huajun, F., Jun, J., Xiaopeng, Q., Yanfeng, Z., & Ting, C. (2022). Generation of fruit and vegetable wastes in the farmers’ market and its influencing factors: A case study from Hangzhou, China. Waste Management (New York, N.Y.), 154, 331–339. https://doi.org/10.1016/j.wasman.2022.10.023
- Lana, M. M., & Moita, A. W. (2020). Qualidade visual e perdas pós-colheita de hortaliças folhosas no varejo: dois estudos de caso no Distrito Federal, Brasil.
- Lehmann, J., & Joseph, S. (2015). Biochar for environmental management: science, technology and implementation. Routledge.
- Lino, F. A. M., Ismail, K. A. R., & Castañeda-Ayarza, J. A. (2023). Municipal solid waste treatment in Brazil: A comprehensive review. Energy Nexus, 11, 100232. https://doi.org/10.1016/j.nexus.2023.100232
- Mahgoub, O., T. Kadim, I., Eltahir, Y., Al-Lawatia, S., & M. Al-Ismaili, A. (2018). Nutritional value of vegetable Wastes as livestock feed. Sultan Qaboos University Journal for Science [SQUJS], 23(2), 78. https://doi.org/10.24200/squjs.vol23iss2pp78-84
- Marrocos, S. D. E. T., Grangeiro, L. C., Sousa, V. D. E. F. L. D. E., Ribeiro, R. M. P., & Cordeiro, C. J. (2018). Potassium fertilization for optimization of onion production. Revista Caatinga, 31(2), 379–384. https://doi.org/10.1590/1983-21252018v31n214rc
- May, A., Tivelli, S. W., Vargas, P. F., Grunvald, A., Sacconi, L. V., & Pinheiro, M. Q. (2007). A cultura da couve-flor. Série Tecnologia APTA, Boletim Técnico IAC., 200. Instituto Agronômico.
- Mello, S. D. C., Souza, C. G., Furia, L., & Fields, R. (2018). POLY4 as a multi-nutrient fertilizer to improve yield and quality of carrots in Brazil. University of São Paulo.
- Melo, R. A. C., Vendrame, L. P. C., Madeira, N. R., Blind, A. D., & Vilela, N. J. (2019). Characterization of the Brazilian vegetable brassicas production chain. Horticultura Brasileira, 37(4), 366–372. https://doi.org/10.1590/s0102-053620190401
- Mijares, V., Alcivar, J., & Palacios, C. (2021). Food waste and its association with diet quality of foods purchased in South Florida. Nutrients, 13(8), 2535. https://doi.org/10.3390/nu13082535
- Nowaki, R. H. D., Cecílio Filho, A. B., Faria, R. T. D. E., Wamser, A. F., & Cortez, J. W. M, Universidade Estadual Paulista, Brazil. (2017). Effect of nitrogen fertilization on yield and quality of watermelon, Cv. Top Gun. Revista Caatinga, 30(1), 164–171. https://doi.org/10.1590/1983-21252017v30n118rc
- Oliveira, A. M. G., & Caldas, R. C. (2004). Produção do mamoeiro em função de adubação com nitrogênio, fósforo e potássio. Revista Brasileira De Fruticultura, 26(1), 160–163. https://doi.org/10.1590/S0100-29452004000100042
- Paulo, P. D. S. (2020). Lista completa de feiras [Online]. Secretaria de Trabalho e Empreendedorismo. Available: https://www9.prefeitura.sp.gov.br/secretarias/sdte/pesquisa/feiras/lista_completa.htm [Accessed 01-09-2020 2021].
- Poštić, D., Štrbanović, R., Stanojković-Sebić, A., Tabaković, M., Đurić, N., Jovanović, S., & Stanisavljević, R. (2018). Yield of different pumpkin (Cucurbita maxima Duch.) populations in an organic production system. Journal on Processing and Energy in Agriculture, 22(2), 31–33. https://doi.org/10.5937/JPEA1801031P
- POTATOPRO. (2017). Agricultural Statistics Brazil [Online]. Available: https://www.potatopro.com/brazil/potato-statistics [Accessed on 22 August 2022].
- Prasara-A, J., Gheewala, S. H., Silalertruksa, T., Pongpat, P., & Sawaengsak, W. (2019). Environmental and social life cycle assessment to enhance sustainability of sugarcane-based products in Thailand. Clean Technologies and Environmental Policy, 21(7), 1447–1458. https://doi.org/10.1007/s10098-019-01715-y
- Queiroz, A., Cruvinel, V., & Figueiredo, K. (2017). Produção de alface americana em função da Fertilização com organomineral. Enciclopédia Biosfera, 14(25), 1053–1063. https://doi.org/10.18677/EnciBio_2017A84
- Resende, F. V., & Sousa, R. B. (2006). How to plant onion. EMBRAPA.
- Ribeirão Preto, P. D. (2023). Relação dos Locais de Feira Livre de Ribeirão Preto [Online]. Secretaria da Fazenda. Available: https://www.ribeiraopreto.sp.gov.br/portal/fazenda/feira-livre [Accessed 01-02-2023 2023].
- Rousta, K., & Bolton, K.. Sustainable Resource Recovery and Zero Waste Approaches. (2019). 105–114 Sorting Household Waste at the Source.
- Saerens, W., Smetana, S., VAN Campenhout, L., Lammers, V., & Heinz, V. (2021). Life cycle assessment of burger patties produced with extruded meat substitutes. Journal of Cleaner Production, 306, 127177. https://doi.org/10.1016/j.jclepro.2021.127177
- Santos, S. F. D., Cardoso, R. C. V., Borges, I. M. P., Almeida, A. C. E., Andrade, E. S., Ferreira, I. O., & Ramos, L. D. C. (2020b). Post-harvest losses of fruits and vegetables in supply centers in Salvador, Brazil: Analysis of determinants, volumes and reduction strategies. Waste Management (New York, N.Y.), 101, 161–170. https://doi.org/10.1016/j.wasman.2019.10.007
- Santos, H. C. A., Lima Junior, J. A. D., Silva, A. L. P. D. A., Castro, G. L. S. D., & Gomes, R. F. (2020a). Yield of fertigated bell pepper under different soil water tensions and nitrogen fertilization1. Revista Caatinga, 33(1), 172–183. https://doi.org/10.1590/1983-21252020v33n119rc
- Silva, J. B. C. D., Giordano, L. B., Furumoto, O., Boiteux, L. S., & França, F. H. (2006). Growing tomatoes for industrialization. EMBRAPA.
- Silvennoinen, K.,Nisonen, S., &Katajajuuri, J.-M. (2022). Food waste amount, type, and climate impact in urban and suburban regions in Finnish households. Journal of Cleaner Production, 378, 134430 10.1016/j.jclepro.2022.134430
- Stoessel, F., Juraske, R., Pfister, S., & Hellweg, S. (2012). Life cycle inventory and carbon and water FoodPrint of fruits and vegetables: application to a Swiss retailer. Environmental Science & Technology, 46(6), 3253–3262. https://doi.org/10.1021/es2030577
- Tostivint, C., Östergren, K., Quested, T., Soethoudt, J. M., Stenmarck, Å., Svanes, E., O’Connor, C. (2016).Food waste quantification manual to monitor food waste amounts and progression.
- UNEP. (2021). Food Waste Index Report 2021.
- UNITED NATIONS. (2020). Food Loss, Waste Account for 8 Per Cent of All Greenhouse‑Gas Emissions, Says Deputy Secretary-General, Marking Inaugural International Awareness Day [Online]. Available: https://press.un.org/en/2020/dsgsm1465.doc.htm [Accessed 2026 06 27 2023].
- UNIVERSITY OF SÃO PAULO. (2018). Growing CARROTS IN BRAZIL. POLY4.
- Wernet, G., Bauer, C., Steubing, B., Reinhard, J., Moreno-Ruiz, E., & Weidema, B. (2016). The ecoinvent database version 3 (part I): overview and methodology. The International Journal of Life Cycle Assessment, 21(9), 1218–1230. https://doi.org/10.1007/s11367-016-1087-8
- Willett, W., Rockström, J., Loken, B., Springmann, M., Lang, T., Vermeulen, S., Garnett, T., Tilman, D., DeClerck, F., Wood, A., Jonell, M., Clark, M., Gordon, L. J., Fanzo, J., Hawkes, C., Zurayk, R., Rivera, J. A., De Vries, W., Majele Sibanda, L., … Murray, C. J. L. (2019). Food in the anthropocene: the EAT-Lancet Commission on healthy diets from sustainable food systems. Lancet (London, England), 393(10170), 447–492. https://doi.org/10.1016/S0140-6736(18)31788-4
- Withanage, S. V.,Dias, G. M., &Habib, K. (2021). Review of household food waste quantification methods: Focus on composition analysis. Journal of Cleaner Production, 279, 123722 10.1016/j.jclepro.2020.123722