
 ?Mathematical formulae have been encoded as MathML and are displayed in this HTML version using MathJax in order to improve their display. Uncheck the box to turn MathJax off. This feature requires Javascript. Click on a formula to zoom.
Abstract
This study aimed to analyze the appropriateness of land in Tungi Farm based in Morogoro District, Tanzania for sunflower production using a Geographic Information System (GIS). To determine appropriate areas for sunflower production, three criteria: soil properties (pH, organic carbon, total nitrogen, cation exchange capacity, available phosphorus, potassium, and soil texture), topography (slope and altitude), and climate (temperature and rainfall) were selected from the literature and employed in suitability analysis. The Analytic Hierarchy Process (AHP) method of the Multi-Criteria Evaluation was used to assign a weight to each criterion as per Saaty’s Table. Cumulative weights for each criterion were used in coming up with output maps using ArcGIS 10.8. Each criterion was reclassified and assigned a weighted value. Organic carbon, total nitrogen, cation exchange capacity, and potassium were found to be adequate. Topography and climate were suitable for the sunflower production. The results from land suitability gave S1 (vastly suitable), S2 (relatively suitable), and S3 (minimally suitable) of about 51% (1022 ha), 34% (671 ha), and 15% (307 ha), respectively. The suitability map in this study could be vital and helpful in management decision options. However, the criteria considered for land suitability evaluation were mainly based on the biophysical environment, and, hence, further studies can be carried out by integrating socioeconomic parameters to improve the suitability results of the study area.
1. Introduction
Land evaluation is one of the important processes employed towards the reduction of human influence on natural resources’ degradation and in the identification of sustainable land use options (Nungula et al., Citation2023). Such kind of analysis allows decision-makers to implement the best land management strategies hence increasing land productivity by identifying the main limiting factors for the specified agricultural practice (Achoki & Gichaba, Citation2015; Alhammad et al., Citation2023; Seleiman et al., Citation2022). The information obtained through the land evaluation process guides decision-making on the best utilization of land resources by pinpointing the constraints and opportunities for specific land use (Kisaka et al., Citation2023). Therefore this process is a necessary prerequisite in the development of land use planning (Ritung et al., Citation2007; Verheye et al., Citation2020). Therefore, land evaluation is used as a long-term integrated approach that helps in achieving proper land use and reducing pressure and competition on the uses of the same land. Adaptation of land evaluation will ensure the availability of the soil information that provides a picture of the soil properties (physical and chemical) and ecological condition characteristics that assist the land users and farmers in achieving high land use efficiency, increasing food security, and alleviating poverty (Msanya et al., Citation2018; Otieno et al., Citation2023).
Globally, 3.2 billion poor people, as well as rural communities and smallholder farmers, are affected by land degradation (Alkharabsheh et al., Citation2023). As such, the world population is expected to rise to 9.7 billion by 2050, with rising demands for agricultural products (FAO, Citation2017). Particularly in Tanzania, 80% of the population resides in rural areas and depends on land resources for its livelihood (Nungula et al., Citation2023). Currently, it is estimated that more than 51% of land in rural areas is degraded due to human activities, which is mainly triggered by the lack of proper land management (Mugo et al., Citation2021; Nungula et al., Citation2024). This implies food insecurity because of the high demand for sustainable intensive cultivation and the opening up of new areas of land to satisfy the fast-growing population. Employing sustainable land management using Geographic Information Systems (GIS) technology as a land management tool is a major solution in the future. GIS can bring about various opportunities for improving agriculture production by utilizing various spatial data to increase productivity potentials and improve data access for decision-making (El Baroudy, Citation2016). GIS has been designed to efficiently capture, store, update, manipulate, and analyze forms of geographically referenced data that are needed to map the suitability of the land (Hamzeh et al., Citation2014; Nduwumuremyi et al., Citation2013). GIS offers a lot of benefits to land-use planners and land managers by combining with the multiple-criteria decision-making tools in integrating and managing multiple factors in making decisions and mapping the land for a certain use (Mwendwa et al., Citation2019; Torrieri & Batà, Citation2017). Such techniques offer a framework for achieving a sustainable land-use management practice (Maitra et al., Citation2023; Musakwa, Citation2018).
The analytical hierarchy process (AHP) method is the most commonly used multiple-criteria decision-making (MCDM) technique in GIS-based land evaluation assessment due to its efficiency in making decisions using heterogeneous factors ranked based on expert’s judgment (Mwendwa et al., Citation2019; Otieno et al., Citation2023; Qureshi et al., Citation2018; Torrieri & Batà, Citation2017). It enables the evaluation of group decisions and is used to choose the best alternative among the determined alternatives for a specific land use. A combination of GIS and AHP always decide on selecting acceptable and well-suitable locations for agriculture purpose (Sánchez-Lozano et al., Citation2013). According to Kihoro et al. (Citation2013), using a GIS-AHP is a powerful strategy for obtaining, researching, and assessing data and outcomes since a researcher may repair little mistakes more rapidly and obtain more accurate results. Nowadays, there is a considerable number of studies on-site suitability studies utilizing GIS-AHP integration, including site suitability assessment for cultivation and suitability analysis for various crops (Jamil et al., Citation2018; Kihoro et al., Citation2013), land management, and land-use suitability (Halder et al., Citation2020). GIS-AHP integration is beneficial since one can make informed decisions for planning and managing agricultural land in both complex and dynamic agricultural systems (Romeijn et al., Citation2016).
The edible oil subsector in Tanzania, particularly sunflower production, offers a lot of potential opportunities in improving livelihood, by producing valuable and highly needed oils with big domestic (internal) and external markets (Kihoro et al., Citation2013). It is approximated that there are about 4 million smallholder farmers cultivating sunflower in Tanzania (Chappa et al., Citation2023). The crop performs well in many regions across the country as it can withstand drought stress and is minimally affected by diseases. It grows well in semi-arid areas such as the central zone, which includes Dodoma, Tabora and Singida, and the southern coast area (Kimaro & Hieronimo, Citation2014).
Demand for edible oil continues to increase annually for both domestic consumption and industrial uses (FAO, Citation2017; Chappa, Citation2023). Among the edible oil crops, sunflower is the main source of edible oil in Tanzania, thus playing a central role in supply of edible oil (Kumar et al., Citation2019). Despite Tanzania having plenty of vast arable land and favourable agroecological zones, still, such opportunities have not been fully exploited for agricultural production due to the lack of soil information on the suitability of sunflower in different regions (Kimaro & Hieronimo, Citation2014). Literature suggests that land suitability evaluation and assessment could improve agricultural productivity and lead to food commodities’ self-sufficiency for countries that have a comparative advantage in agriculture commodities’ production like Tanzania (Chappa et al., Citation2023; Kimaro & Hieronimo, Citation2014). Thus, assessing sunflower suitability beyond the central region of Tanzania is long overdue and may help in improving productivity of edible oil production hence bridging the large edible oil deficit (Nungula, Citation2024).
Studies on land evaluation and suitability assessment for different crops were conducted in some parts of Tanzania which resulted in the development of information on the real distribution of soil (Kaaya et al., Citation1994; Kimaro & Hieronimo, Citation2014). Nevertheless, it is noteworthy to mention that such studies mainly focused on obtaining soil information and coming up with suitability maps without giving the same weight to other criteria such as topography, climate, and socioeconomic attributes levels which is essential for suitability assessment (Kimaro et al., Citation2001). In addition, the studies were traditionally based in that they paid much attention to empirical expert judgments with less focus on computer-based (GIS-based) land evaluation, which produces a database that can be used anywhere regardless of farm size (Kimaro et al., Citation2001; Msanya et al., Citation2018; Otieno et al., Citation2022). Therefore, this study focused on filling this gap by involving GIS-AHP computer-based land evaluation to determine the suitability of the Tungi Farm for sunflower production. It is expected that stakeholders will use the information from this study in recommending and advising farmers on areas best suited for sunflower production and the limitations that exist. This also forms a base for further research. In addition, the results obtained are useful in guiding stakeholders and the government in strategic planning for sustainable agriculture development. Mapping suitable areas for sunflower production is key in contributing to the production of sunflowers, and it aids in attaining maximum yields hence increasing the crop’s production potential. This will help address the demand for edible oil in the region.
2. Methodology
2.1. Study area description
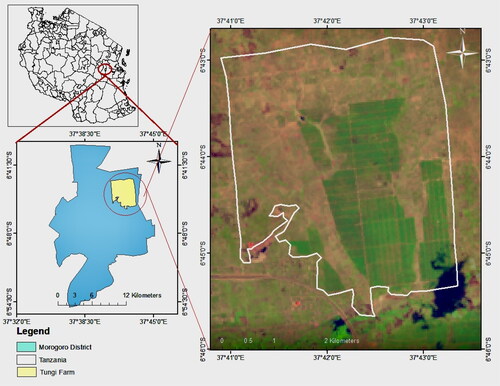
The study was conducted on Tungi Farm centered at latitude 6° 44’15” and longitude 37° 42’07” in Morogoro District, Tanzania (). The farm size is 2000 ha, under cultivation by smallholder farmers (particularly for maize). The area receives two rainfall seasons per year with the shorter and lighter season starting from November to January whereas the longer and heavier season runs from early March to May with high intensity in April (Kihoro et al., Citation2013). According to the data from the Tanzania Meteorological Agency (TMA) station in Morogoro, the annual average rainfall is 770 mm, and the annual mean temperature is 25.1 °C. The dominant texture of the areas is sandy to loam texture. The most common vegetation type on the farm is grass, bushes, shrubs, scattered woodlands, and lower forest cover. Agricultural production is the major socio-economic activity for which maize is the key crop grown in this area.
Figure 1. Study area map. Satelite picture source: https://earthexplorer.usgs.gov.
2.2. Soil survey and soil sampling
A reconnaissance survey was conducted to establish the location and broad landform features of the farm. GARMIN extrex 20 Global Positioning System (GPS) device was used to record landmark feature points and key leads to farm boundaries. A base map was established using a Digital Elevation Model (DEM) at 90 m spatial resolution extracted from the Google Earth Pro processed in a GPS visualizer and interpolated in ArcGIS 10.8 geostatistical software. Elevation (), Slope gradient (), and observable land properties including soil color, vegetation cover type, and land use type were recorded to differentiate the sampling units. In generating sampling units, areas showing the same properties were grouped as the same sampling unit where six sampling units were identified ().
Figure 2. Digital elevation model map.
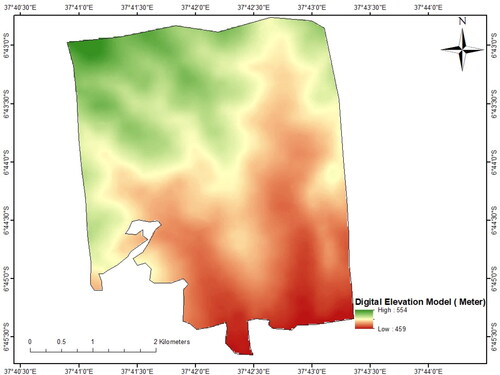
Figure 3. Slope map.
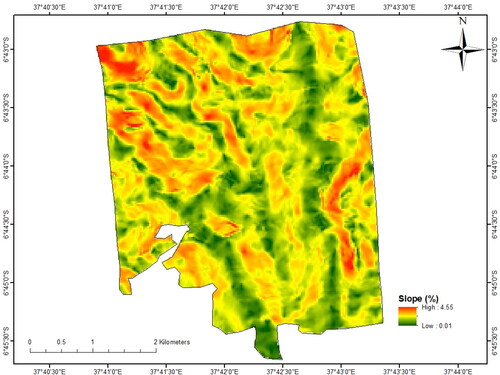
Figure 4. Soil sampling points in the six sampling units.
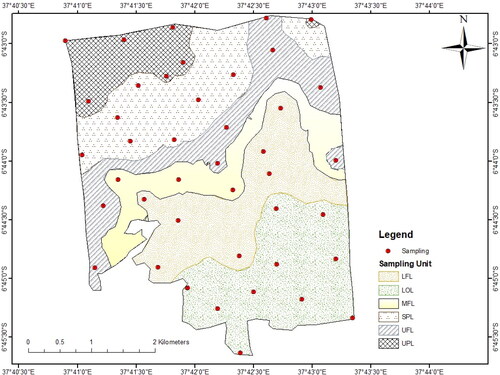
Soil sampling was performed using the zigzag method to collect composite samples from each mapping unit (). Using a quartile procedure, a composite soil sample of about 0.5 kg was obtained, packed in a ziplock bag to avoid leakages, labeled, and then taken to the soil laboratory at Kenyatta University, for analysis. The samples were processed, air-dried ground, and sieved using appropriate sieves ready for physical and chemical analyses. Soil properties analyzed were textural class, pH, TN, OC, Av. P, K, and CEC. A handheld GPS was used to mark the sampling points.
2.3. Laboratory analysis
Soil Texture class of the soil was determined following the Hydrometer method (Kalala et al., Citation2017). Soil pH was determined using a pH meter following a 1:2.5 ratio of soil/water (Ryan et al., Citation2001). The total nitrogen Kjeldahl digestion method was used for total nitrogen determination and Soil Organic Carbon (SOC) analysis was performed by the Walkley-Black method (Chappa et al., Citation2023; Nelson & Sommers, Citation1996). The Mehlich-3 method using ICP-OES was used for the extraction of phosphorus (Mehlich, Citation1978; Otieno et al., Citation2023). Available phosphorus was measured by UV–vis spectrophotometer. The Flame Photometry method was used for Exchangeable potassium (REF). Cation Exchange Capacity (CEC) was measured by the Ammonium acetate method (Chapman, Citation1965).
2.4. Ranking of identified criteria for growing sunflower
The Analytic Hierarchy Process (AHP) method of the Multi-Criteria Evaluation (MCE) was used in assigning the weights to the different criteria by employing a pair-wise preference matrix to compare one criterion to each other described by Saaty (Citation2014) (). Weight value represents the intensity of importance assigned to the chosen criteria implying the importance of one criterion to other criteria that are under consideration, in which the one with the highest weight is more important than others (Kumar et al., Citation2019).
Table 1. The Saaty’s rating scale.
The AHP was computed using the following mathematical model (EquationEquation 1(1)
(1) ).
(1)
(1)
Where A is the consistent matrix, having a set of n objects with weights w1, w2 ……wn (EquationEquation 1
(1)
(1) ). A consistent matrix is one in which for each entry aij (the entry in the ith row and jth column), aij = akj = aki. Note that the ratio in entry aij is the ratio of wi to wj (EquationEquation 2
(2)
(2) )
(2)
(2)
A reciprocal matrix is one in which for each entry aij, aji = 1/aij because all consistent matrices are reciprocal matrices (EquationEquation 3(3)
(3) )
(3)
(3)
Note that for a standard scale ratio matrix
(4)
(4)
The eigenvector corresponding to in this equation is essentially the underlying standard scale and thus gives the ranking of each element in the ratio matrix. The last step includes the eigenvalue estimation and matrix (A) creation which finalizes the vector W (EquationEquation 5
(5)
(5) )
(5)
(5)
Where A denoted the n × n matrix which also comprises (aij). W represents a nonzero eigenvector, 1 × n in size. The criteria weight was calculated from the pairwise comparison matrix undertaken and Eigen-vector values based on the formula below.
(6)
(6)
Consistency Ratio (CR) was calculated using (EquationEquation 7(7)
(7) ). During the judgment, the judgment matrix is only considered consistent if the ratio is < (0.1). A CR of 0.1 or less is more reasonable (Triantaphyllou & Mann, Citation1995).
(7)
(7)
where CI = Consistency Index; RI = Random Index.
The Consistency Index (CI) value was calculated using the eigenvalue ( value obtained in the AHP calculator and the number of criteria (n) in the AHP calculator using EquationEquation (8)
(8)
(8) and Random Index was simply obtained from Random Consistency Index table postulated by Saaty (Citation2014) ().
(8)
(8)
Table 2. Random consistency index (RCI).
2.5. Suitability level assessment
In assessing the suitability level of the Tungi Farm for sunflower production, the modified FAO framework was adopted for rating. Utilizing modified suitability criteria for sunflowers (FAO, Citation1976), land requirements were matched with the land qualities to assign each composite sample with the related scoring rate ().
Table 3. Land requirement for Sunflower production.
2.6. Reclassification
Reclassification was done by using produced raster maps for different soil properties and those raster maps were reclassified using ratings for sunflowers (Roy et al., Citation2006). The classification was very low, low, medium, and high with 1, 2, 3, and 4 as class values, respectively. For each soil mapping unit, soil characteristics were rated from 1 to 4 (). A higher value is assigned when the parameter is highly suitable and a low assigned value is when the parameter is low suitable. Equal numbers of class units were assigned to each parameter used.
Table 4. Sub-rating of the physical and chemical characteristics of the soils.
2.7. Production of sunflower suitability map
To come up with the suitability map of the area for sunflower production, sunflower crop requirements were matched with land qualities. This was followed by the integration of the reclassified layers for each parameter which are physical and chemical soil properties and topography as derived from weights produced by the AHP process with GIS. Weighted layers for each criterion were overlayed by employing the weighted overlay analysis using the raster calculator tool in the spatial analysis tool extension of ArcGIS 10.8 using the (EquationEquation 9(9)
(9) ) as described by Tashayo et al. (2020).
(9)
(9)
where S = Suitability score; Wi = Weight of the ith criteria; Xi = Weight of the ith sub-criterian; = Total number of criteria
The overall suitability map for sunflower production was classified as; vastly suitable soil (S1), relatively suitable soil (S2) minimally suitable soil (S3), and Currently unsuitable soil (N) with 4, 3, 2, and 1 as the value, respectively (). Overall the study followed a systematic workflow from the acquisition of necessary data for sunflower production, followed by a series of interconnected steps that included field activities and laboratory analysis, and finally drawing of suitability maps ().
Figure 5. Methodology workflow for the production of suitability map.
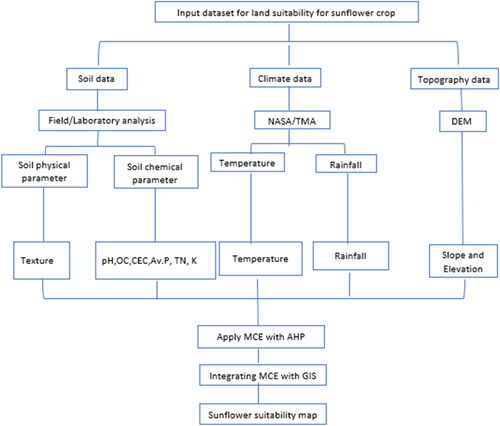
Figure 6. pH Suitability map for sunflower production of Tungi Farm.
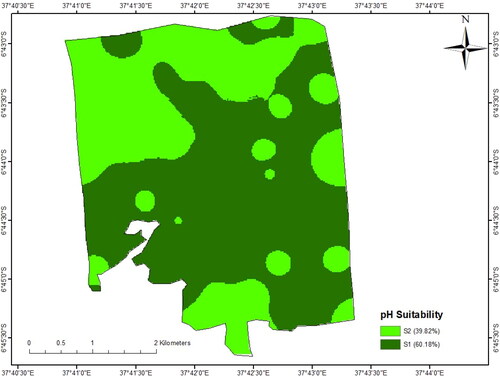
Table 5. Suitability classes.
3. Results and discussion
3.1. Ranking of criteria for sunflower production
The comparison decision matrix reveals that soil properties outweighed climate and topography in sunflower production (). The assigned values of 1 and 2 imply that criteria are considered to be equal to each other and with much more importance with score values of 3 and 5 when compared in pair-wise preference (). During the ranking, CR for soil was 0.032 and 0 for climate and topography, respectively, implying that the judgment was justifiable for sunflower production since in all criteria CR < 0.1.
Table 6. Pairwise comparison matrix for sunflower production.
Weighting criteria for sunflower shows that soil criterion was ranked first, scoring 0.62, then soil, and climate at 0.29 and the lowest priority was for topography with a score of 0.09 (). Soil criterion ranked first among other criteria for growing sunflower as it provides essential nutrient and create a conducive setting for the growth, development, and productivity of sunflower. Soil chemicals including pH, OC, TN, Av. P, K, CEC, and soil texture are important due to their limiting habit in sunflower production accompanied by continuous cultivation without adding fertilizer, which decreases the production potential of the land (Chikuvire et al., Citation2007). Weighting soil sub-criteria for sunflower production, the pH received a high weight of 0.27 as considered a main indicator for suitability requirement for sunflower production followed by OC which scored 0.021 due to their importance in influencing soil chemical and physical properties. Soil texture also received a low weight score of 0.06 among the group criteria, however, soil texture is an important factor in growing sunflower since it strongly influences the water-retaining capacity of soil and nutrient retention (Chappa et al., Citation2023; Li & Heap, Citation2008).
Soil texture can also affect crop production when the soil does not strongly hold water and nutrients for a long time (). Climate criteria including temperature and rainfall also influence sunflower production. Temperature received a weight of 0.75 compared with rainfall with a weight of 0.25, an indication that sunflower does not need a lot of rainfall, but rather adequate temperature to mature and hence they perform well in semiarid areas due to their ability to withstand drought. Topography criteria in the studied area had a low influence on sunflower production compared to soil and climate where it received a weight of 0.09. In topography, the slope receives a high weight of 0.75 () as it influences sunflower production due to the occurrence of water erosion during the rainy season in the sloping area causing nutrient depletion and crop damage in the study area and reduced production. Therefore, flat land is better than the sloping land.
Table 7. Main Criteria ranking for sunflower production.
Table 8. Summary of parameter, suitability level, and area coverage for sunflower production.
3.2. Soil suitability
Soil pH is an indicator of the level of acidity and alkalinity status of the soil. Soil pH highly influences the availability of nutrients in the soil and its uptake by plants and also provides prior information about suitability for crop production in a particular area (Mugo et al., Citation2016). In the current study, soil pH values of the area ranged from moderately acidic (5.5) to neutral (7.2) with a mean pH value of 6.3 (Slightly acidic). Suitability analysis of soil pH for sunflower production shows that 60.2% was vastly suitable (S1) and 39.8% relatively suitable (S2) with 1204 ha and 796 ha of the farm, respectively ( and ).
Soil Organic Carbon plays a vital role in the soil by controlling the infiltration rates, water holding capacity, and improving soil aggregate buildup (Nyawade et al., Citation2019a). OC acts as a bank to store nutrients and slowly release them to the plants but also supply nutrients and energy to the soil microbes (Zdruli et al., Citation2004). It is also one of the most important considerations in determining the best-suited land for agricultural purposes (Kalala et al., 2017). Soil organic carbon (OC) of Tungi Farm varied from low (1.2 g kg−1), to medium (4.9 g kg−1) with an average of 3.5 g kg−1 rated as medium. Suitability analysis of OC of Tungi Farm for sunflower production shows that 97.5% was vastly suitable (S1) and 2.5% relatively suitable (S2) with coverage of 1950 ha and 49 ha of the farm, respectively ( and ).
Figure 7. Organic Carbon (OC) suitability map for sunflower production of Tungi Farm.
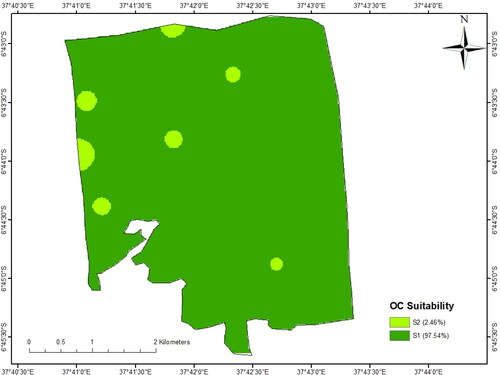
Figure 8. Total Nitrogen (TN) suitability map for sunflower production of Tungi Farm.
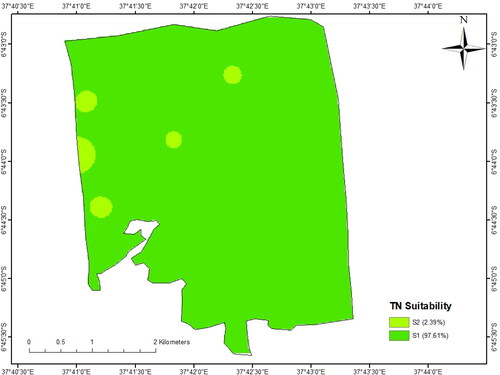
Total nitrogen (TN) ranged from low (1.0 g kg−1), to medium (5.0 g kg−1) with an average of 3.5 g kg−1 rated as medium. The lower levels of nitrogen as revealed in this study imply that there has been poor fertilization due to inadequate fertilizer addition to replace the N lost due to humus losses linked with frequent cultivation, crop harvest removal, and leaching by water (Hailu et al., Citation2015; Nyawade et al., Citation2019b; Shao et al., Citation2023). Suitability analysis based on the total nitrogen of Tungi Farm for sunflower production shows that 97.6% and 2.4% are vastly suitable (S1) and relatively suitable, respectively with respective area coverage of 1952 ha and 48 ha ().
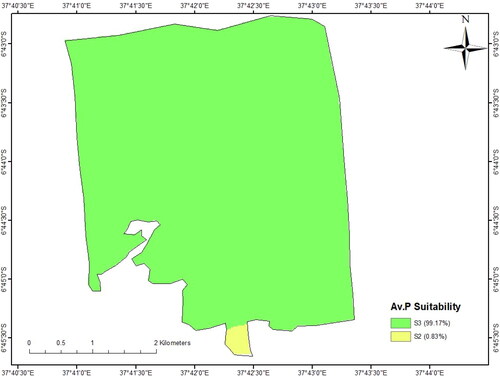
Available phosphorus for the area ranged from low (3.34 mg kg−1), to medium (14.34 mg kg−1) with a mean value of 6.28 mg kg−1, rated as low (Marx et al., Citation1999). Suitability analysis of available phosphorus of Tungi Farm for sunflower production shows that 0.83% was relatively suitable (S2) and 99.17% was minimally suitable (S3) with farm area coverage of 16.6 ha and 1983.4 ha, respectively ( and ).
Figure 9. Available phosphorus suitability map for sunflower production of Tungi Farm.
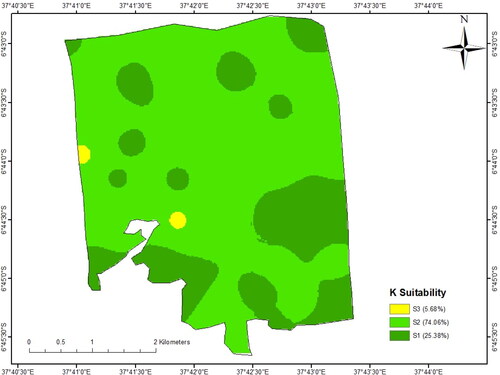
Potassium values ranged from low (0.14 cmol kg−1) to medium (0.84 cmol kg−1), with an average of 0.44 cmol kg−1 (Marx et al., Citation1999). Suitability analysis of Potassium shows that 25.38%, 74.06%, and 5.68% of the Tungi Farm was vastly suitable (S1), relatively suitable (S2), and minimally suitable (S3) with respective farm coverage areas of 507.51, 1481.13, and 11.36 ha, respectively ( and ).
Figure 10. Potassium suitability map for sunflower production of Tungi Farm.
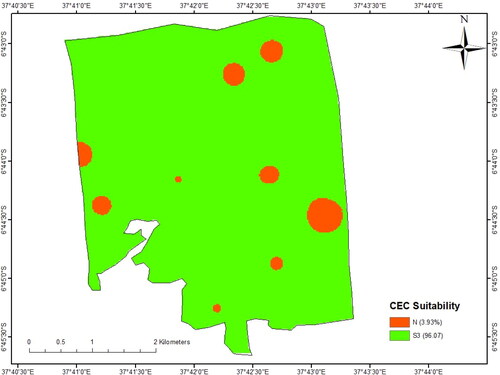
Cation Exchange Capacity measures the ability of the soil to hold nutrients, hence providing information on soil fertility and production potential of the land (Heydarzadeh et al., Citation2023; Kalala et al., Citation2017). Soil with low CEC soil implies low organic matter content which also shows the low water-holding capacity. This calls for supplemental addition of more organic fertilizers (Faridvand et al., Citation2021; Heydarzadeh et al., Citation2023; Nduwimana et al., Citation2020). The CEC value of Tungi Farm ranged from 5.13 to 8.29 cmol kg−1 rated as low with an average value of 6.67 cmol kg−1 (Marx et al., Citation1999). Suitability analysis of CEC of Tungi Farm for sunflower production shows that 3.9% was minimally suitable (S3) and 96.1% Currently not suitable (N) with the farm area coverage of 78.6 and 1921.4 ha ( and ).
Figure 11. CEC suitability map for sunflower production of Tungi Farm.
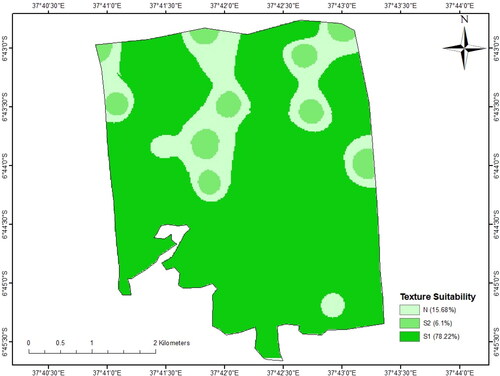
Soil texture is a vital soil physical property with great influence on soil structure, water holding capacity, infiltration, and porosity (AbdelRahman et al., Citation2017; Elsheikh et al., Citation2013; Gitari et al., Citation2019). Soil texture influences soil pH, EC, soil mineral composition, and microbial population (Bhunia et al., Citation2016). Generally, texture ranged from sandy clay to sand texture class at Tungi Farm. According to Brady and Weil (Citation2017) and Saglam and Dengiz (Citation2014), the observed soil textures support sunflower production by allowing root movement, aeration, water infiltration, and better drainage. Suitability based on soil texture shows that 78, 6 and 16% of the area was vastly suitable (S1) (1564 ha), relatively suitable (S2) (122 ha), and currently not suitable (N) (314 ha), respectively ( and ).
Figure 12. Texture suitability map for sunflower production of Tungi Farm.
3.3. Topography suitability
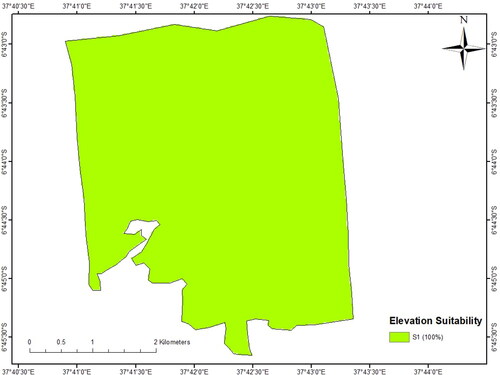
The Digital Elevation Model result shows variations in altitude with differences in elevation ranges. The information in DEM showed an elevation range from 523 to 550 masl. Suitability based on elevation shows that 100% of the area was vastly suitable (S1) (2000 ha) ( and ).
Figure 13. Elevation suitability map for sunflower production of Tungi Farm.
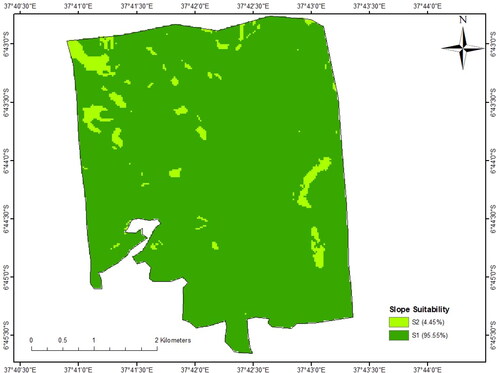
The slope of an area greatly influences soil erosion intensity and is one of the factors to pay attention to in the determination of suitable areas for sunflower (Moges & Ajanaw, Citation2020; Nyawade et al., Citation2019a). Digital Elevation Model results showed variations in slope with differences in ranges ranging from 0 to 1.5%, 1.5 to 2.4%, 2.4 to 3.3%, and 3.3 to 4.5%. Suitability based on slope shows that 95.6 and 4.5% of the area were vastly suitable (S1) (1911 ha) and relatively suitable (S2) (89 ha), respectively ( and ).
Figure 14. Slope suitability map for sunflower production of Tungi Farm.
3.3. Climate suitability
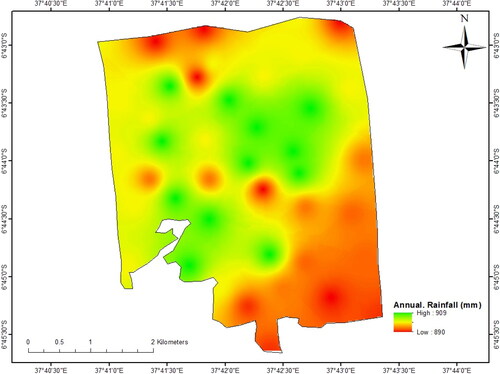
Based on the amount and length of rainfall, sunflower water requirement varies from 600 to 1000 mm per year. Water use for any crop is dependent on the growth stage, with 20% of water being utilized during the vegetative period, 55% in the flowering stage, and 25% in the yield formation and ripening periods (Andrew et al., Citation2013; Goher et al., Citation2023; Ochieng’ et al., Citation2023). Based on Egeru (Citation2012) medium to good pattern of about 600 to 1000 mm per year during the growing season is appropriate for sunflower production. This implies that the area received adequate rainfall since the rainfall at the Tungi Farm ranges from 890 to 909 mm. Therefore, the farm was considered vastly suitable (S1) for sunflower production despite rainfall being not fairly stable ( and ).
Figure 15. Rainfall suitability map for sunflower production of Tungi Farm.
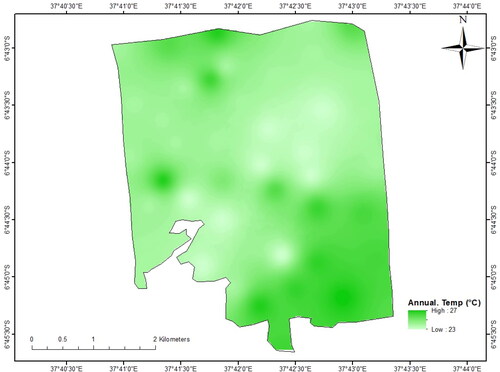
Based on Hollinger and Angel (Citation2009), the temperature is an important parameter that governs when and how fast a crop will grow and develop in line with precipitation and solar radiation. Sunflower is described as a short-day plant with direct-acting to daylight length. It survives under different climate conditions including arid areas (though under irrigation) to semi-arid or temperate conditions. Sunflower crop does not withstand frost conditions, and therefore it thrives well at mean temperatures ranging between 18 °C and 25 °C (Andrew et al., Citation2013; Chappa et al., Citation2022). Reclassification of the temperature shows that the whole area was vastly suitable (S1) for sunflower production since it has an average temperature of 25 °C ( and ).
Figure 16. Temperature suitability map for sunflower production of Tungi Farm.
3.4. Sunflower suitability map
Based on the selected properties for evaluation of sunflower production suitability climate (temperature and rainfall), soil chemical properties (OC, pH, CEC, TN, Av. P, and K), Soil texture, and topography (slope and elevation) were overlaid to generate a sunflower suitability map (). The results from land suitability gave S1 (vastly suitable), S2 (relatively suitable), and S3 (minimally suitable) of about 51% (1022 ha), 34% (671 ha), and 15% (307 ha), respectively (). The results indicated that most cultivated soils are insufficient in TN and available P resulting from continuous cultivation without fertilizer supplements, crop residue removal, and intensive cultivation (Emiru & Gebrekidan, Citation2013; Mwadalu et al., Citation2022; Rahimi et al., Citation2023). Therefore, in achieving high economic agricultural production the integrated approach which involves agriculture extension, researchers, land-use planners, and farmers’ communities is needed in allocating the right area for sunflower production.
Figure 17. Sunflower suitability map for Tungi Farm.
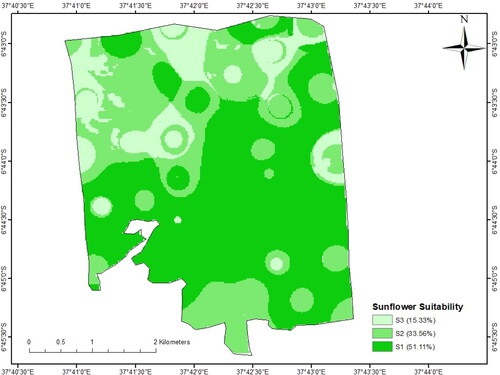
Table 9. Suitability and area coverage of Tungi Farm for sunflower production.
4. Discussion
Sunflowers are mainly cultivated in some regions of Tanzania. Due to its low production, there is a high annual demand for edible oil in Tanzania of more than 500,000 tons. This demand continues to increase at a rate of 3% annually due to population growth given that only 40% of edible oil is produced by local processors, which does not meet the national cooking oil requirements (Nungula et al., Citation2023). Thus this call for expansion of production land due to the potential benefit of sunflowers. This research was done to evaluate the land’s suitability for growing sunflowers in the study region by considering the multiple factors that affect its growth. The study employed the GIS-AHP technique to simplify the work that could rather be done manually, a very tedious exercise.
Land suitability involves the identification of the most suitable land for raising crops to sustain the increasing population and demand for more food production (Maitra et al., Citation2023). The AHP technique is an extensive tool where efficient and effective land suitability analysis can be performed. The AHP approach allows the users to assign the weights score to various parameters and compute their consistency. GIS is a modern tool that is used to create and manage a complete land suitability analysis through mapping techniques (Nungula et al., Citation2023; Otieno, Citation2021). Integration of the GIS-AHP approach allows the users to judge the right weightage for the various parameters during the land suitability analysis. Use of such integration techniques in performing land suitability analysis enhances the achievements of precision agriculture.
Adoption of GIS-AHP by involving the different biophysical variables provides the best conditions for crop suitability management. The study involved multiple parameters, by evaluating the biophysical parameters including soil, climate, and topography. Employing this method enhances effectiveness of crop management on the farm because it provides a biophysical examination that allows farmers to select and adopt efficient crop and soil management strategies to achieve high yields. Also, will help the farmers and extensions to develop effective fertilizer application strategies to improve the performance of crops and achieve high yields.
In line with the DEM map showing elevation differences in the study area, the result indicate that the area has variations in altitude, which differ in elevation ranges. Based on elevation characteristics and slope, the area was classified into six topographic landforms; upper land, lower flat land, medium flat land, flat land, slopping land, and low land. The areas featured a slightly plain area, characterized by soil organic matter of 2 g kg−1, pH ranging from 6.0 to 6.5, loamy to sandy loam texture class, and favorable levels of N, P, K with optimum average temperatures of between 25 and 30 °C, which is considered the ideal range for the crop. This area shows a high suitability level of 51% (1022 ha) for sunflower when the three criteria (soil, climate, and topography) were integrated in ArcGIS. Additionally, the suitability analysis revealed that 34% (671 ha) and 15% (307 ha) of the land had relatively and minimally suitable land characterized by sloping land, pH ranges of 5.5 to 6.0, and deficiency in available phosphorus and potassium due to leaching and nutrient washing by rainwater.
The findings of the study provide recommendations to achieve high land productivity by ensuring regular soil analysis is vital to monitor the amount of accessible nutrients in the soil at time and space so that management practices can be done at the right time, right amount, and at the right place. This study involved a qualitative use of soil-analyzed data; therefore more studies are necessary based on quantitative terms of soil suitability. Also based on the study findings, farmers will be able to use the detailed information in deciding on cultivating sunflower in the Farm as it’s a potential crop for them to earn more income while maintaining soil quality. Use of the GIS-AHP integration approach was recommended by involving multiple criteria to make the best decisions according to the selected criteria. The criteria may reveal the decision based on real field conditions. The study was conducted to provide an extensive analysis by involving various factors that affect sunflower growth and production in the study area. More so, the sub-criteria were validated as an important condition that may be used in the planning of agricultural production.
5. Conclusion
Land suitability is an attempt to include all possible parameters having an impact on crop growth and vegetation, particularly for sunflower production. The Analytical Hierarchy Process (AHP)-based model was employed to assign weightage to sub-criteria parameters and main criteria for carrying out the final land suitability analysis. Based on this analysis, crop suitability distribution maps were developed for sunflower production in the ArcGIS software environment. The farm gave about 51% (1022.2 ha) S1 (vastly suitable) implying that the farm is suitable for sunflower production. However, some area shows relative suitability and minimally suitability due to the observed low levels of some nutrients (K and Av. P). To achieve high land productivity, the soil’s nutrient management ought to involve the use of integrated approaches such as the application of inorganic (synthetic fertilizer) including P and K fertilizers. AHP is a superior method of determining the weights of multiple factors and its consistency may be measured and controlled in the presence of interfering criteria. On the other hand, GIS is a powerful tool used to demarcate the study area, collect and process geographic data, and present results in land suitability analysis. Integration of GIS-AHP provides a precise and powerful combination for land suitability analysis because the results obtained provide effective management approaches to ensure land use efficiency and better management for sunflower production in Tungi Farm.
Disclosure statement
No potential conflict of interest was reported by the author(s).
Additional information
Funding
Notes on contributors
Emmanuely Z. Nungula
Emmanuely Nungula is an MSc student with a passionate research interest in GIS, soil fertility management, and land use planning. Jayne Mugwe and Harun Gitari are dedicated lecturers at Kenyatta University with expertise in Integrated Soil Fertility Management. Boniface Massawe is a GIS and pedologist specialist based at Sokoine University of Agriculture, Tanzania. Mahmoud Seleiman is an agronomist from King Saud University, Saudi Arabia, whereas Nawab Ali is a Biosystems Engineer based at Michigan State University USA.
References
- AbdelRahman, M. A. E., Shalaby, A., Aboelsoud, M. H., & Moghanm, F. S. (2017). GIS spatial model based for determining actual land degradation status in Kafr El-Sheikh Governorate, North Nile Delta. Modeling Earth Systems and Environment, 4(1), 1–22. https://doi.org/10.1007/s40808-017-0403-z
- Achoki, D. O., & Gichaba, C. M. (2015). Geographic information systems and remote sensing for food security in. Department of Geology; University of Nairobi.
- Alhammad, B. A., Roy, D. K., Ranjan, S., Padhan, S. R., Sow, S., Nath, D., Seleiman, M. F., & Gitari, H. (2023). Conservation tillage and weed management influencing weed dynamics, crop performance, soil properties, and profitability in rice-wheat-greengram system in Eastern Indo-Gangetic Plains. Agronomy, 13(7), 1953. https://doi.org/10.3390/agronomy13071953
- Alkharabsheh, H. M., Mwadalu, R., Mochoge, B., Danga, B., Raza, M. A., Seleiman, M. F., Khan, N., & Gitari, H. (2023). Revitalizing the biochemical soil properties of degraded coastal soil using Prosopis juliflora biochar. Life (Basel, Switzerland), 13(10), 2098. https://doi.org/10.3390/life13102098
- Andrew, R. L., Kane, N. C., Baute, G. J., Grassa, C. J., & Rieseberg, L. H. (2013). Recent nonhybrid origin of sunflower ecotypes in a novel habitat. Molecular Ecology, 22(3), 799–813. https://doi.org/10.1111/mec.12038
- Bhunia, A., Esquivel, D., Dey, S., Fernández-Terán, R., Goto, Y., Inagaki, S., Van Der Voort, P., & Janiak, C. (2016). A photoluminescent covalent triazine framework: CO2 adsorption, light-driven hydrogen evolution, and sensing of nitroaromatics. Journal of Materials Chemistry A, 4(35), 13450–13457. https://doi.org/10.1039/C6TA04623A
- Brady, N. C., & Weil, R. R. (2017). The nature and properties of soil. 15th ed. Pearson Education. 1104.
- Bremner, J. M. (1996). Nitrogen total. In Sparks, D.L., Page, A.L., Helmke, P.A., Loeppert, R.H., Soltanpour, P.N., Tabatabai, M.A., Johnston, C.T., & Sumner, M.E. (Eds.). Methods of soil analysis, Part 3: Chemical methods. Soil Science Society for America Journals. Inc (pp. 1085–1121). American Society of Agronomy.
- Chapman, H. (1965). Cation-exchange capacity 1. In A. G. Norman (Ed.), Methods of soil analysis. Part 2. Chemical and microbiological properties (pp.891–901).
- Chappa, L. P. (2023). Soil chemical properties and sunflower (Helianthus annuus L) productivity responses to sunn Hemp intercropping and mineral fertilizer application in Dodoma, Tanzania [MSc Thesis]. Kenyatta University.
- Chappa, L. R., Mugwe, J., Gitari, H. H., & Maitra, S. (2023). Upholding sunflower (Helianthus annuus) yield and profitability while maintaining soil fertility under intercropping with sunn hemp and mineral fertilizer application. International Journal of Bioresource Science, 10(1), 31–49. https://doi.org/10.30954/10.30954/2347-9655.01.2023.4
- Chappa, L. R., Mugwe, J., Maitra, S., & Gitari, H. I. (2022). Current status and prospects of improving Sunflower production in Tanzania through intercropping with Sunn Hemp. International Journal of Bioresource Science, 9(1), 1–8. https://doi.org/10.30954/2347-9655.01.2022.1
- Chikuvire, T. J., Mpepereki, S., & Foti, R. (2007). Soil fertility variability in sandy soils and implications for nutrient management by smallholder farmers in Zimbabwe. Journal of Sustainable Agriculture, 30(2), 69–87. https://doi.org/10.1300/J064v30n02_08
- Egeru, A. (2012). Water productivity in agriculture: challenges and opportunities for smallholder farmers in the drylands of Eastern and Southern Africa. Makerere University Department of Environmental Management (pp. 1).
- El Baroudy, A. (2016). Mapping and evaluating land suitability using a GIS-based model. CATENA, 140, 96–104. https://doi.org/10.1016/j.catena.2015.12.010
- Elsheikh, R., Shariff, A. R. B. M., Amiri, F., Ahmad, N. B., Balasundram, S. K., & Soom, M. A. M. (2013). Agriculture Land Suitability Evaluator (ALSE): A decision and planning support tool for tropical and subtropical crops. Computers and Electronics in Agriculture, 93, 98–110. https://doi.org/10.1016/j.compag.2013.02.003
- Emiru, N., & Gebrekidan, H. (2013). Effect of land-use changes and soil depth on soil organic matter, total nitrogen and available phosphorus contents of soils in Senbat Watershed, Western Ethiopia. ARPN Journal of Agricultural and Biological Science, 8, 206–2012.
- FAO- Food and Agriculture Organization. (1976). A framework for land evaluation: Soils Bulletin 32, Food and Agriculture Organization of the United Nations.
- FAO- Food and Agriculture Organization. (2017). Regional Overview of Food Insecurity and Nutrition: The Food Security and Nutrition-Conflict Nexus: Building Resilience for Food Security, Nutrition and Peace. Food and Agriculture Organization of the United Nations.
- Faridvand, S., Rezaei-Chiyaneh, E., Battaglia, M., Gitari, H., Raza, M. A., & Siddique, K. H. M. (2021). Application of bio and chemical fertilizers improves yield, and essential oil quantity and quality of Moldavian balm (Dracocephalum moldavica L.) intercropped with mung bean (Vigna radiata L. Food and Energy Security, 11(2), e319.) https://doi.org/10.1002/fes3.319
- Gitari, H. I., Gachene, C. K. K., Karanja, N. N., Kamau, S., Nyawade, S., & Schulte-Geldermann, E. (2019). Potato-legume intercropping on a sloping terrain and its effects on soil physico-chemical properties. Plant and Soil, 438(1-2), 447–460. https://doi.org/10.1007/s11104-019-04036-7
- Goher, R., Alkharabsheh, H. M., Seleiman, M. F., Diatta, A. A., Gitari, H., Wasonga, D. O., Khan, G. R., & Akmal, M. (2023). Impacts of heat shock on productivity and quality of Triticum aestivum L. at different growth stages. Notulae Botanicae Horti Agrobotanici Cluj-Napoca, 51(1), 13090. https://doi.org/10.15835/nbha51113090
- Hailu, A. H., Kibret, K., & Gebrekidan, H. (2015). Characterization and classification of soils of Kabe Subwatershed in South Wollo Zone, Northeastern Ethiopia. African Journal of Soil Science, 3(7), 134–146.
- Halder, B., Bandyopadhyay, J., & Banik, P. (2020). Assessment of hospital sites’ suitability by spatial information technologies using AHP and GIS-based multi-criteria approach of rajpur–sonarpur municipality. Modeling Earth Systems and Environment, 6(4), 2581–2596. https://doi.org/10.1007/s40808-020-00852-4
- Hamzeh, S., Mokarram, M., & Alavipanah, S. K. (2014). Combination of Fuzzy and AHP methods to assess land suitability for barley: Case study of semi-arid lands in the southwest of Iran. Desert, 19, 173–181. https://doi.org/10.22059/JDESERT.2014.52346
- Heydarzadeh, S., Arena, C., Vitale, E., Rahimi, A., Mirzapour, M., Nasar, J., Kisaka, O., Sow, S., Ranjan, S., & Gitari, H. (2023). Impact of different fertilizer sources under supplemental irrigation and rain-fed conditions on eco-physiological responses and yield characteristics of dragon’s head (Lallemantia iberica). Plants (Basel, Switzerland), 12(8), 1693. https://doi.org/10.3390/plants12081693
- Hollinger, S. E., & Angel, J. R. (2009). Weather and crops. In Illinois Agronomy Handbook (Emerson N) (pp. 11–12).
- Jamil, M., Sahana, M., & Sajjad, H. (2018). Crop suitability analysis in the Bijnor district, UP, using geospatial tools and fuzzy analytical hierarchy process. Agricultural Research, 7(4), 506–522. https://doi.org/10.1007/s40003-018-0335-5
- Kaaya, A. K., Msanya, B. M., & Mrema, J. P. (1994). Soils and land evaluation of part of the Sokoine University of Agriculture farm (Tanzania) for some crops under rainfed conditions. African Study Monographs, 15(2), 97–117.
- Kalala, A. M., Msanya, B. M., Amuri, N. A., & Semoka, J. M. (2017). Pedological characterization of some typical alluvial soils of Kilombero District, Tanzania. American Journal of Agriculture and Forestry, 5(1), 1–11.
- Kihoro, J., Bosco, N., & Murage, H. (2013). Suitability analysis for rice growing sites using a multi-criteria evaluation and GIS approach in great Mwea region, Kenya. International Journal of Science & Emerging Technologies, 2(1), 12–20. https://doi.org/10.1186/2193-1801-2-265
- Kimaro, D. N., Msanya, B. M., Mwango, S. B., Kimbi, G. G., & Kileo, E. P. (2001). Land suitability evaluation for the production of the major crops in the Southwestern part of the Uluguru Mountains, Morogoro Rural District, Tanzania. Soils and Land Resources of Morogoro Rural and Urban Districts, 2,
- Kimaro, D., & Hieronimo, P. (2014). Land for agriculture in Tanzania: Challenges and opportunities. Journal of Land and Society, 1(1), 91–102.
- Kisaka, M.,O., Shisanya, C., Cournac, L., Manlay, J. R., Gitari, H., & Muriuki, J. (2023). Integrating no-tillage with agroforestry augments soil quality indicators in Kenya’s dry-land agroecosystems. Soil and Tillage Research, 227, 105586. https://doi.org/10.1016/j.still.2022.105586
- Kumar, E. S., Mandal, T. K., Mishra, G. C., Barman, S., & Maitra, S. (2019). Effect of intercropping summer sunflower (Helianthus annuus L.) with legumes on yield attributes and productivity of crops. International Journal of Agriculture Environment and Biotechnology, 12(3), 281–285.
- Li, J., & Heap, A. D. (2008). A review of spatial interpolation methods for environmental scientists (pp. 137). Geoscience Australia. Record 2008/23.
- Maitra, S., Sahoo, U., Sairam, M., Gitari, H., Rezaei-Chiyaneh, E., Battaglia, L., & Hossain, A. (2023). Cultivating sustainability: A comprehensive review on intercropping in a changing climate. Research on Crops, 24(4), 702–715. https://doi.org/10.31830/2348-7542.2023.ROC-1020
- Marx, E., Hart, J., & Stevens, R. (1999). Soil test interpretation guide. Oregon State University Extension Service.
- Mehlich, A. (1978). New extractant for soil test evaluation of phosphorus, potassium, magnesium, calcium, sodium, manganese, and zinc. Compiled soil science. Plant Anal Analyses, 9(6), 477–492. https://doi.org/10.1080/00103627809366824
- Moges, T., & Ajanaw, N. (2020). Land suitability evaluation for sorghum crop by using GIS and AHP techniques in Agamsa sub-watershed, Ethiopia. Cogent Food & Agriculture, 6, 1743624.
- Msanya, B. M., Mwasyika, T. A., Amuri, N., Semu, E., & Mhoro, L. (2018). Pedological characterization of typical soils of Dodoma Capital City District, Tanzania: Soil morphology, physico-chemical properties, classification, and soil fertility trends. Annals of Advanced Agricultural Sciences, 2(4). https://doi.org/10.22606/as.2018.24002
- Mugo, J. W., Kariuki, P. C., & Musembi, D. K. (2016). Identification of suitable land for green gram production using GIS-based analytical hierarchy process in Kitui County, Kenya. Journal of Remote Sensing and GIS, 5, 3. https://doi.org/10.4172/2469-4134.1000170
- Mugo, J., Karanja, N., Gachene, C., Dittert, K., Nyawade, S., & Schulte-Geldermann, E. (2021). Assessment of soil fertility and potato crop nutrient status in central and eastern highlands of Kenya. Scientific Report, 10, 1–11. https://doi.org/10.1038/s41598-020-64036-x
- Musakwa, W. (2018). Identifying land suitable for agricultural land reform using GIS-MCDA in South Africa. Environment, Development and Sustainability, 20(5), 2281–2299. https://doi.org/10.1007/s10668-017-9989-6
- Mwadalu, R., Mochoge, B., Mwangi, M., Maitra, S., & Gitari, H. (2022). Response of Gadam sorghum (Sorghum bicolor) to farmyard manure and inorganic fertilizer application. International Journal of Agriculture, Environment, and Biotechnology, 15(1), 51–60. https://doi.org/10.30954/0974-1712.01.2022.6
- Mwendwa, S. M., Mbuvi, J. P., & Kironchi, G. (2019). Land evaluation for crop production in upper kabete campus field, University of Nairobi, Kenya. Chemical and Biological Technologies in Agriculture, 6(1), 1–10. https://doi.org/10.1186/s40538-019-0156-1
- Nduwimana, D., Mochoge, B., Danga, B., Masso, C., Maitra, S., & Gitari, H. (2020). Optimizing nitrogen use efficiency and maize yield under varying fertilizer rates in Kenya. International Journal of Bioresource Science, 7(2), 63–73. https://doi.org/10.30954/2347-9655.02.2020.4
- Nduwumuremyi, A., Mugwe, N. J., Rusanganwa, C. A., & Mupenzi, J. (2013). Mapping of limestone deposits and determination of the quality of locally available limestone in Rwanda. Journal of Soil Science and Environmental Management, 4(5), 87–92.
- Nelson, D. W., & Sommers, L. E. (1996). Total carbon, organic carbon, and organic matter. In Sparks, D.L., Page, A. L., Helmke, P. A., Loeppert, R. H., Soltanpour, P. N., Tabatabai, M.A., Johnston, C. T., Sumner, M. E (Eds.), Methods of SOIL ANALYSIS, Part 3: Chemical Methods. Soil Science Society of America Journa (pp. 961–1010).
- Nungula, E. Z. (2024). Geographic Information System-based land evaluation and suitability assessment for sunflower (Helianthus annus) production in Morogoro District, Tanzania [MSc Thesis]. Kenyatta University.
- Nungula, E. Z., Mugwe, J., Massawe, B. H. J., & Gitari, H. I. (2024). Morphological, pedological and chemical characterization and classification of soils in Morogoro District., Agricultural Research. In press.
- Nungula, E. Z., Mugwe, J., Nasar, J., Massawe, H. J., Karuma, A. N., Maitra, S., Seleiman, M. F., Dindaroglu, T., Khan, N., & Gitari, H. I. (2023). Land degradation unmasked as the key constraint in sunflower (Helianthus annus) production: Role of GIS in revitalizing this vital sector. Cogent Food & Agriculture, 9(2), 2267863. https://doi.org/10.1080/23311932.2023.2267863
- Nyawade, S. O., Gachene, C. K. K., Karanja, N. N., Gitari, H. I., Schulte-Geldermann, E., & Parker, M. (2019a). Controlling soil erosion in smallholder potato farming systems using legume intercrops. Geoderma Regional, 17, e00225. https://doi.org/10.1016/j.geodrs.2019.e00225
- Nyawade, S. O., Karanja, N. N., Gachene, C. K. K., Gitari, H. I., Schulte-Geldermann, E., & Parker, M. L. (2019b). Short-term dynamics of soil organic matter fractions and microbial activity in smallholder legume intercropping systems. Applied Soil Ecology, 142, 123–135. https://doi.org/10.1016/j.apsoil.2019.04.015
- Ochieng’, I. O., Ranjan, S., Seleiman, M. F., Padhan, S. R., Psiwa, R., Sow, S., Wasonga, D. O., & Gitari, H. I. (2023). Increasing rainwater use efficiency, gross return, and grain protein of rain-fed maize under nitrate and urea nitrogen forms. Notulae Botanicae Horti Agrobotanici Cluj-Napoca, 51(3), 13293. https://doi.org/10.15835/nbha51313293
- Otieno, M. A. (2021). Application of GIS in land evaluation and development of suitability map and fertilizer programme for capsicum production in Nairobi peri-urban counties [MSc Thesis]. Kenyatta University.
- Otieno, M. A., Gitari, H. I., Danga, B., & Karuma, A. N. (2022). Soil properties and fertility management with respect to Capsicum (Capsicum annum L.) production in Nairobi Peri-urban Counties. Journal of Soil Science and Plant Nutrition, 22(1), 374–392. https://doi.org/10.1007/s42729-021-00655-1
- Otieno, M. A., Gitari, H. I., Maitra, S., & Nungula, E. Z. (2023). GIS-AHP technique land suitability assessment for capsicum (Capsicum annuum L.) production. International Journal of Bioresource Science, 10(1), 19–30. https://doi.org/10.30954/2347-9655.01.2023.3
- Qureshi, M. R. N., Singh, R. K., & Hasan, M. A. (2018). Decision support model to select crop patterns for sustainable agricultural practices using fuzzy MCDM. Environment, Development and Sustainability, 20(2), 641–659. https://doi.org/10.1007/s10668-016-9903-7
- Rahimi, A., Gitari, H., Lyons, G., Heydarzadeh, S., Tunçtürk, M., & Tunçtürk, R. (2023). Effects of vermicompost, compost and animal manure on vegetative growth, physiological and antioxidant activity characteristics of Thymus vulgaris L. under water stress. (2022). Yüzüncü Yıl Üniversitesi Tarım Bilimleri Dergisi, 33(1), 40–53. https://doi.org/10.29133/yyutbd.1124458
- Ritung, S., Wahyunto, A. F., & Hidayat, H. (2007). Land suitability evaluation with a case map of Aceh Barat District. Indonesian Soil Research Institute and World Agroforestry Centre.
- Romeijn, H., Faggian, R., Diogo, V., & Sposito, V. (2016). Evaluation of deterministic and complex analytical hierarchy process methods for agricultural land suitability analysis in a changing climate. International Journal of Geographical Information, 5(6), 99. https://doi.org/10.3390/ijgi506009
- Roy, R. N., Finck, A., Blair, G. J., & Tandon, H. L. S. (2006). Plant nutrition for food security. A guide for integrated nutrient management (pp. 348) FAO. Fertilizer and Plant Nutrition.
- Ryan, J., George, E., & Rashid, A. (2001). Soil and plant analysis laboratory manual (2nd ed.; pp. 46–48). Jointly published by the International Centre for Agricultural Research in the Dry Areas (ICARDA) and the National Agricultural Research Centre (NARC).
- Saaty, T. L. (2014). Analytic Hierarchy Process. Wiley Stats Ref: Statistics Reference Online., University of Pittsburgh. 14pp.
- Saglam, M., & Dengiz, O. (2014). Distribution and evaluation of soil fertility based on a geostatistical approach in Bafra Deltaic Plain. Turkish Journal of Agricultural Research, 1(2), 186–195.
- Sánchez-Lozano, J. M., Teruel-Solano, J., Soto-Elvira, P. L., & Socorro García-Cascales, M. (2013). Geographical Information Systems (GIS) and Multi-Criteria Decision Making (MCDM) methods for the evaluation of solar farms locations: A case study in south-eastern Spain. Renewable and Sustainable Energy Reviews, 24, 544–556. https://doi.org/10.1016/j.rser.2013.03.019
- Seleiman, M. F., Aslam, M. T., Alhammad, B. A., Hassan, M. U., Maqbool, R., Chattha, M. U., Khan, I., Gitari, H. I., Uslu, O. S., Roy, R., & Battaglia, M. L. (2022). Salinity stress in wheat: Effects, mechanisms and management strategies. Phyton, 91(4), 667–694. https://doi.org/10.32604/phyton.2022.017365
- Shao, Z., Mwakidoshi, E. R., Muindi, E. M., Soratto, R. P., Ranjan, S., Padhan, S. R., Wamukota, A. W., Sow, S., Wasonga, D. O., Nasar, J., Seleiman, M. F., & Gitari, H. I. (2023). Synthetic fertilizer application coupled with bioslurry optimizes potato (Solanum tuberosum) growth and yield. Agronomy, 13(8), 2162. https://doi.org/10.3390/agronomy13082162
- Tashayo, B., Honarbakhsh, A., Akbari, M., & Eftekhari, M. (2020). Land suitability assessment for maize farming using a GIS-AHP method for a semi-arid region, Iran. Journal of the Saudi Society of Agricultural Sciences, 19(5), 332–338. https://doi.org/10.1016/j.jssas.2020.03.003
- Torrieri, F., & Batà, A. (2017). Spatial multi-criteria decision support system and strategic environmental assessment: A case study. Buildings, 7(4), 96. https://doi.org/10.3390/buildings7040096
- Triantaphyllou, E., & Mann, S. H. (1995). Using the analytic hierarchy process for decision making in engineering applications: Some challenges. International Journal of Industrial Engineering: Applications and Practice, 2(1), 35–44.
- Verheye, W., Koohafkan, P., & Nachterg, F. (2020). Land use, land cover and soil sciences—Vol. II - The FAO guidelines for land evaluation. Available online at http://www.eolss.net/Eolss-sample.
- Zdruli, P., Jones, R., & Montanarella, L. (2004). Organic matter in the soils of Southern Europe. http://soils.jrc.ec.europa.eu/esdb_archive/eusoils_docs/esb_rr/n15_OMsouthEurope.Pdf.