
 ?Mathematical formulae have been encoded as MathML and are displayed in this HTML version using MathJax in order to improve their display. Uncheck the box to turn MathJax off. This feature requires Javascript. Click on a formula to zoom.
Abstract
Land use/land cover changes and climate change can have profound effects on hydrology within watersheds. The Soil and Water Assessment Tool model was used to evaluate the individual and combined impacts of land use/land cover and climate on the hydrology of the Muga watershed. The model was calibrated and validated based on observed streamflow data. The calibrated and validated model demonstrated good performance, as indicated by Nash Sutcliff Efficiency values of 0.79 for calibration and 0.82 for validation. Similarly, the Percentage of Bias values of 8.2% for calibration and 9.3% for validation indicate a small overall bias in the model’s predictions. According to the findings of this study, there is an overall increase in surface runoff (15.78% in 2022 and 15.28% in 2038) and water yield (1.22% in 2022; 0.83% in 2038), along with a reduction in lateral flow (8.55% in 2022; 7.0% in 2038), groundwater flow (9.21% in 2022; 10.0% in 2028), streamflow (5.8% in 2022; 3.3% in 2038), and evapotranspiration (1.54% in 2022; 0.95% in 2038), compared to the baseline year (1994). The land use/land cover changes in 2022 and projected for 2038 contributed to these alterations in hydrological parameters. The combined effect of land use/land cover and climate change on water balance is relatively higher than the impact of land use/land cover change scenario alone. The intensified rainfall contributes to the observed increase in surface runoff and water yield. Hence, the study is crucial to implementing sustainable land use practices and appropriate watershed management strategies.
IMPACT STATEMENT
Climate change is a global concern affecting many landscape characteristics. Land use changes as an important variable in soil erosion are expected to change under projecting climatic scenarios. Evaluation of future soil erosion is crucial for devising appropriate interventions. Moreover, research results from such studies contribute to planning, decision-making, and policy development which could make possible sustainability of natural resources.
REVIEWING EDITOR:
SUBJECTS:
1. Introduction
Land use/land cover (LULC, hereafter we call it) and climate change are two major factors that affect water resources (Safriel, Citation2007). Recently, these threats have become among the most important ecological problems worldwide (Nkonya et al., Citation2016). The potential impacts of LULC and climate change could lead to unforeseen future water resource crises (Talib & Randhir, Citation2017). Hence, spatiotemporal LULC and climate change analysis are essential in water resources management (Afzal & Ragab, Citation2020). Climate change has multiple effects on the hydrological cycle, affecting water resources (Swain et al., Citation2020). Population growth, climate change, and land use policy are some of the variables that have caused substantial changes in land cover and land use, which have an impact on the hydrological system at the watershed, sub-basin, and regional levels (Birhanu et al., Citation2019).
Water resource is influenced by diverse land uses, including cropland, built-up expansion and forest, and grassland decline. Additionally, climate change has made the effects of population growth, poverty, and rapid urbanization on the depletion of natural resources worse (Gebre & Ludwig, Citation2015). Climate change (i.e. temperature and precipitation) will likely continue to change in the 21st century (Gizaw et al., Citation2017), leading to water scarcity. A change in LULC also changes surface runoff characteristics, groundwater recharge, and evapotranspiration.
In Ethiopia, temperatures have exhibited a noticeable upward trend over the last three to five decades, especially the minimum temperatures (Abebe, Citation2017; Berhane et al., Citation2020; NMA, Citation2007). In contrast, most studies in Ethiopia have indicated that rainfall shows no distinct trend, either positive or negative (Abebe, Citation2017; Berhane et al., Citation2020; Kiros et al., Citation2016).
LULC change, like climate change, is the main component of environmental change in many parts of the world. In Ethiopia, the conversion of LULC from natural vegetation to farmlands, grassland lands, human settlements, and built-up centers is common (Demissie et al., Citation2017). However, LULC changes in trend, pattern, type, and magnitude were heterogeneous across the country (Demissie et al., Citation2017). LULC change, combined with climate change, affects the water resources of Ethiopia’s highland areas (Setegn et al., Citation2014). Changes in precipitation, temperature, and LULC affect water resources through interception, evapotranspiration, runoff, evaporation, and surface infiltration, thereby affecting the process of watershed hydrology (Bewket & Sterk, Citation2005).
Rapid population growth adds pressure to the effects of climate and LULC changes on water availability, which negatively affects nations’ agricultural sector and food supplies (Kurukulasuriya & Rosenthal, Citation2013). Therefore, to mitigate their impacts and improve overall management practices, it is crucial to understand how changes in land use and climate affect the availability and quality of water resources. LULC change affects the hydrological process (Birhanu et al., Citation2019). Climate change also affects the hydrological cycle (Bewket & Sterk, Citation2005; Demessie, Citation2015; Taye et al., Citation2015) and the management of water resources (Jury & Funk, Citation2013; Kim & Kaluarachchi, Citation2009). Therefore, studying the impacts of LULC and climate changes on water resource dynamics is vital to providing helpful information on sustainable watershed management and land use policies.
In Ethiopia, several studies were conducted in the Abay River basin to examine the impact of LULC and climate change on hydrology (Birhanu et al., Citation2019; Mengistu et al., Citation2021; Tekleab et al., Citation2013). In the Abay River basin, water resources are also highly vulnerable to LULC and climate change (Berihun et al., Citation2019; Teklay et al., Citation2021). However, most studies focused on the impact of either LULC change (Belihu et al., Citation2020; Tekleab et al., Citation2014; Woldesenbet et al., Citation2017) or climate change (Abdo et al., Citation2009; Ayele et al., Citation2016) on hydrology. Although the distinct and combined impacts of LULC and climate changes on hydrology have been studied, there are limited studies on their combined effects on hydrology, particularly in the Abay River Basin. Some studies in Ethiopia showed that climate change affects hydrological processes more than changes in LULC (Mekonnen et al., Citation2018). The impacts of LULC change, however, have been found in some studies to be more important than the influences of climate change (Woldesenbet et al., Citation2018).
The results of the previous studies did not provide a conclusive impact of LULC and climate change on hydrological processes. For instance, the increase in surface runoff and total water yield attributed to LULC changes partially offset the decrease in surface runoff and total water yield caused by the effects of climate change. On the contrary, moist climate conditions exacerbated the increase in streamflow caused by LULC change (Woldesenbet et al., Citation2018). The combined impact of future LULC and climate change on hydrology was also the subject of a few studies (Teklay et al., Citation2021; Woldesenbet et al., Citation2018). However, the context is still not well understood at the watershed level. The influence of LULC and climate change on natural resources such as soil and hydrology remains a contentious issue and requires further research (Demessie, Citation2015; Simane et al., Citation2013). Hence, examining the impact of LULC and climate change on hydrology provides important information for managing and conserving water resources at a watershed level.
Large-scale irrigation and hydroelectric projects in the Abay River basin, including the Grand Ethiopian Renaissance Dam (GERD), are being constructed. This study was conducted in Muga watershed, one of the Abay River Basin tributaries from Choke Mountain. The study area and its environs are severely affected by land degradation due to the severity of LULC and climate changes. Moreover, small-scale irrigation projects along the Muga River are being initiated to improve agricultural productivity and the community’s livelihood.
Assessing the impact of climate and LULC change hydrology is essential to implement effective watershed management interventions and local climate adaptation strategies. Furthermore, the implementation of context-specific interventions is crucial, which necessitates conducting specific studies in areas of concern. However, there has been no study conducted to date that provides scientific evidence on the impact of past and future climate and LULC change on the hydrological process in Muga watershed. This knowledge gap is crucial as it allows for a more comprehensive understanding of the environmental changes occurring in the watershed. Therefore, this study is crucial and necessary for activities such as soil and water conservation, land use planning, climate change adaptation, and mitigation interventions. Considering all the aforementioned issues, the objective of this study was to quantify the individual and combined effects of LULC and climate changes on hydrological characteristics in Muga watershed, located in the Abbay River basin of Ethiopia.
2. Materials and methods
2.1. Study area
The study area is located between 10° 05’ N to 10°44’ N and 37° 49’ E to 38° 9’ E (). The total area coverage of the study watershed is about 424 km2. According to Hurni (Hurni, Citation1998) classification system, the agro-climatic condition of the study area is categorized into three agro-ecological zones: Weynadega (1500–2300 m), dega (2300–3200 m), and Wurch (above 3200 m). The area experiences an average annual rainfall of 1058.8 mm, with over 85% occurring during the wet season (May–October). The mean monthly minimum and maximum temperatures are about 9.3 and 23.7 °c, respectively (Belay & Mengistu, Citation2019).
Figure 1. Location map of the study area.
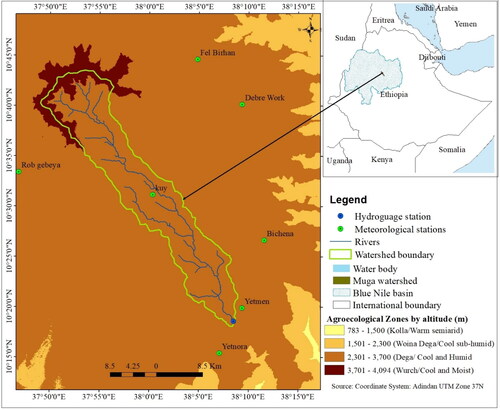
As per the FAO soil map unit classification system, the major soils in the study watershed are eutric cambisols, eutric vertisols, haplic luvisols, and haplic nitisols. The organic content of the soils in the study watershed ranges from 2.09 to 3.22, and the soil pH values range from 5.5 to 6.0 (BCEOM, Citation1998).
The main land use types found in the study watershed include cultivation, grassland, forest, and bushland. Due to the agroecological variation of the watershed, various plant and tree species flourish in the area. The livelihood of the local community primarily engaged in agriculture with a mixed farming system, constituting about 95% of the population’s sources of income. The location map of the study area is shown in .
2.2. Datasets
The study used both spatial and temporal, with main datasets including a Digital Elevation Model (DEM), satellite images, Ground Control Points (GCPs), soil map, land use data, and hydro-meteorological data. The study used an integrated method that includes the CA-Markov chain model, and hydrological and climate models to evaluate the effects of LULC and climate change on the water balance of Muga watershed.
2.2.1. Hydro-meteorological data
Based on coupled hydro-climatic data and physical characteristics of the watershed, the hydrological processes of the watershed were simulated. Long-term (1994–2022) daily rainfall, maximum and minimum temperature, solar radiation, relative humidity, and wind speed were required for SWAT’s daily calculation of hydrological processes. The gridded rainfall and temperature data with the spatial resolution of 4 km * 4 km was obtained from the National Meteorological Services Agency (NMSA) of Ethiopia.
Ground-observed wind, relative humidity, and solar radiation data are not available. Therefore, Climate Forecasting System Reanalysis (CFSR) data were used for these parameters. The global weather data is accessible on the SWAT website as well (http://globalweather.tamu.edu/). It is worth noting that the CFSR data is widely used for SWAT model applications, particularly for variables such as wind speed, relative humidity, and solar radiation, which are often unavailable at desired spatiotemporal resolution.
The Hargreaves-Sami (HS) method was used to compute potential evapotranspiration (PET), which is used as input for the SWAT model. FAO recommends the HS as an alternative method when observed meteorological data are unavailable (Allen et al., Citation1998). The HS method requires the daily minimum and maximum air temperatures as input.
For model calibration and validation, it is essential to have observed streamflow data covering the entire simulation period. The daily streamflow data for twenty-five years (1995–2019) at the outlet of the watershed (Muga near Dejen) was obtained from the Ethiopian Ministry of Water and Energy Hydrology Department. The streamflow data gaps were filled with statistically similar day averages (long-term averages) from earlier years with available data, as suggested by Perry and Hollis (Perry & Hollis, Citation2005).
The geographical location of meteorological stations and their mean annual rainfall, minimum and maximum temperature for the reference (1994–2022) and future (2023–2055) periods of Muga watershed are given in .
Table 1. Mean annual minimum and maximum temperature (oC) and precipitation (mm) for 1994–2022 and 2023–2055 periods.
Climate data from Six Regional Climate Models (RCMs) forced by two Representative Concentration pathways (RCPs), RCP4.5 and RCP8.5 were used. The projected future climate change in the study area from 2023 to 2055 was based on data that was acquired from the Coordinated Regional Downscaling Experiment (CORDEX)-Africa. The future climate data for the SWAT model were daily rainfall and maximum and minimum temperatures.
The stochastic weather generator (WXGEN) is used to generate climate variables for 2023–2055, encompassing solar radiation, relative humidity, and wind speed (Sharpley & Williams, Citation1990). The stochastic weather generator is commonly used in climate change studies (Cousino et al., Citation2015; Fan & Shibata, Citation2015; Ficklin et al., Citation2009). Hence, a stochastic weather generator is used in this study to predict specific future meteorological variables (solar radiation, relative humidity, and wind speed) based on historical statistics of the observed data and climate information. These data were used as input for the SWAT model to predict the future impacts of climate change on hydrology.
2.2.2. Land use land cover data
Landsat thematic mapper (TM), enhanced thematic mapper (ETM+), and operational land imager (OLI) time series images were obtained. The Landsat images for the years 1994, 2008, and 2022 were utilized in the Google Earth Engine (GEE) image classification process to produce LULC maps of the study area. To ensure cloud-free images, all images were taken during the dry months of December and January. In addition to historical LULC data, topographic maps and SPOT images were used to gather ground control points for the two historical periods (1994 and 2008).
The Ethiopian Geospatial Information Institute (EGII) provided topographic maps from 1994 with a scale of 1:250,000 and SPOT images for 2008 with a spatial resolution of 5 m, respectively. Five LULC classes, i.e. forest, shrubland, grassland, cropland, and built-up area, were identified based on field visits, information from local informants, researchers’ prior knowledge, image classification results, and visual interpretation using Google Earth historical function and supportive supplementary data. Based on the principles of ‘complete consistency’ and ‘temporal stability’ (Hu & Hu, Citation2019); sample points were filtered from five land cover types.
2.2.2.1. LULC classification
Machine learning-based image classifiers are very helpful for recognizing patterns in complex functional spatial characteristics (Richards & Richards, Citation1999). Using remote sensing data, one of the most widely used algorithms for classifying land cover is random forest (Breiman, Citation2001). Several researchers carried out a crucial study on LULC classification on GEE using random forest methods, and the results were outstanding (e.g. Foody & Mathur, Citation2004; Luo et al., Citation2021; Magidi et al., Citation2021). Thus, the ee.smileRandomForest function in the GEE was used to execute the LULC class. Thus, five land uses were identified from the satellite images of the research area. The satellite images of the study site were divided into five land uses (). The GEE platform (Gorelick et al., Citation2017), a highly effective free cloud platform for processing and analyzing satellite image data (Xiong et al., Citation2017), was used for the majority of tasks in this investigation.
Table 2. Land-use types of the study area.
Google Earth images were utilized to extract reference data and 430 ground control points were collected for each year using a random sampling technique. The mean pixel values of the spectral signatures were used in GEE to extract these sample training data. The datasets served as a training test for machine learning algorithms used to categorize the types of land use and cover. The data used to train the classifier must be kept apart from the data used to assess its accuracy to ensure a ‘fair’ evaluation of the classifier’s generalization. As a result, training and test sets of labeled data are often created. For each LULC type, the sample size was determined by the percentage of its area.
The researchers experimented with different numbers of training samples (a trial-and-error process) until the optimal amount that could achieve high accuracy in classification. The training (70%) and testing (30%) datasets were separated from the total data. Finally, test data were used to evaluate how well the modified RF model performed. The test datasets’ LULC classes were subsequently predicted using the trained model. The user accuracy values and kappa coefficients were used to examine the performance of RF (Congalton & Green, Citation2019). The accuracy of the map based on the data was evaluated by error matrices, which were used to compare the areal size of the classes in the classification results to the reference data set. Using the training datasets for each study year, we then used the trained model to predict five LULC classifications. The validated classes were used to assess producer and user accuracy (Santos et al., Citation2022).
2.3. Markov chain, cellular automata (CA), and CA-Markov models
In the study, the CA-Markov chain model was used to predict the LULC in a study area for the year 2038 based on LULC maps of 1994, 2008, and 2022. The model used transition suitability images and Markov transition parameters to determine the likelihood of change. The CA-Markov chain model is a powerful integration of the Markov chain model and the CA model for the prediction of spatial LULC change (Halmy et al., Citation2015). The CA Markov model incorporates both non-spatial and spatial data as input to simulate LULC changes. Datasets, including land use land cover maps (1994, 2008, and 2022), topography, land suitability maps, proximity to infrastructure, transportation networks, proximity to rivers, and other spatially explicit datasets, were used as the basis for defining the rules and constraints governing the transitions between LULC types in the CA model.
Through the examination of relevant literature (Bewket & Teferi, Citation2009; Gidey et al., Citation2017; Hishe et al., Citation2020; Teferi et al., Citation2013) and engagement with stakeholders, such as farmers, local experts, and officials from regional land bureaus, and taking spatial correlations into account, we identified potential drivers of LULC change. These drivers were further analyzed to understand their specific impacts on land-use dynamics in the study area. In our investigation, a digital elevation model with a resolution of 30 meters, derived from ASTER data, was used to create slope, elevation, and stream network data. To incorporate road network data, researchers obtained it from OpenStreetMap (https://www.openstreetmap.org/), a collaborative mapping platform that provides freely available geospatial data. Population data, a crucial factor in LULC analysis, was sourced from the Ethiopian Central Statistical Agency (CSA). The datasets, which include the DEM, road network, and population, were processed and analyzed using ArcGIS software. After processing and analyzing the data in ArcGIS, the resultant datasets and potential transition maps were exported to Idrisi Selva software for further analysis. Iterations were performed within the CA-Markov model to refine and improve the accuracy of the predicted LULC maps (Arsanjani et al., Citation2011).
2.4. CA-Markov model validation
Model validation is a crucial step in assessing the performance and accuracy of a predictive model. The kappa coefficient Index was used to evaluate the performance and accuracy of the CA-Markov model in predicting LULC changes in the study area. Thus, the accuracy of the simulated 2022 LULC map was evaluated by valuing the degree of agreement between a simulated and actual map of 2022. Kappa statistics are used to test accuracy using various measures, including traditional Kappa (Kstandard), Kappa for no information/ability (Kno), Kappa for location (Klocation), and quantity of correct cells (Kappa for quantity). Variations of kappa have been strongly recommended and widely used to validate LULC change predictions (Pontius, Citation2002; Singh et al., Citation2015).
The use of the LULC map is a crucial part of the SWAT model, as it helps to understand the impact of changes in land use on the hydrological response of the watershed. The study used the historical (1994, 2008, and 2022) and predicted LULC maps of 2038 to show the study watershed’s hydrological response to LULC changes. The SWAT model requires the conversion of the LULC types into four-digit SWAT codes. The SWAT database assigned the land use codes such as AGRL, FRST, SHRB, GRAS, and URBN, to represent cropland, forest, shrubland, grassland, and built-up areas, respectively.
2.4.1. Soil and geological information
The soil physical and chemical properties parameters required by SWAT determine runoff factors. The study watershed has five types of soil, the details of these soil types can be found in (Belay & Mengistu, Citation2021). To create a soil map for the SWAT (Soil and Water Assessment Tool) model, a scale of 1:250,000 was used. The soil map was obtained from the Ministry of Water & energy of Ethiopia. A soil database was prepared that includes information on the physical and chemical properties of each soil layer.
2.4.2. Digital elevation model (DEM)
The study used DEM data from ASTER to derive hydrologic parameters and hydrological response units (HRUs) set up in the ArcSWAT interface. In addition to the soil data, topographic parameters were used to drive the SWAT model for the watershed. The stream network is a critical component of watershed hydrology and is used to simulate the flow of water through the channels. In this study, the stream network data was validated through a process called ground truthing, which involves physically verifying the presence and location of streams through fieldwork. Based on the topographic features, the SWAT model identified 13 sub-watersheds within the main watershed under study.
2.4.3. Climate change scenarios
In the study, bias-corrected Regional Climate Models (RCMs) were used as inputs for the SWAT model. These RCMs are driven by Global Climate Models (GCMs) and provide regional-scale climate projections. The ensemble mean of six RCMs is used as the input for the SWAT model. The climate data used in the study has a resolution of 50 × 50 km. The climate data for the study was obtained from the CORDEX (Coordinated Regional Climate Downscaling Experiment) -Africa data portal (https://esgf-data.dkrz.de/search/cordex-dkrz/). CORDEX is an international program that focuses on producing downscaled climate information for regional studies. The CORDEX-Africa data portal specifically provides climate data for the African continent.
The selection of the six RCMs in our study was based on a comprehensive review of existing studies on climate change conducted by different scholars in Ethiopia (Alemseged & Tom, Citation2015; Teklesadik et al., Citation2017; Worku et al., Citation2018). These studies found that the chosen RCMs are suitable for impact assessment studies. Additionally, we considered their applicability to our specific study site. Our prioritization was based on the success demonstrated by these RCMs in similar contexts, aligning with the objectives and scope of our research. The study incorporates the two representative concentration pathways (RCPs) recommended by the Intergovernmental Panel on Climate Change (IPCC) for climate change impact and adaptation studies (Stocker et al., Citation2013). Two pathways, namely RCP4.5 and RCP8.5, are considered. RCP4.5 represents an intermediate stabilization scenario, assuming the implementation of appropriate adaptation measures and efforts to reduce greenhouse gas emissions. On the other hand, RCP8.5 represents a high-emission scenario, assuming minimal to no effort to reduce greenhouse gas emissions (van Vuuren et al., Citation2011).
The study utilized power transformation bias correction for precipitation and linear scaling bias correction methods for temperature minimum and maximum, as suggested by Teutschbein & Seibert (Teutschbein & Seibert, Citation2012). These methods are commonly employed to adjust climate model data and improve their accuracy for impact assessments. The details concerning the types and sources of datasets used in this study are listed in ().
Table 3. Dataset sources and types (1994, 2008, and 2022) and predicted LULC (2038).
Table 4. List of RCMs used in the CORDEX-Africa dataset for this study.
The result indicates that the bias correction technique had a positive effect on the simulated data. This is demonstrated by the decrease in RMSE values and the fact that the standard deviation values became closer to the observed data. Moreover, there was a significant improvement in the correlation between the simulation and observation data. The bias correction performed in the study was deemed satisfactory and consistent with previous research findings, as reported by Teklesadik et al. (Betrie et al., Citation2011).
2.5. The soil water assessment Tool (SWAT)
The Soil Water Assessment Tool (SWAT) is a physically based and semi-distributed hydrological model developed at the USDA-ARS (Arnold et al., Citation2012). SWAT used to study large-scale and complex watersheds for each hydrological response unit (HRU), units with similar soil types, land use, and slope classes (Arnold et al., Citation2012). HRUs depict the essential soil water content, nutrient cycles, surface runoff, crop growth, sediment yield, and simulated management practices.
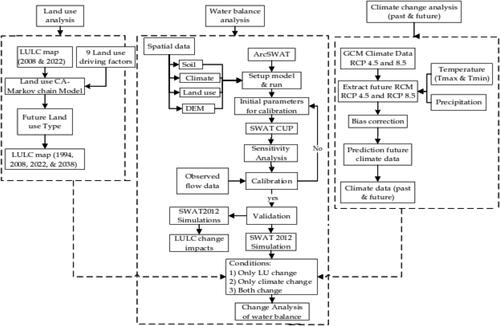
Some researchers have used the SWAT model across different watersheds in Ethiopia [e.g. (Betrie et al., Citation2011; Gessesse et al., Citation2015)]. They proved that the model helps to examine erosion and streamflow of watershed responses to LULC and climate change. In this study, the runoff response for the rainfall events was simulated using the Soil Conservation Service Curve-Number (SCS-CN) method (SCS, Citation1972). To obtain details about SCS-CN, one can refer to earlier studies (Betrie et al., Citation2011; Schneiderman et al., Citation2007; SCS, Citation1972). The methodology used in this study to assess the impacts of LULC and climate change on hydrology using the SWAT model is depicted in .
Figure 2. Flowchart representing the overall framework SWAT based modeling .
2.5.1. Performance measures
The model’s performance can be evaluated through various measures of efficiency. Nash-Sutcliffe Efficiency (NSE) and the Percentage of Bias (PBIAS) are most commonly used (Moriasi et al., Citation2007). We also used the NSE and PBIAS to determine the model performance.
(1)
(1)
(2)
(2)
Where NSE is the Nash-Sutcliffe coefficient, PBIAS is the percentage of deviation, Qobs is the observed data, Qsim is simulated data, and Qmean is mean streamflow.
3. Results and discussion
3.1. Accuracy assessment
Before using image classification results for further analysis, it is compulsory to assess their accuracy to evaluate the percentage of pixels classified correctly and incorrectly per LULC cluster. Overall, the accuracy of the 1994, 2008, and 2022 LULC maps was assessed by independent datasets using the kappa coefficient, overall accuracy, and producer and user accuracy. This assessment helps to determine the quality and reliability of the LULC maps. The results showed that the overall accuracy for 1994, 2008, and 2022 images was 86.4, 87.6, and 89.5%, respectively, with kappa statistics values of 0.86, 0.88, and 0.91 (). This indicates a high level of confidence in the accuracy of the LULC data used in the subsequent analysis (Congalton & Green, Citation2019).
Table 5. Accuracy assessment for the years 1994, 2008, and 2022 classification.
The validation of simulated and actual LULC maps for 2022 also reveals consistency between the actual and simulated LULC Maps of 2022. The Kappa statistics show that the values for kno (0.89), klocation (0.83), klocationstata (0.85), and kstandard (0.82) are all greater than 0.8, indicating the model’s accuracy to predict future LULC changes (Mondal et al., Citation2016).
3.2. Land use land cover changes analysis
The result of the classification identified five dominant LULC classes, namely cropland, forest, shrubland, grassland, and built-up areas. The spatial pattern and extent of LULC types extracted from classified images showed that cropland was the most dominant in the study watershed during the study periods. To assess the trend and evolution of historical land use changes over time, land use data for the years 1994, 2008, and 2022 were used.
The results of the study indicated that between 1994 and 2022, there was an increase in cropland and built-up areas by 13.3 and 55.3%, respectively. However, during the same period, there was a forest decline, grassland, and shrubland by 2.6, 62.4, and 52.7%, respectively (). These changes in land use are important for understanding the hydrologic processes in the study watershed, as they can significantly impact the water balance and affect the quantity and quality of water resources in the area. The study watershed is primarily dominated by cropland as the main land use type, as indicated in . For detailed information regarding the area coverage and trends of each land use land cover type, anyone can refer to .
Table 6. Spatial pattern of LULC change in the study watershed.
Table 7. Area coverage and percentage of LULC classes in Muga watershed.
The study revealed a consistent increase in cropland at a rate of 48.4 ha per year during the first period (1994–2008) and a higher rate of 254.4 ha per year during the second period (2008–2022). Similarly, built-up areas demonstrated an increase of 8.6 hectares per year during the first period and a higher rate of 34.6 hectares per year during the second period. During the study period from 1994 to 2008, forest areas exhibited a growth rate of approximately 0.98% per year. However, in the second period, there was a higher rate of forest reduction. The increase in forest cover during the first period can be attributed to improved land use and management practices implemented by the local community, including activities such as rehabilitation, area closure, and reforestation.
The results showed that the growth of cropland led to a decline in forest and grassland, which aligns with previous studies in Ethiopia (Berihun et al., Citation2019). Furthermore, a significant decline in grassland was observed in some parts of the catchment, which aligns with other studies in Ethiopia (Abdulahi et al., Citation2016). The increase in forest land from 1994 to 2008 was attributed to the establishment of Eucalyptus plantations in the study area. However, the continuous expansion of built-up areas at the expense of grassland and shrubland resulted from infrastructural development in the catchment. In general, the results of this study highlight the need for sustainable land management practices in the Muga watershed to ensure the conservation of natural resources and to mitigate the negative impacts of LULC changes on the environment.
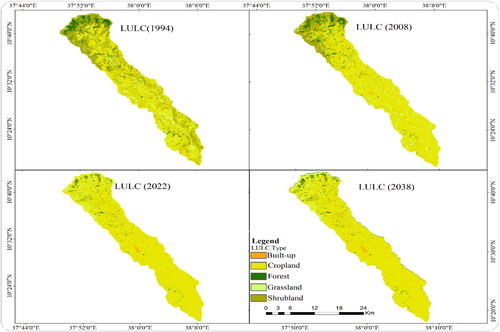
According to the LULC map of 2038, cultivated land remains the dominant land use type within the study watershed, accounting for about 83.1% of the study area. During the period from 2022 to 2038, there has been a decrease in the area covered by forests by 18.7%. However, built-up areas and grasslands have experienced an increase of 25.7 and 24.5%, respectively. It is worth noting that the increase in grassland area is likely attributed to the alteration of shrubland into grasslands, as indicated in .
and depict the expansion of urban areas, loss of forested areas, and increase in degraded or barren lands resulting from overgrazing or other factors. Based on these findings, one can conclude that if the community persists with unsustainable practices, the watershed’s condition is likely to deteriorate further. This deterioration may result in adverse effects including diminished water quality, exacerbating soil erosion, loss of biodiversity, and a reduction in the ecosystem services provided by the watershed.
Figure 3. LULC maps of 1994, 2008, 2022 and 2038.
3.3. SWAT calibration and validation
Successful hydrological models rely heavily on the parameters’ calibration and sensitivity analysis (Abbaspour et al., Citation2018). The model simulations were divided into a warm-up (1995–1997), calibration (1998–2014), and validation (2015–2019) phases. By following this three-phase approach, the SWAT model was tuned and tested to simulate the behavior of the watershed. Initially, thirteen parameters were chosen for this study. Finally, seven sensitive parameters were chosen based on their sensitivity values. The calibrated sensitivity parameters of the SWAT model and the adjusted values obtained are shown in . The results showed that the SCS runoff curve number (CN2) was more sensitive to streamflow, which is consistent with several other studies (Gebremicael et al., Citation2013; Melaku et al., Citation2018; Worqlul et al., Citation2018).
Table 8. List of parameters with fitted values and global sensitivity results for daily flow.
The absolute values of T-stat and p-Value were used to rank the sensitive parameters. The T-stat value measures the size of the difference in terms of variability in the sample data. At the same time, the p-value indicates the probability of observing a test statistic at least as large as the one calculated with the assumption that a hypothesis is correct (). A parameter with the highest absolute T-stat value and minimum p-value compared to the other parameters was considered highly sensitive (Abbaspour et al., Citation2018).
Figure 4. Sensitivity analysis of parameters for river discharge calibration, p-value shows the measure of sensitivity, the larger t-values are more sensitive. t-Test represents the significance of sensitivity, the smaller the p-value, the less chance of a parameter being by chance assigned as sensitive.
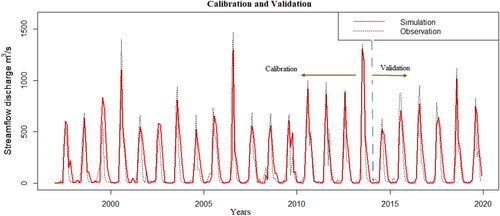
The NSE values of 0.79 and 0.82 for the calibration and validation periods, respectively, indicate a substantial agreement between the simulated and observed streamflow (). Moreover, the PBIAS values are 8.2 and 9.3% for the calibration and validation periods, respectively (). Thus, the SWAT model demonstrates ‘very good’ performance during both the calibration and validation periods, meeting the criteria of NSE >0.5 and PBIAS < ± 25% (Moriasi et al., Citation2007).
Figure 5. Simulated and observed streamflow for calibration and validation periods.
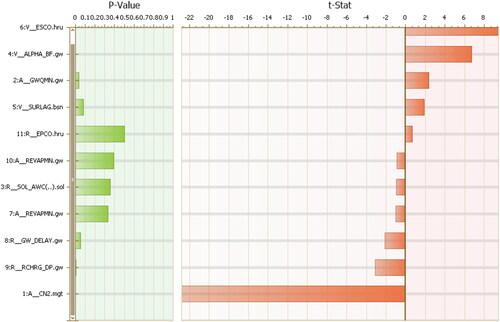
Table 9. SWAT model evaluation parameters for streamflow in the Muga watershed.
3.4. Impact of LULC and climate changes on the hydrology of Muga watershed
3.4.1. Individual impacts of land use land cover changes
LULC change due to human activities such as deforestation, loss of vegetation, and increased settlement are the most significant contributors to changes in the hydrological response of a watershed (Berihun et al., Citation2019; Gashaw et al., Citation2018; Woldesenbet et al., Citation2017). The four different periods of land use considered in the study are 1994, 2008, 2022, and 2038. The simulations carried out using the SWAT model revealed several important findings concerning the impact of LULC changes on the water balance components of the Muga watershed. These findings are summarized in , which presents the mean annual values of various water balance components for different LULC scenarios. During the dry season, the mean monthly streamflow exhibited a decline from 71.1 mm in 1994 to 43.5 mm in 2008 and 48.6 mm in 2022, with a projected decrease to 49.0 mm in 2038. This decline in streamflow is primarily attributed to anthropogenic activities, particularly changes in LULC. Conversely, the mean monthly streamflow during the wet season showed an increase from 71.1 mm in 1994 to 43.5 mm in 2008, further to 48.6 mm in 2022, and is projected to reach 49.0 mm in 2038. Additionally, the mean monthly streamflow during the rainy season increased from 133.2 mm in 1994 to 147.0 mm in 2008 and subsequently to 146.8 mm in 2022. In summary, the average monthly streamflow during the dry season has experienced a decline from 71.1 mm in 1994 to 43.5 mm in 2008, 48.6 mm in 2022, and is predicted to reach 49.0 mm in 2038. On the contrary, the average monthly streamflow during the wet season has observed an increase from 71.1 mm in 1994 to 43.5 mm in 2008, and 48.6 mm in 2022, and is projected to reach 49.0 mm in 2038.
Table 10. Average annual evapotranspiration (ET), surface runoff (SURQ), groundwater (GWQ), water yield (WYLD), and lateral flow (LQ) change under four LULC scenarios and historical climate data (1994–2022).
The average annual streamflow for the LULC 1994, 2008, 2022, and 2038 scenarios is 203.3, 190.5, 195.4, and 198.6 mm, respectively, which revealed that the average annual streamflow decreased significantly during the study period. The decline in mean yearly streamflow is due to the expansion of cropland and built-up areas and the loss of forests, shrublands, and grasslands. In contrast, surface runoff increased from 190.4 mm in 1994 to 204.6 mm and 220.4 mm in 2008 and 2022, respectively, and is expected to rise to 219.5 mm in 2038. These indicate that an increase in cropland and built-up areas at the expense of forests and shrub-bush lands may be the reason for the increased rate of surface runoff. The results of this study are similar to the previous studies conducted by (Berihun et al., Citation2019; Gashaw et al., Citation2018). They reported that surface runoff increased while streamflow declined due to the rapid deforestation of natural forests and expansion of farmland and built-up area at the expense of shrubland and grassland.
Groundwater flow decreased by −4.36 and −9.21% in 2008 and 2022, respectively, and is expected to reduce by 10% in 2038 compared to 1994. Similarly, the average annual ET was decreased from 592.4 mm in 1994 to 580.1 mm in 2008, 583.3 mm in 2022, and expected to be 586.8 mm in 2038, which is 12.3 mm lower in 2008, 9.1 mm lower in 2022, and 5.6 mm lower in 2038 compared to 1994. A possible reason for the decline in the average annual ET is the decline in forests and shrubland. Similarly, there was a negative trend in the average annual lateral flow over the Muga watershed, declining by 3.9% in 2008, 8.5% in 2022, and 7.0% in 2038 compared to 1994. According to Ayivi and Jha (Ayivi & Jha, Citation2018), a slight decrease in groundwater and lateral flow can be attributed to low soil infiltration and high surface runoff.
The mean annual water yield increased slightly in 2008 and 2022 in the study watershed compared to 1994. In 2008 and 2022, water yield increased by 2.7 and 5.6 mm, respectively, while water yield in the study watershed is expected to increase by 3.8 mm in 2038. The decline of vegetation cover, predominantly forest, increases surface runoff and water yield. According to Woldesenbet et al. (Woldesenbet et al., Citation2017), the reduction of forest cover leads to higher water yield. As reported by Aylward (Aylward, Citation2005), water yield was increased with a decline in forest cover, and water yield would increase if forests were cleared.
The findings indicate that from 1994 to 2022, some parts of the forest, grassland, and shrubland were converted to cropland and built-up areas. This trend is anticipated to persist in the future, resulting in a significant increase in surface runoff and water yield of Muga watershed. The results of this investigation align with earlier studies (Bewket & Sterk, Citation2005; Shrestha et al., Citation2018), confirming that the conversion of forested areas to cropland is a contributing factor to the increase of surface runoff. The decrease in vegetation cover diminishes canopy interception, resulting in an increased amount of rainfall directly reaching the soil surface. Consequently, this heightened direct rainfall raises the likelihood of increased infiltration and runoff from the land (Rogger et al., Citation2017).
The increase in surface runoff is linked to a decline in infiltration (Benegas et al., Citation2014). Furthermore, areas affected by deforestation and increased settlement experience a reduction in soil soil infiltration capacity. The reduction of soil water infiltration subsequently leads to a decline in groundwater flow. Forests play a crucial role in absorbing water through leaves and roots, promoting rainwater infiltration into groundwater. The growing demand for groundwater due to a growing population can further exacerbate the reduction in groundwater levels through increased abstraction.
The mean annual water yield increased by 0.6% in 2008 and 1.2% in 2022 compared to the baseline year, likely attributed to the gradual expansion of cropland. The increase in surface runoff resulted from the decline of forests and shrubland, contributing to a higher water yield. The anticipated average annual water yield in the future, under the LULC change scenario, is expected to be closely similar to that of the baseline period, with a projected increase of only 0.8%.
Expansion of residential areas with increased agricultural activities, reduction in vegetation cover, and forest areas leads to more significant areas of impervious surfaces and soil compaction, reducing the potential for soil infiltration and possibly increasing surface runoff (Woldesenbet et al., Citation2018). shows water balance components under different LULC scenarios and historical climate data (1994–2023) in the Muga watershed. In general, if the incoming water through overland flow is more than the infiltration water, the excess water can cause an increase in surface runoff. As a result, water yield, a combination of surface runoff, groundwater flow, and lateral flow, has also increased in cropland and built-up areas.
Table 11. Predicted mean annual water balance components for different combinations of climate change and LULC scenarios.
The results of this study showed agreement with other studies (Birhanu et al., Citation2019; Gashaw et al., Citation2018; Shawul et al., Citation2019; Woldesenbet et al., Citation2018) which reported an increase in surface runoff and water yield. For example, Gashaw (Gashaw et al., Citation2018) showed that a decrease in groundwater flow and an increase in surface runoff in Andasa watershed in the Abay basin between 1994–2015 were associated with changes in LULC of the watershed. According to Shawul [85], between 1974 and 2014, increased surface runoff and decreased groundwater flow in the upper Awash River basin were associated with LULC change. Contrary, when agricultural land is plowed, compaction of the lower soil horizons occurs, causing the reduction of infiltration capacity and more runoff (Jin et al., Citation2008). In study watershed, a rapid change in LULC was observed between 1994 and 2022 due to different proximate and underlying drivers. As a result, the scarcity of land and the need to cultivate more land encouraged the community to cultivate on steep slopes. Cropland of steep slopes increases, in turn, increases surface runoff and reduces infiltration, affecting water resource availability.
The surface runoff trend and water yield were inconsistent during the study periods. However, these showed an increasing trend in 2008, 2022, and 2038 compared to 1994. On the other hand, a decline in mean annual streamflow, evapotranspiration, and lateral flow was observed compared to the reference year. According to the study, forest cover had declined historically. As a result, compared to 1994, forest loss will accelerate surface runoff and water yield while decreasing evapotranspiration in the Muga watershed in 2008, 2022, and 2038. The findings of this study were similar to those of previous studies [e.g. (Chemura et al., Citation2020; Ridwansyah et al., Citation2020)], which showed the shift of high evapotranspiration LULC to low evapotranspiration leads to an increment of surface runoff. The reduction in evapotranspiration in 2008, 2022, and 2038 compared to 1994 may be due to the loss of vegetation cover (forests, grasses, and shrublands). As a result, surface runoff and water yields are supported.
3.4.2. Individual impacts of climate change
The water balance components, simulated by the SWAT model for the baseline period (1994–2022), were compared with the results for the subsequent period (2023–2055) under RCP4.5 and RCP8.5. This comparison aimed to investigate the potential impacts of climate change on the hydrological components of the study watershed. The findings indicate anticipated changes in water balance components, particularly surface runoff, for Muga watershed in the future (2023–2055) compared to historical climate datasets (1994–2022) under the RCP4.5 and RCP8.5 scenarios. In the baseline period, surface runoff was approximately 217.4 mm. However, under future climate scenarios, an increase in surface runoff is projected. The projected surface runoff for the future period is estimated to be around 230.2 mm and 231.5 mm per year under RCP4.5 and RCP8.5, respectively. The findings of this study align with the results of the study conducted by Chanapathi and Thatikonda (Chanapathi & Thatikonda, Citation2020). This suggests that the Muga watershed is likely to experience an increase in surface runoff in the future due to the effects of climate change. Increased surface runoff can have implications for water availability, streamflow, erosion, and other hydrological processes within the watershed. These changes could impact water resources management, flood risk, and ecosystem dynamics in the region.
An increase in surface runoff can contribute to erosion and sedimentation processes within a watershed. The transport capacity of the surface runoff, which depends on factors such as flow velocity and volume, plays a crucial role in determining the amount of sediment that can be transported by the runoff. The study conducted by Abebe & Gebremariam (Abebe & Gebremariam, Citation2019), reported that a reduction in surface runoff can lead to a significant decrease in sediment yield. This finding suggests that when surface runoff is reduced, there is less water available to transport sediments, resulting in lower sediment yields.
The findings of this study indicate that average annual rainfall is projected to increase in the 2055s, leading to an increase in streamflow discharge. Additionally, it is expected that future temperatures will also rise under the RCP4.5 and RCP8.5 emission scenarios. This increase in temperature tends to result in higher evapotranspiration (ET) rates when simulated with LULC data from 2022 and under the RCP4.5 and RCP8.5 scenarios, compared to historical climate datasets. Specifically, the study reveals that ET is expected to rise by 10.4% (61.0 mm) under the simulation using LULC data from 2022 and the RCP4.5 scenario. Similarly, under the simulation with LULC data from 2022 and the RCP8.5 scenario, ET is projected to increase by 11.3% (66.3 mm) compared to historical climate datasets. These results indicate a distinct increase in the predicted ET rates when considering the climate simulation scenarios. The combination of increased rainfall and higher temperatures can lead to enhanced evapotranspiration, suggesting an intensification of water loss from the study area.
Under both emission scenarios (RCP 4.5 and 8.5), the intensity of climate change impacts on various hydrological components will increase in the future under both the RCP4.5 and RCP8.5 emission scenarios within the study watershed. The projected increase in precipitation and temperature in the 2055s is considered as the primary driver of these changes. The study highlights that the magnitude of change in most hydrological components is more significant under RCP8.5 simulation scenario compared to the RCP4.5 scenario. For instance, the average annual streamflow is projected to increase by 13.8% under RCP4.5 and by 21.3% under RCP8.5 compared to the historical baseline period. Moreover, the study indicates that groundwater recharge, surface runoff, lateral flow, and water yield are also expected to undergo notable changes.
Under the RCP4.5 scenario with the 2022 LULC map, the average changes in groundwater recharge, surface runoff, lateral flow, and water yield are projected to be 20.1, 5.9, 10.4, and 11.6%, respectively, compared to the reference period of 1994–2022. Similarly, under the RCP8.5 scenario with the same LULC map, the corresponding changes are estimated to be 21.4, 6.5, 11.3, and 12.9%. These findings align with the study conducted by Dile (Dile et al., Citation2013), which suggests that climate change can impact hydrological components and alter the behavior of the hydrological cycle. The consistent results between these studies strengthen the understanding of the potential effects of climate change on the hydrological system, emphasizing the need for adaptive measures to manage water resources effectively in response to projected changes. , indicates that the hydrological components show an increasing trend, and this increment is associated with a significant rise in rainfall for both the RCP4.5 and RCP8.5 scenarios.
3.4.3. Combined impacts of land use land cover and climate changes
According to the findings presented in , both LULC changes and climate change have noticeable effects on the hydrological components of the study area. However, the individual effect of climate played a more significant role than LULC. This suggests that changes in climate variables such as precipitation patterns, temperature, and evapotranspiration have a stronger influence on the water balance components than modifications in LULC. Climate change can directly alter the overall water availability, streamflow, and evapotranspiration rates within the watershed. While LULC changes can affect local hydrological processes, such as surface runoff and infiltration, their influence seems to be comparatively smaller when compared to the impact of climate change
Compared to the LULC 2022 & CC 1994–2022 simulation, the combined impact of LULC and climate changes is projected to cause the mean annual ET of the study area to increase. The finding of this study indicated that the smallest and highest increase in ET is expected to be under simulation LULC 2038 and RCP 4.5 scenario (10.6%) and LULC 2038 and RCP 8.5 scenario (11.3%), respectively.
The comparison of the combined impact of future LULC and climate change on ET with the individual effects of LULC change scenarios and climate change scenarios reveals that temperature and rainfall have a greater influence on future ET compared to LULC changes. Additionally, the direction of change in average annual ET under the combined LULC and climate change scenario aligns with the changes observed when LULC and climate change scenarios are considered individually. This implies that the combined effect of LULC and climate change on ET does not lead to significant deviations from the individual impacts.
According to the results of this study, the combined effect of changes in LULC and climate is generally similar to the distinct impacts of LULC change and climate change on evapotranspiration (ET). The impacts of these drivers indicate the same direction in terms of their influence on ET. However, it is noted that in future climate change scenarios, ET is slightly higher compared to simulations under the combined impacts of LULC and climate change. This implies that climate change alone, represented by the future climate scenarios, has a slightly stronger effect on increasing ET than when LULC changes and climate change are considered together. Nevertheless, it is highlighted that both LULC changes and climate change scenarios lead to a significant increase in ET. The individual effects of LULC change and climate change, as well as their combined impacts, are expected to have nearly equal influences on ET compared to the simulation under the LULC 2022 and climate data from 1994 to 2022.
shows that the average annual surface runoff under simulation LULC 2038 and RCP 8.5 scenario is likely to increase compared to simulation under LULC 2022 and CC 1994–2022; it is anticipated to increase by 14.2%. Surface runoff is expected to increase by 10.4 and 9.8% under simulations LULC 2022 and RCP 8.5 and LULC 2038 and RCP 4.5 scenarios, respectively. Although surface runoff is anticipated to increase in the future, this may happen mainly due to future climate rather than future LULC. The finding showed that future LULC changes would increase surface runoff and water yield, followed by less vegetation cover and settlement expansion. Hence, the increment of surface runoff and water yield in the study watershed require special attention, as they may cause massive erosion and sedimentation.
The results indicate that the combined effects of LULC changes and climate change are anticipated to increase groundwater flow in the study area. Specifically, under the LULC 2038 and RCP 4.5 scenario, groundwater flow is projected to increase by 20.8% compared to simulations under LULC 2022 and climate data from 1994 to 2023. Similarly, under the LULC 2038 and RCP 8.5 scenario, groundwater flow is projected to increase by 22.2% compared to the same reference simulation. Furthermore, the study indicates that climate change has a higher impact on groundwater flow than the LULC change scenario alone. This implies that the changes in climate variables, such as temperature and precipitation, have a more significant influence on groundwater flow compared to modifications in LULC.
Although the study finds a slight effect of LULC alone on groundwater flow, with increased groundwater flow observed in certain simulations, the magnitude of groundwater flow change under different LULC scenarios is reported to be lower than expected. This suggests that LULC changes have a relatively smaller impact on groundwater flow compared to climate change. The findings of other studies (Marhaento et al., Citation2018; Pan et al., Citation2017; Yan et al., Citation2016) align with the findings of this study, indicating that the impact of climate change on groundwater flow is expected to be higher than that of LULC change.
The findings of this study show that the combined effects of climate change and LULC change show an increase in water yields in the future compared to simulation under LULC 2022 and CC 1994–2022. The study highlights that there are differences among the scenarios in terms of variations in mean annual total water yield. The impact of climate change is particularly pronounced, with the average yearly water yield expected to increase by approximately 13.8% under the LULC 2022 and RCP 4.5 scenario and 17.2% under the LULC 2022 and RCP 8.5 scenario. These increases are about 2.0 and 5.0% higher, respectively, compared to the impact of the LULC change scenario alone. The reason for this difference can be attributed to the increased precipitation projected under the RCP 4.5 and RCP 8.5 climate change scenarios. The excess rainfall leads to an abundance of water on the soil surface, reducing the likelihood of water infiltration. Consequently, surface runoff and base flow increase as the infiltration capacity is exceeded, resulting in higher water yields.
Additionally, the study evaluates the response of lateral flow to the combined future land use and climate change scenario. The simulation results indicate that under the LULC 2038 and RCP 4.5 scenario, the average lateral flow is expected to increase by 3.5% compared to the simulation under the LULC 2022 and climate data from 1994 to 2022. Similarly, under the LULC 2038 and RCP 8.5 scenario, the average lateral flow is projected to increase by 9.5%. These findings suggest that both land use changes and climate change influence lateral flow, with the combined effects resulting in increased lateral flow compared to the reference simulation.
The study compared streamflow values under future climate and land-use scenarios with simulations based on LULC 2022 and historical climate data (CC 1994–2022). The results demonstrate that the combination of future LULC and climate change scenarios has a significant impact on streamflow discharge compared to the simulation based on LULC 2022 and historical climate datasets. It indicates that streamflow is likely to be highest under the simulation of LULC 2038 and RCP 8.5 compared to the simulation of LULC 2022 and CC 1994–2022.
The increase in future rainfall, particularly under RCP 8.5, is reported to be approximately 20.2%, leading to a corresponding increase of 40.6 mm (21.0%) in streamflow discharge. Similarly, under the LULC 2038 and RCP 4.5 scenario, which showed a 17.2% increase in precipitation compared to the historical period, streamflow is expected to increase by 36.4 mm (18.8%). These changes in streamflow are approximately 4.4 and 6.3% higher than the impact of the LULC scenario alone. The study concludes that the combined effect of future LULC and climate change has a greater influence on streamflow discharge than the LULC scenario alone. The intensification of rainfall projected under RCP 4.5 and RCP 8.5 contributes to this increase in streamflow. However, the study also emphasizes that the contribution of LULC change to streamflow change is still substantial.
Overall, the projected rise in future rainfall due to climate change scenarios is expected to enhance average annual streamflow discharge and water resource availability in the Muga watershed. This has implications for water resources planning and operation in the study area and downstream areas of the Abay basin of Ethiopia, providing benefits for local and regional water resources infrastructure.
3.5. Limitations
The resolution of the digital elevation model can significantly influence hydrological components, soil parameters, LULC, and hydrologic response unit delineation. Higher-resolution DEMs provide more detailed information and potentially improve model accuracy. Furthermore, changes in future LULC and climate conditions may affect model parameters, which could introduce uncertainties that could affect the accuracy of the model results.
In this study, model parameters were calibrated and bias-corrected to simulate the future water balance components of the Muga watershed. However, it is acknowledged that future changes in LULC and climate might alter these parameters (Glavan & Pintar, Citation2012). Thus, it is essential to recognize existing limitations and consider potential implications for the accuracy of the model results.
Despite these limitations and uncertainties, the findings of this study are considered relevant, reliable, and valid within the current contexts of LULC and climate change, following the standards outlined by Moriasi et al. (Moriasi et al., Citation2007). While it may be challenging to precisely compare the effects of LULC and climate change, this study successfully identifies and assesses the individual and combined impacts of these factors on watershed hydrology. It is crucial to approach the results of any study with caution and interpret them within the context of its limitations and uncertainties. Ongoing research and advancements in modeling techniques have the potential to further enhance the accuracy and reliability of future hydrological assessments.
4. Conclusions
The assessment of the individual and combined impacts of LULC changes and climate change on watershed hydrology is crucial for the effective management of water resources and the development of climate adaptation strategies. The results of this study suggest that LULC change significantly affects streamflow, surface runoff, groundwater flow, and lateral flow, with relatively minor effects on evapotranspiration and water yields. Moreover, the study predicts an increase in surface runoff, groundwater flow, streamflow, lateral flow, and water yield in the Muga watershed by the 2055s, under both RCP 4.5 and RCP 8.5 scenarios, when compared to reference climate datasets. It emphasizes that the combined effects of future LULC and climate changes have a greater impact on hydrology in the study watershed than simulations-based LULC 2022 and historical climate datasets. Notably, the simulation under LULC 2038 and RCP 8.5 exhibits the highest impact.
The results of our investigation suggest a significant increase in streamflow under the combined scenarios of LULC 2038 and RCP 8.5, as well as LULC 2038 and RCP 4.5 when compared to the baseline period. Specifically, the increase in streamflow is 40.6 mm (21.0%) and 36.4 mm (18.8%) for these respective scenarios. These alterations in streamflow discharge demonstrate the influence of both LULC and climate change on the hydrological components of the watershed. Furthermore, the study emphasizes that the increase in streamflow resulting from the combined impact of LULC and climate change exceeds the impact of LULC change alone. This indicates that climate change, characterized by intensified rainfall under the RCP 4.5 and RCP 8.5 scenarios, plays a significant role in the projected increase in streamflow. However, the contribution of LULC change to the changes in streamflow remains substantial.
Certainly, the results of this research provide valuable insights for the identification and implementation of effective climate adaptation strategies and soil and water conservation methods within the study watershed. A comprehensive understanding of the individual and combined impacts of LULC and climate change on hydrology empowers policymakers, land managers, and other stakeholders to make well-informed decisions regarding the management and sustainable use of water resources.
The study can also contribute valuable insights into the planning and operation of local and regional water resource infrastructure within the study watershed. Decision-makers can design and optimize water management systems by taking into account the projected changes in hydrological components. Overall, this study enhances understanding of the potential impacts of LULC and climate change on hydrology, establishing a foundation for decision-making processes related to water resource management, climate adaptation, and soil and water conservation in the study watershed.
Acknowledgments
The National Meteorological Agency of Ethiopia and the Ethiopian Ministry of Water, Irrigation, and Electricity deserve gratitude for providing the meteorological and streamflow data, respectively. The Geological Survey of the United States (USGS) was very helpful.
Disclosure statement
No potential conflict of interest was reported by the author(s).
Data availability statement
Data is available based on reasonable request from the authors.
Additional information
Funding
Notes on contributors

Tatek Belay
Tatek Belay (PhD), is an Assistant Professor in the Department of Geography and Environmental Studies, Debre Tabor University, Ethiopia. His area of interests are modeling soil erosion, watershed management, land use change, GIS and Remote sensing, climate change, and hydrology.
Daniel Ayalew Mengistu
Daniel Ayalew Mengistu (PhD), is an Associate Professor in the Department of Geography and Environmental Studies, Bahir Dar University, Ethiopia. He has been teaching for several years in the fields of Geoinformatics, Climatology, and Hydrology. He has published numerous articles on topics related to climate change, hydrology, and soil and water conservation.
References
- Abbaspour, K., Vaghefi, S. A., & Srinivasan, R. (2018). A guideline for successful calibration and uncertainty analysis for soil and water assessment: A review of papers from the 2016 International SWAT Conference. Multidisciplinary Digital Publishing Institute.
- Abdo, K. S., Fiseha, B. M., Rientjes, T. H. M., Gieske, A. S. M., & Haile, A. T. (2009). Assessment of climate change impacts on the hydrology of Gilgel Abay catchment in Lake Tana Basin, Ethiopia. Hydrological Processes, 23(26), 1–21. https://doi.org/10.1002/hyp.7363
- Abdulahi, M. M., Hashim, H., & Teha, M. (2016). Rangeland degradation: Extent, impacts, and alternative restoration techniques in the rangelands of Ethiopia. Tropical and Subtropical Agroecosystems, 19(3), 305–3018. https://doi.org/10.56369/tsaes.2234
- Abebe, G. (2017). Long-term climate data description in Ethiopia. Data in Brief, 14, 371–392. https://doi.org/10.1016/j.dib.2017.07.052
- Abebe, T., & Gebremariam, B. (2019). Modeling runoff and sediment yield of Kesem dam watershed, Awash Basin, Ethiopia. SN Applied Sciences, 1(5), 446. https://doi.org/10.1007/s42452-019-0347-1
- Afzal, M., & Ragab, R. (2020). Impact of the future climate and land use changes on the hydrology and water resources in South East England, UK. American Journal of Water Resources, 20, 218–231. https://doi.org/10.12691/ajwr-8-5-2
- Alemseged, T. H., & Tom, R. (2015). Evaluation of regional climate model simulations of rainfall over the Upper Blue Nile basin. Atmospheric Research, 161–162, 57–64. https://doi.org/10.1016/j.atmosres.2015.03.013
- Allen, R. G., Pereira, L. S., Raes, D., & Smith, M. (1998). Crop evapotranspiration-guidelines for computing crop water requirements-FAO irrigation and drainage paper 56 (vol. 300, p. D05109). FAO.
- Arnold, J. G., Kiniry, J. R., Srinivasan, R., Williams, J. R., Haney, E. B., & Neitsch, S. L. (2012). Soil and water assessment tool input/output file documentation: version 2012 (vol. 436). Texas Water Resources Institute.
- Arsanjani, J. J., Kainz, W., & Mousivand, A. J. (2011). Tracking dynamic land-use change using spatially explicit Markov Chain based on cellular automata: The case of Tehran. International Journal of Image and Data Fusion, 2(4), 329–345. https://doi.org/10.1080/19479832.2011.605397
- Ayele, H. S., Li, M.-H., & Tung, C.-P. (2016). Assessing climate change impact on Gilgel Abbay and Gumara watershed hydrology, the Upper Blue Nile Basin, Ethiopia. Terrestrial, Atmospheric & Oceanic Sciences, 27,1005–1018. https://doi.org/10.3319/TAO.2016.07.30.01
- Ayivi, F., & Jha, M. K. (2018). Estimation of water balance and water yield in the Reedy Fork-Buffalo Creek watershed in North Carolina using SWAT. International Soil and Water Conservation Research, 6(3), 203–213. https://doi.org/10.1016/j.iswcr.2018.03.007
- Aylward, B. (2005). Land use, hydrological function and economic valuation, forests, water and people in the humid tropics: Past, present and future hydrological research for integrated land and water management. International Hydrology Series. Cambridge University Press, pp. 99–120.
- BCEOM. (1998). Abbay river basin integrated development master plan project, phase 2, data collection and site-investigation survey and analysis, section II, sectoral studies.
- Belay, T., & Mengistu, D. A. (2019). Land use and land cover dynamics and drivers in the Muga watershed, Upper Blue Nile basin, Ethiopia. Remote Sensing Applications: Society and Environment, 15, 100249. https://doi.org/10.1016/j.rsase.2019.100249
- Belay, T., & Mengistu, D. A. (2021). Impacts of land use/land cover and climate changes on soil erosion in Muga watershed, Upper Blue Nile basin (Abay), Ethiopia. Ecological Processes, 10(1), 1–23. https://doi.org/10.1186/s13717-021-00339-9
- Belihu, M., Tekleab, S., Abate, B., & Bewket, W. (2020). Hydrologic response to land use land cover change in the upper Gidabo watershed, Rift Valley Lakes basin, Ethiopia. HydroResearch, 3, 85–94. https://doi.org/10.1016/j.hydres.2020.07.001
- Benegas, L., Ilstedt, U., Roupsard, O., Jones, J., & Malmer, A. (2014). Effects of trees on infiltrability and preferential flow in two contrasting agroecosystems in Central America. Agriculture, Ecosystems & Environment, 183, 185–196. https://doi.org/10.1016/j.agee.2013.10.027
- Berhane, A., Hadgu, G., Worku, W., & Abrha, B. (2020). Trends in extreme temperature and rainfall indices in the semi-arid areas of Western Tigray, Ethiopia. Environmental Systems Research, 9(1), 1–20. https://doi.org/10.1186/s40068-020-00165-6
- Berihun, M. L., Tsunekawa, A., Haregeweyn, N., Meshesha, D. T., Adgo, E., Tsubo, M., Masunaga, T., Fenta, A. A., Sultan, D., Yibeltal, M., & Ebabu, K. (2019). Hydrological responses to land use/land cover change and climate variability in contrasting agro-ecological environments of the Upper Blue Nile basin, Ethiopia. The Science of the Total Environment, 689, 347–365. https://doi.org/10.1016/j.scitotenv.2019.06.338
- Betrie, G. D., Mohamed, Y. A., van Griensven, A., & Srinivasan, R. (2011). Sediment management modelling in the Blue Nile Basin using SWAT model. Hydrology and Earth System Sciences, 15(3), 807–818. https://doi.org/10.5194/hess-15-807-2011
- Bewket, W., & Sterk, G. (2005). Dynamics in land cover and its effect on stream flow in the Chemoga watershed, Blue Nile basin, Ethiopia. Hydrological Processes, 19(2), 445–458. https://doi.org/10.1002/hyp.5542
- Bewket, W., & Teferi, E. (2009). Assessment of soil erosion hazard and prioritization for treatment at the watershed level: Case study in the Chemoga watershed, Blue Nile basin, Ethiopia. Land Degradation & Development, 20(6), 609–622. https://doi.org/10.1002/ldr.944
- Birhanu, A., Masih, I., van der Zaag, P., Nyssen, J., & Cai, X. (2019). Impacts of land use and land cover changes on hydrology of the Gumara catchment, Ethiopia. Physics and Chemistry of the Earth, Parts A/B/C, 112, 165–174. https://doi.org/10.1016/j.pce.2019.01.006
- Breiman, L. (2001). Random forests. Machine Learning, 45(1), 5–32. https://doi.org/10.1023/A:1010933404324
- Chanapathi, T., & Thatikonda, S. (2020). Investigating the impact of climate and land-use land cover changes on hydrological predictions over the Krishna river basin under present and future scenarios. The Science of the Total Environment, 721, 137736. https://doi.org/10.1016/j.scitotenv.2020.137736
- Chemura, A., Rwasoka, D., Mutanga, O., Dube, T., & Mushore, T. (2020). The impact of land-use/land cover changes on water balance of the heterogeneous Buzi sub-catchment, Zimbabwe. Remote Sensing Applications: Society and Environment, 18, 100292. https://doi.org/10.1016/j.rsase.2020.100292
- Congalton, R. G., & Green, K. (2019). Assessing the accuracy of remotely sensed data: principles and practices. CRC press.
- Cousino, L. K., Becker, R. H., & Zmijewski, K. A. (2015). Modeling the effects of climate change on water, sediment, and nutrient yields from the Maumee River watershed. Journal of Hydrology: Regional Studies, 4, 762–775. https://doi.org/10.1016/j.ejrh.2015.06.017
- Demessie, E. T. (2015). Soil hydrological impacts and climatic controls of land use and land cover changes in the Upper Blue Nile (Abay) basin. CRC Press.
- Demissie, F., Yeshitila, K., Kindu, M., & Schneider, T. (2017). Land use/Land cover changes and their causes in Libokemkem District of South Gonder, Ethiopia. Remote Sensing Applications: Society and Environment, 8, 224–230. https://doi.org/10.1016/j.rsase.2017.10.001
- Dile, Y. T., Berndtsson, R., & Setegn, S. (2013). Hydrological response to climate change for Gilgel Abay River, in the Lake Tana basin-upper Blue Nile basin of Ethiopia. PLOS One. 8(10), e79296. https://doi.org/10.1371/journal.pone.0079296
- Fan, M., & Shibata, H. (2015). Simulation of watershed hydrology and stream water quality under land use and climate change scenarios in Teshio River watershed, northern Japan. Ecological Indicators, 50, 79–89. https://doi.org/10.1016/j.ecolind.2014.11.003
- Ficklin, D. L., Luo, Y., Luedeling, E., & Zhang, M. (2009). Climate change sensitivity assessment of a highly agricultural watershed using SWAT. Journal of Hydrology, 374(1–2), 16–29. https://doi.org/10.1016/j.jhydrol.2009.05.016
- Foody, G. M., & Mathur, A. (2004). Toward intelligent training of supervised image classifications: Directing training data acquisition for SVM classification. Remote Sensing of Environment, 93(1–2), 107–117. https://doi.org/10.1016/j.rse.2004.06.017
- Gashaw, T., Tulu, T., Argaw, M., & Worqlul, A. W. (2018). Modeling the hydrological impacts of land use/land cover changes in the Andassa watershed, Blue Nile Basin, Ethiopia. The Science of the Total Environment, 619-620, 1394–1408. https://doi.org/10.1016/j.scitotenv.2017.11.191
- Gebre, S. L., & Ludwig, F. (2015). Hydrological response to climate change of the upper Blue Nile River Basin: Based on IPCC fifth assessment report (AR5). Journal of Climatology & Weather Forecasting, 3, 1–15.
- Gebremicael, T. G., Mohamed, Y. A., Betrie, G. D., Van der Zaag, P., & Teferi, E. (2013). Trend analysis of runoff and sediment fluxes in the Upper Blue Nile basin: A combined analysis of statistical tests, physically-based models and landuse maps. Journal of Hydrology, 482, 57–68. https://doi.org/10.1016/j.jhydrol.2012.12.023
- Gessesse, B., Bewket, W., & Bräuning, A. (2015). Model-based characterization and monitoring of runoff and soil erosion in response to land use/land cover changes in the Modjo watershed, Ethiopia. Land Degradation & Development, 26(7), 711–724. https://doi.org/10.1002/ldr.2276
- Gidey, E., Dikinya, O., Sebego, R., Segosebe, E., & Zenebe, A. (2017). Cellular automata and Markov Chain (CA_Markov) model-based predictions of future land use and land cover scenarios (2015–2033) in Raya, northern Ethiopia. Modeling Earth Systems and Environment, 3(4), 1245–1262. https://doi.org/10.1007/s40808-017-0397-6
- Gizaw, M. S., Biftu, G. F., Gan, T. Y., Moges, S. A., & Koivusalo, H. (2017). Potential impact of climate change on streamflow of major Ethiopian rivers. Climatic Change, 143(3–4), 371–383. https://doi.org/10.1007/s10584-017-2021-1
- Glavan, M., & Pintar, M. (2012). Strengths, weaknesses, opportunities and threats of catchment modelling with Soil and Water Assessment Tool (SWAT) model. Water Resources Management and Modeling, 39–64.
- Gorelick, N., Hancher, M., Dixon, M., Ilyushchenko, S., Thau, D., & Moore, R. (2017). Google Earth Engine: Planetary-scale geospatial analysis for everyone. Remote Sensing of Environment, 202, 18–27. https://doi.org/10.1016/j.rse.2017.06.031
- Halmy, M. W. A., Gessler, P. E., Hicke, J. A., & Salem, B. B. (2015). Land use/land cover change detection and prediction in the north-western coastal desert of Egypt using Markov-CA. Applied Geography, 63, 101–112. https://doi.org/10.1016/j.apgeog.2015.06.015
- Hishe, S., Bewket, W., Nyssen, J., & Lyimo, J. (2020). Analysing past land use land cover change and CA-Markov-based future modelling in the Middle Suluh Valley, Northern Ethiopia. Geocarto International, 35(3), 225–255. https://doi.org/10.1080/10106049.2018.1516241
- Hu, Y., & Hu, Y. (2019). Land cover changes and their driving mechanisms in Central Asia from 2001 to 2017 supported by Google Earth Engine. Remote Sensing, 11(5), 554. https://doi.org/10.3390/rs11050554
- Hurni, H. (1998). Agroecologial belts of Ethiopia: Explanatory notes on three maps at a scale of 1:1,000,000. Soil conservation research program of Ethiopia. Addis Abeba.
- Jin, K., Cornelis, W. M., Gabriels, D., Schiettecatte, W., De Neve, S., Lu, J., Buysse, T., Wu, H., Cai, D., Jin, J., & Harmann, R. (2008). Soil management effects on runoff and soil loss from field rainfall simulation. CATENA, 75(2), 191–199. https://doi.org/10.1016/j.catena.2008.06.002
- Jury, M. R., & Funk, C. (2013). Climatic trends over Ethiopia: regional signals and drivers. International Journal of Climatology, 33(8), 1924–1935. https://doi.org/10.1002/joc.3560
- Kim, U., & Kaluarachchi, J. J. (2009). Climate change impacts on water resources in the Upper Blue Nile River Basin, Ethiopia. Journal of the American Water Resources Association, 45(6), 1361–1378. https://doi.org/10.1111/j.1752-1688.2009.00369.x
- Kiros, G., Shetty, A., & Nandagiri, L. (2016). Analysis of variability and trends in rainfall over northern Ethiopia. Arabian Journal of Geosciences, 9(6), 451. https://doi.org/10.1007/s12517-016-2471-1
- Kurukulasuriya, P., & Rosenthal, S. (2013). Climate change and agriculture : A review of impacts and adaptations. World Bank.
- Luo, J., Liu, Y., Zhang, s., & Liang, J. (2021). Extreme random forest method for machine fault classification. Measurement Science and Technology, 32(11), 114006. https://doi.org/10.1088/1361-6501/ac14f5
- Magidi, J., Nhamo, L., Mpandeli, S., & Mabhaudhi, T. (2021). Application of the random forest classifier to map irrigated areas using Google Earth Engine. Remote Sensing, 13(5), 876. https://doi.org/10.3390/rs13050876
- Marhaento, H., Booij, M. J., & Hoekstra, A. Y. (2018). Hydrological response to future land-use change and climate change in a tropical catchment. Hydrological Sciences Journal, 63(9), 1368–1385. https://doi.org/10.1080/02626667.2018.1511054
- Mekonnen, D. F., Duan, Z., Rientjes, T., & Disse, M. (2018). Analysis of combined and isolated effects of land-use and land-cover changes and climate change on the upper Blue Nile River basin’s streamflow. Hydrology and Earth System Sciences, 22(12), 6187–6207. https://doi.org/10.5194/hess-22-6187-2018
- Melaku, N. D., Renschler, C. S., Holzmann, H., Strohmeier, S., Bayu, W., Zucca, C., Ziadat, F., & Klik, A. (2018). Prediction of soil and water conservation structure impacts on runoff and erosion processes using SWAT model in the northern Ethiopian highlands. Journal of Soils and Sediments, 18(4), 1743–1755. https://doi.org/10.1007/s11368-017-1901-3
- Mengistu, D., Bewket, W., Dosio, A., & Panitz, H.-J. (2021). Climate change impacts on water resources in the Upper Blue Nile (Abay) River Basin, Ethiopia. Journal of Hydrology, 592, 125614. https://doi.org/10.1016/j.jhydrol.2020.125614
- Mondal, M., Sharma, N., Garg, P. K., & Kappas, M. (2016). Statistical independence test and validation of CA Markov land use land cover (LULC) prediction results. The Egyptian Journal of Remote Sensing and Space Science, 19(2), 259–272. https://doi.org/10.1016/j.ejrs.2016.08.001
- Moriasi, D. N., Arnold, J. G., Van Liew, M. W., Bingner, R. L., Harmel, R. D., & Veith, T. L. (2007). Model evaluation guidelines for systematic quantification of accuracy in watershed simulations. Transactions of the ASABE, 50, 885–900.
- Nkonya, E., Mirzabaev, A., & Braun, J. V. (2016). Economics of land degradation and improvement–a global assessment for sustainable development. Springer Nature.
- NMA. (2007). Climate change national adaptation programme of action (NAPA) of Ethiopia., Addis Ababa.
- Pan, S., Liu, D., Wang, Z., Zhao, Q., Zou, H., Hou, Y., Liu, P., & Xiong, L. (2017). Runoff Responses to Climate and Land Use/Cover Changes under Future Scenarios. Water, 9(7), 475. https://doi.org/10.3390/w9070475
- Perry, M., & Hollis, D. (2005). The development of a new set of long-term climate averages for the UK. International Journal of Climatology, 25(8), 1023–1039. https://doi.org/10.1002/joc.1160
- Pontius, R. G. (2002). Statistical methods to partition effects of quantity and location during comparison of categorical maps at multiple resolutions. Photogrammetric Engineering and Remote Sensing, 68, 1041.
- Richards, J. A., & Richards, J. A. (1999). Remote sensing digital image analysis. Springer.
- Ridwansyah, I., Yulianti, M., Onodera, S.-I., Shimizu, Y., Wibowo, H., Fakhrudin, M., & Apip, A. (2020). The impact of land use and climate change on surface runoff and groundwater in Cimanuk watershed, Indonesia. Limnology, 21(3), 487–498. https://doi.org/10.1007/s10201-020-00629-9
- Rogger, M., Agnoletti, M., Alaoui, A., Bathurst, J. C., Bodner, G., Borga, M., Chaplot, V., Gallart, F., Glatzel, G., Hall, J., Holden, J., Holko, L., Horn, R., Kiss, A., Kohnová, S., Leitinger, G., Lennartz, B., Parajka, J., Perdigão, R., … Blöschl, G. (2017). Land use change impacts on floods at the catchment scale: Challenges and opportunities for future research. Water Resources Research, 53(7), 5209–5219. https://doi.org/10.1002/2017WR020723
- Safriel, U. N. (2007). The Assessment of Global Trends in Land Degradation. In M. V. K. Sivakumar, N. Ndiang’ui (Eds.), Climate and Land Degradation. Environmental Science and Engineering. Springer, Berlin, Heidelberg. https://doi.org/10.1007/978-3-540-72438-4_1
- Santos, D., Cardoso-Fernandes, J., Lima, A., Müller, A., Brönner, M., & Teodoro, A. C. (2022). Spectral analysis to improve inputs to random forest and other boosted ensemble tree-based algorithms for detecting NYF Pegmatites in Tysfjord, Norway. Remote Sensing, 14(15), 3532. https://doi.org/10.3390/rs14153532
- Schneiderman, E. M., Steenhuis, T. S., Thongs, D. J., Easton, Z. M., Zion, M. S., Neal, A. L., Mendoza, G. F., & Todd Walter, M. (2007). Incorporating variable source area hydrology into a curve-number-based watershed model. Hydrological Processes, 21(25), 3420–3430. https://doi.org/10.1002/hyp.6556
- SCS. (1972). National engineering handbook: Section 4: Hydrology. USDA Washington.
- Setegn, S., Melesse, A. M., Rayner, D., & Dargahi, B. (2014). Climate change impact on water resources and adaptation strategies in the Blue Nile River Basin (pp. 389–404). Nile River Basin, Springer.
- Sharpley, A. N., & Williams, J. R. (1990). EPIC-erosion/productivity impact calculator. I: Model documentation. II: User manual. Technical Bulletin-United States Department of Agriculture.
- Shawul, A. A., Chakma, S., & Melesse, A. M. (2019). The response of water balance components to land cover change based on hydrologic modeling and partial least squares regression (PLSR) analysis in the Upper Awash Basin. Journal of Hydrology: Regional Studies, 26, 100640. https://doi.org/10.1016/j.ejrh.2019.100640
- Shrestha, B., Cochrane, T. A., Caruso, B. S., & Arias, M. E. (2018). Land use change uncertainty impacts on streamflow and sediment projections in areas undergoing rapid development: A case study in the Mekong Basin. Land Degradation & Development, 29(3), 835–848. https://doi.org/10.1002/ldr.2831
- Simane, B., Zaitchik, B. F., & Ozdogan, M. (2013). Agroecosystem analysis of the Choke Mountain watersheds, Ethiopia. Sustainability, 5(2), 592–616. https://doi.org/10.3390/su5020592
- Singh, S. K., Mustak, S., Srivastava, P. K., Szabó, S., & Islam, T. (2015). Predicting spatial and decadal LULC changes through cellular automata Markov chain models using earth observation datasets and geo-information. Environmental Processes, 2(1), 61–78. https://doi.org/10.1007/s40710-015-0062-x
- Stocker, T., Qin, D., Plattner, G.-K., Tignor, M., Allen, S. K., Boschung, J., Nauels, A., Xia, Y., Bex, V., & Midgley, P. M. (2013). Climate change 2013: The physical science basis. Contribution of working group I to the fifth assessment report of the intergovernmental panel on climate change. Cambridge university press Cambridge.
- Swain, S. S., Mishra, A., Sahoo, B., & Chatterjee, C. (2020). Water scarcity-risk assessment in data-scarce river basins under decadal climate change using a hydrological modelling approach. Journal of Hydrology, 590, 125260. https://doi.org/10.1016/j.jhydrol.2020.125260
- Talib, A., & Randhir, T. O. (2017). Climate change and land use impacts on hydrologic processes of watershed systems. Journal of Water and Climate Change, 8(3), 363–374. https://doi.org/10.2166/wcc.2017.064
- Taye, M. T., Willems, P., & Block, P. (2015). Implications of climate change on hydrological extremes in the Blue Nile basin: A review. Journal of Hydrology: Regional Studies, 4, 280–293. https://doi.org/10.1016/j.ejrh.2015.07.001
- Teferi, E., Bewket, W., Uhlenbrook, S., & Wenninger, J. (2013). Understanding recent land use and land cover dynamics in the source region of the Upper Blue Nile, Ethiopia: Spatially explicit statistical modeling of systematic transitions. Agriculture, Ecosystems & Environment, 165, 98–117. https://doi.org/10.1016/j.agee.2012.11.007
- Teklay, A., Dile, Y. T., Asfaw, D. H., Bayabil, H. K., & Sisay, K. (2021). Impacts of climate and land use change on hydrological response in Gumara Watershed, Ethiopia. Ecohydrology & Hydrobiology, 21(2), 315–332. https://doi.org/10.1016/j.ecohyd.2020.12.001
- Tekleab, S., Mohamed, Y., & Uhlenbrook, S. (2013). Hydro-climatic trends in the Abay/Upper Blue Nile basin, Ethiopia. Physics and Chemistry of the Earth, Parts A/B/C, 61–62, 32–42. https://doi.org/10.1016/j.pce.2013.04.017
- Tekleab, S., Mohamed, Y., Uhlenbrook, S., & Wenninger, J. (2014). Hydrologic responses to land cover change: The case of Jedeb mesoscale catchment, Abay/Upper Blue Nile basin, Ethiopia. Hydrological Processes, 28(20), 5149–5161. https://doi.org/10.1002/hyp.9998
- Teklesadik, A. D., Alemayehu, T., Van Griensven, A., Kumar, R., Liersch, S., Eisner, S., Tecklenburg, J., Ewunte, S., & Wang, X. (2017). Inter-model comparison of hydrological impacts of climate change on the Upper Blue Nile basin using ensemble of hydrological models and global climate models. Climatic Change, 141(3), 517–532. https://doi.org/10.1007/s10584-017-1913-4
- Teutschbein, C., & Seibert, J. (2012). Bias correction of regional climate model simulations for hydrological climate-change impact studies: Review and evaluation of different methods. Journal of Hydrology, 456–457, 12–29. https://doi.org/10.1016/j.jhydrol.2012.05.052
- van Vuuren, D. P., Edmonds, J., Kainuma, M., Riahi, K., Thomson, A., Hibbard, K., Hurtt, G. C., Kram, T., Krey, V., Lamarque, J.-F., Masui, T., Meinshausen, M., Nakicenovic, N., Smith, S. J., & Rose, S. K. (2011). The representative concentration pathways: An overview. Climatic Change, 109(1–2), 5–31. https://doi.org/10.1007/s10584-011-0148-z
- Woldesenbet, T. A., Elagib, N. A., Ribbe, L., & Heinrich, J. (2017). Hydrological responses to land use/cover changes in the source region of the Upper Blue Nile Basin, Ethiopia. The Science of the Total Environment, 575, 724–741. https://doi.org/10.1016/j.scitotenv.2016.09.124
- Woldesenbet, T. A., Elagib, N. A., Ribbe, L., & Heinrich, J. (2018). Catchment response to climate and land use changes in the Upper Blue Nile sub-basins, Ethiopia. The Science of the Total Environment, 644, 193–206. https://doi.org/10.1016/j.scitotenv.2018.06.198
- Worku, G., Teferi, E., Bantider, A., Dile, Y. T., & Taye, M. T. (2018). Evaluation of regional climate models performance in simulating rainfall climatology of Jemma sub-basin, Upper Blue Nile Basin, Ethiopia. Dynamics of Atmospheres and Oceans, 83, 53–63. https://doi.org/10.1016/j.dynatmoce.2018.06.002
- Worqlul, A. W., Ayana, E. K., Yen, H., Jeong, J., MacAlister, C., Taylor, R., Gerik, T. J., & Steenhuis, T. S. (2018). Evaluating hydrologic responses to soil characteristics using SWAT model in a paired-watersheds in the Upper Blue Nile Basin. Catena, 163, 332–341. https://doi.org/10.1016/j.catena.2017.12.040
- Xiong, J., Thenkabail, P. S., Tilton, J. C., Gumma, M. K., Teluguntla, P., Oliphant, A., Congalton, R. G., Yadav, K., & Gorelick, N. (2017). Nominal 30-m cropland extent map of continental Africa by integrating pixel-based and object-based algorithms using Sentinel-2 and Landsat-8 data on Google Earth Engine. Remote Sensing, 9(10), 1065. https://doi.org/10.3390/rs9101065
- Yan, R., Huang, J., Wang, Y., Gao, J., & Qi, L. (2016). Modeling the combined impact of future climate and land use changes on streamflow of Xinjiang Basin, China. Hydrology Research, 47(2), 356–372. https://doi.org/10.2166/nh.2015.206