
 ?Mathematical formulae have been encoded as MathML and are displayed in this HTML version using MathJax in order to improve their display. Uncheck the box to turn MathJax off. This feature requires Javascript. Click on a formula to zoom.
Abstract
Urban agriculture has gained increasing attention in recent years as a strategy for addressing food security, climate change, and sustainable development challenges in urban areas. However, the spatial pattern and distribution of urban farms and their consequential implications for climate change adaptation have received limited attention in both theory and practice. The study employed a mixed-methods research approach. Geospatial data was collected using the Global Positioning System. The average nearest neighbour (ANN) ratio analysis was done to determine the spatial distribution pattern of urban farms and was supplemented with 12 key informant interviews. The results showed that the rearing of animals—cattle, goats, sheep, and poultry—is clustered across the urban neighbourhood. Also, while keeping animals in open spaces distribution is dispersed, keeping animals in walls roofed with zinc and wooden structures roofed with zinc are clustered within the urban space. Interestingly, the distribution of urban farm sizes portrayed a clustered pattern across space. The results imply that the spatial pattern and distribution of urban farms are influenced by climate change adaptation measures, leading to potential shifts in agricultural practices, land use, and resource allocation within urban areas. Knowledge of the characteristics and distribution of urban farms is pertinent for policymakers and practitioners to focus attention on addressing climate change adaptation strategies and promoting sustainable development. Integration of urban agriculture into land use planning and zoning by the Town and Country Planning Department in Ghana is recommended.
REVIEWING EDITOR:
1. Introduction
Globally, urban agriculture has gained significant attention in recent years as a means of addressing food security, environmental sustainability, and social equity challenges (Meenar, Citation2017). Urban agriculture, which is agricultural operations located within cities, has emerged as a viable means to meet urban food demand through crop cultivation and the raising of animals within urban areas (Cheng et al., Citation2022). However, the spatial pattern and distribution of urban agricultural production activities and the implications of climate change have gained less attention in both theory and practice. As cities continue to expand and populations grow, the need for locally sourced and fresh produce becomes increasingly important. Furthermore, the continued expansion of cities determines the locations of urban agricultural activities with dynamics across urban zones. Examining the location, size, and arrangement of these farms, researchers can gain insights into the factors influencing their establishment and success amidst climatic stressors (Jaatinen et al., Citation2021). This information can inform urban planning strategies, resource allocation, and policy development to support the growth of urban farming initiatives. This study adopted the definition of urban agriculture by the FAO (Citation2020) to represent the cultivation of crops and raising of farm animals in small urban spaces for own consumption or sale for income.
The spatial pattern of urban farms refers to how they are distributed across the urban landscape. In addition, urban agricultural activity distribution encompasses factors such as proximity to residential areas, availability of land, zoning regulations, and accessibility to markets (Feldt et al., Citation2020). Understanding this pattern helps identify clusters or concentrations of urban farms, as well as areas where they may be lacking (Osman et al., Citation2018). One common spatial pattern observed in urban farming is the presence of rooftop gardens or greenhouses on buildings in densely populated areas (Wood et al., Citation2021). The spatial pattern and distribution of urban farms can vary greatly depending on factors such as urban density, land availability, and local climate. For example, urban farms may be more prevalent in densely populated areas with limited land availability, such as cities with high population densities and limited green spaces (Cattivelli, Citation2020). In these areas, urban farms may be more likely to take the form of rooftop gardens, vertical farms, or other forms of intensive agriculture that maximize space usage (Khan et al., Citation2018). In contrast, urban farms in less densely populated areas may be more likely to take the form of community gardens or market gardens, which may be more extensive but less intensive in terms of land use (Halvey et al., 2020). The distribution of urban farms can also be influenced by factors such as access to water, soil quality, and local climate. For example, urban farms in areas with limited water availability may be more likely to focus on drought-tolerant crops or use water-saving technologies (Tapia et al., Citation2021).
In the context of Ghana, urban agriculture is known to occur in various forms and locations within cities across Ghana. The spatial distribution pattern of urban agricultural activities in Ghana tends to be influenced by factors such as land availability, accessibility to water sources, proximity to markets, and land tenure arrangements (Akoto-Danso et al., Citation2019). Therefore, emphasizing the importance of considering local contexts and land-use dynamics in understanding the spatial patterns of urban agriculture (Karg et al., Citation2020). Again, rapid urbanization resulting from an increasing population migrating to cities in search of better economic opportunities and surroundings affects urban agricultural activities (Diehl et al., Citation2020). This urban growth has led to the expansion of built-up areas, resulting in the loss of agricultural land to highly profitable competing land uses (Ali et al., Citation2019; Tang et al., Citation2020). However, there are urban planning policies such as the Land Use and Spatial Planning Act, of 2016 (Act 925) and the Land Act 2020 (ACT 1036) which spell out two categories of land ownership in Ghana: public and private. Even though these laws are decentralized to the Metropolitan, Municipal, and District Assemblies (MMDAs) to implement by giving permits to developmental establishments, urban agricultural production has no space in these frameworks. However, amidst this urban transformation, urban farming has emerged as a vital component of the urban landscape in meeting urban food demands (Omondi et al., Citation2017). Urban agriculture in Ghana is characterized by its diverse forms and sizes, ranging from small backyard gardens to larger-scale commercial operations (Campbell et al., Citation2022). These farms play a crucial role in providing fresh produce, reducing food miles, and enhancing local food security. Understanding the spatial pattern and distribution of urban farms is essential for effective urban planning and resource allocation. The overall outcome will be the identification of areas with high potential for agricultural activities within cities and guide policymakers in formulating strategies to support and promote urban farming (Halvey et al., Citation2020).
Undoubtedly, the spatial spread and location of urban agricultural activities have implications on farmers’ climate change adaptation measures (Rojas-downing et al., Citation2017). Ghana of late is experiencing rapid urbanization and climate change poses significant challenges, understanding the spatial pattern and distribution of urban farms becomes crucial for effective urban planning and resilience-building efforts (Langemeyer et al., Citation2021). For this work, Climate change refers to long-term alterations in global temperature and weather patterns (Hallegatte et al., Citation2020). The spatial pattern and distribution of urban farms can have important implications for climate change adaptation. For example, the spatial characteristics of urban farms can be favourable for adapting to the impacts of climate change in urban areas (Cheng et al., Citation2022). Furthermore, the implications of climate change on urban farming cannot be overlooked. Ghana is vulnerable to climate change impacts such as increased temperatures, changing rainfall patterns, and extreme weather events (Cheng et al., Citation2022). These changes directly affect agricultural productivity and pose challenges for farmers (Miernicki et al., Citation2018). One of the key aspects of urban farming is its spatial pattern and distribution, which can have important implications for climate change adaptation (Gaughan et al., Citation2019). Understanding the current state of knowledge on urban agriculture spatial patterns and climate change outcomes, urban planners and policymakers can better support the development of urban agricultural initiatives that can help to address the challenges of climate change in urban areas (Langemeyer et al., Citation2021). In this sense, the spatial pattern and distribution of urban farms can have significant implications for their effectiveness in addressing climate change. Understanding the spatial pattern and distribution of urban farms facilitates the development of targeted climate change adaptation strategies by identifying areas most vulnerable to environmental stressors, optimizing resource allocation, and promoting resilience in urban agricultural production.
There are scholarly works on the urban agriculture contributions to urban food demand and urban livelihoods (Langemeyer et al., Citation2021; Payen et al., Citation2022; Shackleton et al., Citation2021) and the spatial characterization of urban agricultural production (Al-Kofahi et al., Citation2019; Kirsch et al., Citation2022; Mack et al., Citation2017). For instance, Mack et al. (Citation2017) investigated factors influencing the location of urban agricultural activities, Al-Kofahi et al. (Citation2019) researched the type of urban agricultural activities and Kirsch et al. (Citation2022) worked on marketing of urban agricultural produce. However, extant remains silent on the relationship between the spatial distribution of urban farms and the implications on urban farmers’ climate change adaptation strategies. Therefore, this study seeks to achieve the following objectives; (1) to analyze the pattern and distribution of urban crop production and its climate change adaption implications in urban Ghana and (2) to analyze the distribution and pattern of urban animal production in urban Ghana.
The paper contributes to the urban agriculture literature by demonstrating how urban crops and animal production distribution patterns influence urban farmers’ climate change adaptation strategies. Overall, the paper contributes to the attainment of sustainable development goal (SDG) 2—no hunger in Ghana and other developing countries.
2. Review of empirical literature
2.1. Spatial pattern and influencing factors of distributions
The distribution of urban farms refers to their arrangement across different neighbourhoods or regions within a city. It considers social, economic, and environmental factors that influence where these farms are established. Understanding the distribution helps identify disparities in access to fresh produce and opportunities for community engagement. The distribution of urban farms is influenced by various factors, including income levels, land availability, community engagement, and local policies (Anderson et al., Citation2017). In some cases, urban farms may be concentrated in low-income neighbourhoods where access to fresh produce is limited. These farms can serve as a means to address food insecurity and provide economic opportunities for residents. Several factors influence the spatial pattern and distribution of urban farms. The first is the issue of land availability. The availability of suitable land within urban areas is a critical factor in determining where urban farms can be established. Factors such as land prices, zoning regulations, and land use policies play a role in shaping the distribution of these farms (Osman et al., Citation2018). Another factor is the market demand for urban agricultural produce. The proximity to markets and consumers is an important consideration for urban farmers. Being close to potential customers reduces transportation costs and ensures the freshness of produce.
As a result, urban farms tend to cluster around areas with high market demand, such as restaurants, farmers’ markets, and grocery stores (Echendu, Citation2020). Also, community engagement is vital in urban agricultural production distribution across urban space. The involvement and support of local communities are crucial for the success of urban farming initiatives (Siegner et al., Citation2018). Neighbourhoods with active community organizations or strong social networks are more likely to have a higher number of urban farms. Community gardens, in particular, rely on local participation and collaboration. Lastly, policy and regulations define the distribution of urban agricultural activities. Local government policies and regulations can either facilitate or hinder the establishment of urban farms. Zoning laws, permits, and incentives can influence where and how urban farming activities are conducted. Supportive policies that prioritize sustainable agriculture and promote access to fresh produce can encourage the distribution of urban farms across different neighbourhoods (Payen et al., Citation2022).
2.2. Spatial distribution of urban agricultural activities and climate change implications
The spatial patterns of urban agriculture are influenced by various factors such as land availability, zoning regulations, community initiatives, and market demand. Mapping the spatial distribution of urban agriculture involves identifying areas within the city where agricultural activities are prevalent (Rich et al., 2018). This can be achieved through Geographic Information Systems (GIS) mapping, which allows for the visualization of urban agriculture hotspots, land use patterns, and potential areas for expansion. The spatial distribution of urban agricultural activities is intricately linked to climate change implications (Skendžić et al., 2021). As climate change continues to impact growing conditions, food demand, and adaptation strategies, the spatial distribution of urban agriculture is likely to evolve in response to these challenges. Urban agricultural activities are distributed across various spatial scales, influenced by factors such as land availability, zoning regulations, community initiatives, and economic considerations. In the context of climate change, urban agriculture plays a significant role in enhancing food security, reducing greenhouse gas emissions, and mitigating the urban heat island effect (Peng et al., 2020) The spatial distribution of urban agricultural activities is influenced by climate change implications in several ways.
One of the key implications of climate change on the spatial distribution of urban agricultural activities is the shift in suitable growing areas (Ferreira et al., 2018). As temperatures rise and precipitation patterns change, traditional agricultural regions may become less viable for certain crops. Additionally, climate change impacts such as extreme weather events and water scarcity may prompt urban farmers to seek out more resilient growing methods and technologies, influencing the spatial distribution of agricultural activities within urban areas. Furthermore, climate change can also affect the demand for locally grown produce, influencing the spatial distribution of urban agricultural activities. As awareness of the environmental impact of food transportation grows and concerns about food security in the face of climate-related disruptions increase, there may be a greater emphasis on local food production. This could lead to an expansion of urban agricultural activities across different neighbourhoods and communities within cities, altering their spatial distribution (Siegner et al., Citation2018). Urban green spaces created through agricultural activities can help mitigate the urban heat island effect by reducing surface temperatures and improving air quality (Ferreira et al., 2018). Additionally, practices such as composting and agroforestry in urban agriculture can sequester carbon and contribute to overall greenhouse gas reduction efforts.
2.3. Conceptual framework
Creating a conceptual framework for the spatial pattern and distribution of urban agriculture and farmers’ climate change adaptation strategies involves understanding the complex interactions between urban environments, agricultural practices, and climate change impacts. The location of urban agricultural activities is the interplay between urban planning policies and urban agriculture stakeholders. Urban farmer climate change adaptation strategies are linked to the location of an urban agricultural activity. In making urban agricultural production sustainable, there is a need to take proactive measures in urban farm locations and the type of climate change adaptation measures (see ).
Figure 1. Conceptual framework for the spatial distribution of urban agricultural activities and farmers climate change adaptation strategies. Source: Authors Construct, 2023.
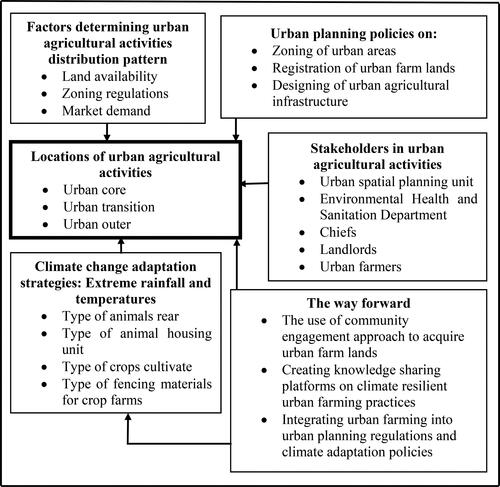
The location and distribution patterns of urban agricultural production in the urban neighbourhood are intertwined. The first one is the availability of cultivable lands, urban zoning regulations, and market demand. Urban agricultural production takes place where land is available, which is defined by the zoning regulations that may influence land availability. Secondly, the application of urban planning policies that integrate urban agricultural production in terms of zoning and registration of lands for urban agriculture infrastructure such as irrigation facilities, markets, and roads to production. The third one is that stakeholder interest affects the distribution of urban agriculture across space. For instance, the interests of the urban spatial planning unit influence the location and distribution of urban agricultural production activities. Also, the work of the environmental health and sanitation department determines where urban agricultural production is supposed to take place and the type of urban agricultural production. The decisions made by land-holding authorities such as landlords and community chiefs also influence where urban farms can be located. Thus, whether they are willing to reserve or sell lands for agricultural production in cities. Urban dweller’s interest in participating in urban agricultural production influences where farms are located. The last is that the climate change adaptation knowledge of farmers within certain areas of cities motivates them to establish productive farms. These could be the knowledge of raising crops and/or animals, the types of crops and animals to be produced, as well as the housing strategies for animal production that will be climate-friendly, which define where urban farms are located in cities. The way forward is to use a community engagement approach to acquire urban farmlands, create knowledge-sharing platforms on climate-resilient urban farming practices, and integrate urban farming into urban planning regulations and climate adaptation policies.
3. Materials and methods
3.1. Study area context
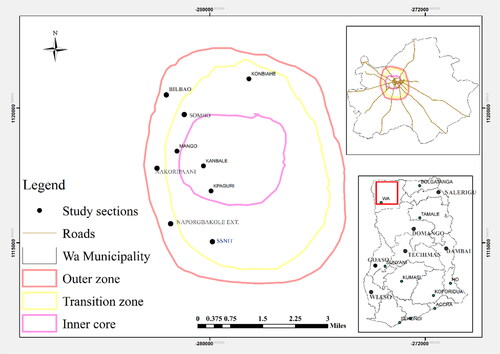
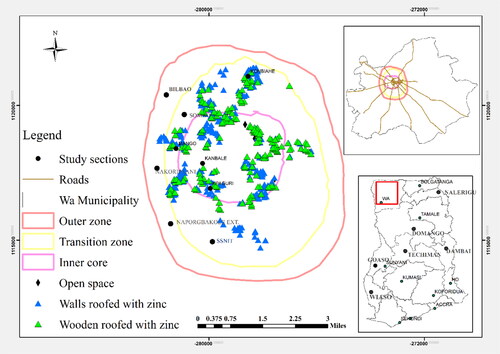
This study took place in the Wa Municipality of Ghana. The municipality lies between latitudes 1°40’N to 2°45’N and longitudes 9°32’ to 10°20’W of the equator covering about 234.74 kilometers square of landmass (Ghana Statistical Service, Citation2021). The topography of the Wa Municipality is undulating with an average height between 160 m and 300 m above sea level (Wa Municipal Assembly, Citation2021). The temperature ranges between 40 °C and 450C. Conversely, the harmattan season increases animal mortality (Ghana Statistical Service, Citation2021). The Wa Municipality has about 200,672 residents with 143,358 urban dwellers (Ghana Statistical Service, Citation2021). Also about of 70% who engage in agricultural activities, only 30.2% are direct food crops and animal producers (Wa Municipal Assembly, Citation2021).
The staple food crops in the municipality are cereals like maize (Zea mays), and millets (Panicum miliaceum) as well as legumes beans (Phaseolus vulgari L.), groundnuts/cowpea (Vigna unguiculata), tomatoes (Solanu lycopersicum), and yams (Dioscorea alata). Animals reared include sheep (Ovis aries), goats (Capra aegagrus hircus), cattle (Bos taurus), and pigs (Sus scrofa domesticus). Other animals also include poultry such as chicken (Gallus gallus domesticus), turkey (Meleagris), ducks (Anatidae), and guinea fowls (Numididae). Most of these animals are reared on a subsistence basis (Ghana Statistical Service, Citation2021). The study was conducted in the Upper West Region of Ghana, particularly Wa Township (See ). The choice of the study area is informed by the fact that many people within the Upper West Region especially, the Wa township mainly derive their livelihood from crop and animal production. Using Osumanu et al. (Citation2019) zonation of the Wa township, the study area was divided into three (3) residential zones; lower (Kanbale, Kpaguri, and Mango), middle (Sombo, Konbiehi, and Social Security and national insurance trust (SSNIT) residential area), and high classes (Naporgbakole, Nakoripaani and Bilbao residential areas) (see ). These zones are having differences in socio-cultural features—the lower class is predominantly indigenous people who are engaged in the informal sector with low monthly income, the middle zone consists of a mixture of indigenous people and settlers, and the higher class zone is dominated by settlers and who are mostly employed by the formal sector and are higher income earning comparatively to the other two zones (Laari et al., Citation2019).
Figure 2. Study area map. Source: Author’s Construct, 2023.
3.2. Research approach and design
From a pragmatic philosophical perspective, this study employed mixed methods of data collection and analysis to understand the patterns and distributions of urban agricultural activities and the implications of climate change adaptation among urban farmers. This approach is meant to give a philosophical line of direction and the research debate (Fijn et al., Citation2020). A cross-sectional concurrent design was followed (Creswell, 2014). The study collected primary data directly from the urban households’ farms within the Wa township. The study zoned the limit of the Wa township and the households were listed. In the listing, 1450 households were obtained. The various types of urban agricultural activities among urban households were mapped within the urban neighborhoods using a Global Positioning System (GPS) device. These activities include crop and animals production. Purposive sampling techniques were used to sample stakeholders in urban agriculture within the locality.
3.3. Data collection, analysis and presentation
In this study, the data collection was in two phases. Phase one deals with spatial data collection and listing of urban households. The spatial data collection techniques were relevant in determining the spatial characteristics of agriculture in the urban setting (Robinson et al., Citation2019; Usmani et al., Citation2020). In phase one, the listing of urban households and taking geographically referenced data on urban households’ urban farm attributes were done. Urban farm sizes were also mapped in the process. The farm characteristics mapped include crop—crop farm sizes and animal production—type of animals and the type of housing units for keeping animals. This was done using a Geographic Positioning System (GPS) device called Garmin etrex 30 GPS. Also, an urban farm attributes template was drawn to aid in categorizing the coordinates according to the farm features. To map the urban farms’ characteristics and distributions, data collection assistants were trained on how to pick the GPS coordinates with the Garmin etrex 30 GPS device and how to fill the farm attributes templates. The spatial coordinates on the urban farm attributes such as the type of crops and animals urban households produce, the crops farm sizes, and the type of housing structures for animals were screened and cleaned. The latitudes and longitudes (XY coordinates) were entered into a Microsoft Excel statistical package converted into decimal degrees and saved in CSV (comma delimited) according to the specific locations. The study used polygon shapefiles of Ghana generated by the Ghana Statistical Service in 2013 where the GPS coordinates on the urban farm attributes were overlaid in ArcGIS 10. 8. The results were generated in the form of maps. This enabled the researchers to explore and appreciate the pattern and distributions of urban farms across the urban neighbourhood.
Furthermore, to analyze the distributions and patterns of the urban agricultural activities across the three different clusters (inner, transition, and outer zones) average nearest neighbour (ANN) ratio analysis was done. The Average Nearest Neighbour (ANN) tool calculates the separation between the centroid locations of each feature and its closest neighbours. The distances between each nearest neighbour are then averaged (Alam et al., Citation2012). The distribution of the features under analysis is said to be clustered if the average distance is less than the average for a fictitious random distribution. The characteristics are said to be distributed if the average distance exceeds a fictitious random distribution. The average nearest-neighbour ratio is determined as the difference between the observed and expected average distances, where the expected average distance is based on a fictitious random distribution with the same number of features covering the same total area (William, Citation1968). Therefore, William (Citation1968) used the nearest neighbour ratio in the analysis of spatial data as stated in the equations below:
(1)
(1)
where
stands for the distance between each observed feature and its nearest neighbor;
(2)
(2)
The the above equation represents the distance of the expected mean for the attributes in a random pattern;
(3)
(3)
In EquationEquation (3)(3)
(3) ,
represents attribute
and its nearest neighbour,
is the total number of attributes and
stands for the minimum closed area or a rectangle around an attribute. In this, the ANN z-score in driving at the statistics is computed as;
(4)
(4)
Where
(5)
(5)
The model implies that if the average nearest neighbour ratio, or index, is smaller than 1, clustering is present in the pattern. The trend is toward dispersion if the index is higher than 1. The average nearest neighbour distance index (1) and z-score (4) equations are based on the presumption that the points being measured are free to locate anywhere within the study area (for instance, there are no obstructions and all cases or features are located independently of one another). The p-value, which is constrained by the test statistic, is a numerical estimate of the area under the curve for a known distribution (Alam et al., Citation2012). The results were presented using the table.
The second phase of the data collection involved in-depth interviews with 12 key informants. This phase is crucial as it helps to understand urban agriculture distribution patterns very well from their perspectives. These key informants were representatives of the Upper West Land Use and Spatial Planning Department (2), representatives from the Wa Municipal Agriculture Department (2), representatives from the Wa Environmental Health and Sanitation Department (2), Chiefs (3) and Landlords (‘Tindaabas’) (3). These are in charge of land sales and documentation within the urban settings which define the locations of urban agricultural production activities including the regulations and supervision of urban agricultural practices. The responses for the interviews were used to triangulate the evidence derived from the spatial analysis to give a better understanding of urban farm locations. The data collection was done using an interview guide and voice recorders. The interview guide was prepared in English Language but in some interviews where the respondents could not understand, English, the local dialect, ‘Dagaare/Waalee’ was used. The recorded voices were transcribed and analyzed based on content and themes. These are themes that are in line with the spatial analysis. The results were presented in the form of narratives, direct quotations from the respondents, and paraphrasing of the responses.
In the study, ethical issues were handled in the following ways; First, introductory letters from the Department of Environment and Resource Management of the Simon Diedong Dombo University of Business and Integrated Development Studies (SDD-UBIDS) were distributed to the community leader and the institutions of the study. Secondly, community entry was done through the community leaders (Assembly Members, Unit Committee Chairpersons, Chiefs, and Landlords). Informed consent was taken from all participants before they took part in data collection. Participation was voluntary and all participants in the study were assured of the secrecy and confidentiality of the information.
4. Results
4.1. Spatial dynamics and distribution of crop farm sizes within the city
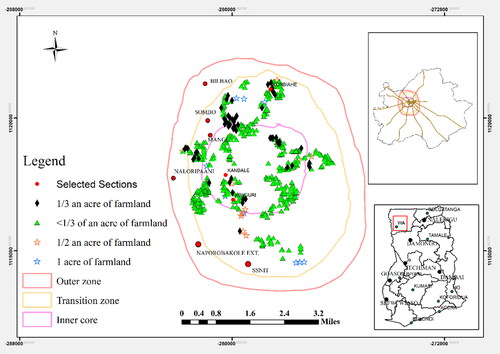
The spatial distribution of farm sizes in urban areas refers to how different sizes of farms are distributed within urban regions. In terms of the spatial distribution of crop production, the plot sizes were analyzed. The size of farm plots was assessed based on plots less than 0.3 an acre, 0.3 of an acre, half an acre, and an acre. To start with, the results from the spatial data exhibited almost equal distributions of farm plots of less than 0.3 acres of land across the city core and the transitional zones.
This pattern to some extent explains the fact that there are limited spaces for cultivation within these areas but residents leverage any small plots that can aid the cultivation of vegetables on a subsistence basis within households (see ). Irrespective of the fact that the transitional zone is less populous than the core, almost every household within this neighbourhood could have at least a piece of land less than 0.3 an acre to cultivate crops for household consumption. Another crucial point to note is that crop production in the urban area on plots of 0.3 of an acre is predominated in the transitional zone of the city. Aside from the transitional zone, there are traces of plots of up to 0.3 of an acre at the less populous zone called the outer core. Also, crop plots with a size of 0.5 of an acre were found to be within the transitional zone of the city.
Figure 3. Spatial distribution of crop farm sizes in urban farming. Source: Field Work, 2023.
From the interviews, the production of crops within the urban area has an association with actors such as the MoFA Crop Departments. This department is critical in the type of fencing urban farmers are to adopt in crop cultivation including the location of urban crop farms in the era of climate change. However, urban farmers have no access to extension services. This is seen more in crop production because mostly the agricultural extension services are tailored towards farmers in the peri-urban and rural parts of the municipality. This is because the urban crop producers are considered to be small scale producers compared with the rural farmers. In line with this, an Officer said:
… We hardly visit people who grow crops within the town because they are into very small scale production and it is very difficult to meet them at home as many of them go to their workplaces. This does not encourage us to provide services to them. (Key informant interview Crop Department, August 2023)
4.2. Spatial dynamics of types of animals within the urban neighbourhood
In understanding the spatial dynamics and pattern of urban farms across the various zones; the inner core, the transitional, and the outer zones, the type of animals’ rear were analyzed. Drawing from the spatial attributes taken, urban dwellers are into more poultry production than any other animals. The production of poultry shows a decreasing pattern from the inner urban core to the outer core through the transitional zones. The results present the understanding that poultry production is likely to be more than any other animals within the inner urban core because less space is needed (see ). Unlike cattle, goat and sheep production which requires large spaces. Therefore, it is not surprising that poultry production concentration grows outwards from the inner to the outer city. Another insight is that urban population density moves from the core to the periphery which is associated with the availability of space enough to raise poultry. Many households within the core, transition to the outer zone mean the possibility of more poultry production all things being equal. Interestingly, the results further portray similar trends and dynamics in sheep production within the urban centre. The density of sheep producers increases from the inner to the outer core of the city while the population density decreases from the city core to the outer zone.
Figure 4. Spatial distribution of type of animals reared in urban farming. Source: Field Work, 2023.
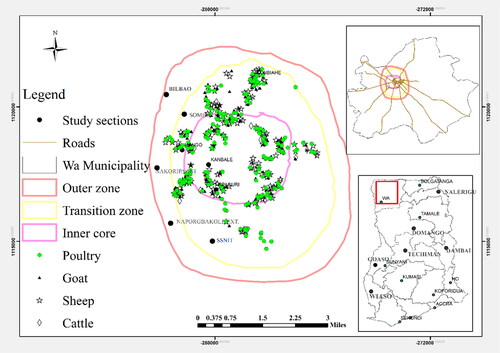
Though sheep rearing takes place across all the zones the density is higher at the core because the urban core is populous with smaller land space compared to the transition and the outer zones (see ). Despite the rearing of sheep being almost the same within the core and the transitional zones, the transition zone is less dense due to its large land space. Again, the core is dominated by the indigenes and by people who are practicing Islam and they need sheep for religious purposes such as for festivities, naming ceremonies, and funeral rites on one side. On the other side, the rearing of sheep is low in the outer city because of the limited households within the settings notwithstanding the larger land space which could be an incentive to rear more sheep. Additionally, the outer core is populated by settlers who are mostly a mixture of people from different religious denominations with no specific and dominating needs for sheep. In some cases, this zone is characterized by residents who are tenants and cannot engage in sheep production because of the difficulties in getting undeveloped plots. The households are also limited which corresponds with the limited sheep production among the households.
In further analysis of goat production within the space, the findings display similar production patterns among the core and the transition zones. It was clear that goat production was gaining recognition moving outward from the city centre though evidence revealed that the city core was the origin of goat production. Unlike goat production around the core, the transition zone also shows signs of residents gaining more interest in the production of goats within the locality. Taking the point further, the study analyzed cattle production in urban surroundings. The results signify that cattle production is part of urban animals’ production but not a key component. There are few households in cattle production in the urban neighbourhood. Many of the cattle producers are within the fringes of the core zone into the transitional zone. There is evidence of cattle production eliminated from the city core though there are a few producers within this zone (see ).
4.3. Spatial distribution of type of animal housing structure
At this point, the study looked at the type of structures that are used in housing farm animals under urban farming and how these structures are distributed across space. Notably three types of housing facilities; the use of wooden structures roofed with zinc, blocks or bricks structures roofed with zinc, and the free-range of animals (see ). Firstly, on the grounds of using wooden structures with zinc, urban farmers use pieces of board and zinc to construct temporary or makeshift structures to house these animals usually within a limited space. Many of these types of housing are predominated within the urban transitional zone into the outer where discarded pieces of wood and zinc from ongoing construction projects are easily available. Just a few people rely on wooden structures to keep their animals in the inner core. The next type of housing is the use of bricks or block structures roofed with zinc. This type of housing facility is common within both the inner core and the transitional zones. The core has this type of housing because a stronger and more durable housing system is needed to be able to keep animals safe from intruders and the destruction of people’s properties. The transitional zone on the other hand is classified as a residential area with high-quality housing and surroundings, and there is the need to maintain such quality by all standards even amid housing animals. Although some farmers could practice the semi-intensive system of housing animals, standard structures are paramount in housing the animals. Another, but uncommon, type of keeping animals is the practice of open space of the free-range system. In this system, animals are not housed, they are allowed to roam feed, and sleep anywhere within the surrounding either near or away from the owners’ residence. This practice is common in less densely populated neighbourhoods where there is enough space to graze and sleep.
Figure 5. Spatial distribution of type of housing structure in urban farming. Source: Field Work, 2023.
From the interviews, the production of animals within the urban area has an association with actors such as the MoFA Animals Department. However, it was ascertained that urban animal producers do access veterinary services from the Ministry of Food and Agriculture (MoFA). The provision of veterinary services to urban animal farmers is an important aspect of ensuring the health and well-being of livestock in urban areas. These services play a crucial role in maintaining the productivity and sustainability of urban farming systems. For instance, the type of housing that should be climatic friendly could be recommended for urban animal producers by veterinary professionals on animal keeping including handling of diseases. This can be done by offering their expertise, these professionals contribute to the overall success and viability of urban farming systems. In line with providing veterinary services, a respondent said:
…we have been providing veterinary services to people who are keeping animals in their houses. The services are not only vaccinating animals but also how to keep the animals fit and free from diseases through feeding and housing. (Key informant interview Animal Department, August 2023)
Since I started selling lands no one ever comes to me for land to engage in agricultural activities in the city, they acquire it for building but when they are not developing yet, they use it for farming. (Landlord, August, 2023)
4.4. Spatial statistics on characterization of urban farms
The study analyzed the nearest neighbour ratios of the type of animals and housing locations in the urban localities and the spatial distribution of the urban farm sizes as analyzed. In this, the analysis assumes whether one attribute is clustered, uniform, or dispersed across the space. The analysis revealed that given the z-score of −11.176 in poultry production locations within the city, there is a less than 1% likelihood that this clustered pattern could be the result of random chance. Again, given the z-score of −9.251 in sheep production locations, there is a less than 1% likelihood that this clustered pattern could be the result of random chance. Similarly, given the z-score of −6.770 in goat production locations, there is a less than 1% likelihood that this clustered pattern could be the result of random chance. However, given the z-score of −2.387 of cattle production locations, there is less than a 5% likelihood that this clustered pattern could be the result of random chance (see ). Evidentially, narrowing down to the locations of the type of housing location cross space, three types were identified; housing in walls roofed with zinc, wooden structures roofed with zinc, and open space or free-ranging practice. Given that the z-score of housing animals in structures with walls and roofed with zinc is −20.288, there is a less than 1% likelihood that this clustered pattern could be the result of random chance. In the same way, given the z-score of −14.851 for wooden structures roofed with zinc, there is a less than 1% likelihood that this clustered pattern could be the result of random chance.
Table 1. Spatial statistics on the distribution of urban farm composition.
However, the case is different for open space or free-range practice, given the z-score of 1.947, there is a less than 10% likelihood that this dispersed pattern could be the result of random chance. Subsequently, the locations of farms for crop production by sizes (>0.3, 0.3, 0.5, and 1) acres were analyzed. Given that the z-score of −20.374 for crop farm size, >0.3 acres, there is a less than 1% likelihood that this clustered pattern could be the result of random chance. Furthermore, given the z-value of -6.817 for a crop farm of 0.3 acres, there is a less than 1% likelihood that the clustered pattern could be the result of random chance. To add more, given that the z-score of 1.372 is for a crop farm size of 0.5 acres, the pattern does not appear to be significantly different than random. Similar to this, given that the z-score is −1.172 for a crop farm size of 1 acre, the pattern does not appear to be significantly different than random. Furthermore, the spatial structure of animal populations in cities can be categorized as aggregated, random, or dispersed.
The interview results showed that ideally, in Ghana, the spatial planning unit is responsible for guiding and regulating the use of land within urban areas, including the allocation of space for agricultural activities such as urban farming. One of the primary roles of the spatial planning unit is to regulate land use through zoning regulations. This involves designating specific zones or areas where urban farming is permitted and ensuring that these areas are suitable for agricultural activities. The spatial planning unit also plays a critical role in the allocation and utilization of land for urban farming purposes. It identifies suitable parcels of land within urban areas that can be used for agricultural activities and ensures that these lands are made available to individuals or groups interested in engaging in urban farming. Additionally, the unit may be involved in developing policies and incentives to encourage the use of vacant or underutilized land for urban agriculture. However, this role from the Land Use and Spatial Planning Department does not reflect the promotion of urban agriculture as urban agricultural production has no space in urban spatial planning regulations.
5. Discussions
5.1. Spatial dynamics of types of animals within the urban neighbourhood
The results had it that animal production shows a clustered distribution pattern across the urban zones. This suggests that climate change can have significant implications on the clustered distribution of urban farms, potentially influencing factors such as water availability, temperature extremes, and pest pressure, which may vary spatially and impact agricultural productivity and resilience. his supports the argument that animal production level is associated with the location of the farms (Cheng et al., Citation2022). The findings share the idea that in response to climate change, there is the need for increased productivity, farming units may increase in size with fewer animals per area unit, aiming for greater efficiency under intensive conditions (Shields & Orme-Evans, Citation2015). Additionally, if the density of animals in a specific area exceeds its environmental carrying capacity, it can lead to compensatory increases in demographic parameters and population growth under severe climatic conditions (Jaatinen et al., Citation2021). Animal rearing takes place in all the urban zones. The pattern in goat production shows an expansion into the outer core of the city. This means that the zone has more potential such as land availability due to the lower density of the space which promotes easy housing of goats and the practice of semi-intensive systems at less cost. Cattle production is not key in urban animal farming. This pattern reflects the difficult situation accompanying cattle production in terms of housing and feeding. Cattle production is easier when under a semi-intensive system rather than an intensive system. This is a reflection on why urban dwellers are interested in raising cattle within the city core (Osman et al., Citation2018; Wood et al., Citation2021).
5.2. Spatial distribution of type of animal housing structure
The study revealed that animal production is predominated by intensive farming systems where different types of housing units are clustered across the zones aimed at adapting to climatic stressors. The findings contradict the argument by Asadu et al. (Citation2021) that animals reared in the cities are allowed to roam freely. However, the findings support the assertion that an intensive system of rearing animals best fits urban environments as there is maximum care and protection (Osman et al., Citation2018). Innovative, integrated, and self-sufficient shelter designs can be implemented for climate change adaptation in animal agriculture through a multidisciplinary approach. To address extreme weather events and future climate conditions, it is important to design and implement new housing structures for animal agriculture, considering the needs of the animals and the challenges posed by climate change at different locations. This is in line with the idea that the effects of climate change on livestock diseases depend on geographical region, land use type, disease characteristics, and animal susceptibility (Cheng et al., Citation2022). Also, animal housing units should be designed to meet temperature regulation, ventilation, insulation, and protection from extreme weather events (Garber et al., Citation2011). Suitable modifications in shelter design are needed to address the impacts of climate change on livestock. These modifications aim to alleviate thermal stress and mitigate methane emissions (Escarcha et al., Citation2018).
5.3. Spatial dynamics and distribution of crop farm sizes within the city
The findings suggest that urban crop farm sizes do not exceed an acre and show a clustered distribution pattern. The clustered distribution pattern of urban crop farms can enhance urban farmers’ climate change adaptation strategies by fostering collaboration, knowledge exchange, and collective action, enabling the sharing of resources, expertise, and resilience-building measures to mitigate climate risks and ensure sustainable urban agriculture. This supports the assertion that the accessibility of knowledge to urban livestock farmers is crucial for reducing zoonotic infections and improving their practices (Lindahl et al., Citation2015). Urban farms are located almost across all the zones within the urban space. However, the location of urban farmers is subject to space availability and this does not support the idea of Taylor and Lovell (Citation2012) who argued that urban farms’ location is based on farmers’ local knowledge. The results also gave an insight into small spaces for urban farming.
There is competition for land demand for physical infrastructure within cities which affects agricultural production as people’s interest is in the use of land for building houses, shopping centres, roads, social centres, schools, and hospitals just to mention but a few to the detriment of urban crop production with the city centre. The economic value of lands within this zone in most instances is said to be more profitable than crop production (Ali et al. Citation2019; Tang et al., Citation2020). The study underscores that just a few urban farmers have plot sizes up to an acre. This corroborates the work of Cattivelli (Citation2020) who asserted that most urban farms are not more than 250 meters square and are located across the municipality. However, the study disagreed with the argument by Campbell et al. (Citation2022) that urban farm sizes do not exceed 5 acres, because, this study’s finding indicates that urban farm sizes rarely exceed an acre. There is little attention to integrating urban agriculture into land use planning as identified in the study. This is enough, to disagree with the assertion of Halvey et al. (Citation2020) that there are innovative measures and support to intensify urban agriculture through policies and planning.
6. Conclusions and policy recommendations
The study explored the spatial distribution of urban agricultural activities and the implications for urban farmers’ climate change adaptation strategies in animal and crop production. Using mixed methods of data collection and analysis, the data were analyzed spatially using ArcGIS version 10.8 to calculate the average nearest neighbourhood ratio of crops and animal production activities across the urban space, leveraging on the urban core, transitional zones, and outer zones. The study therefore concluded that urban agricultural activities have diversified spatial dynamics across urban neighbourhoods. For instance, urban farm sizes are less than an acre of land and show a clustered distribution pattern across urban space in all the zones—lower, middle, and higher classes—just like the production of ruminants and poultry. Meanwhile, while the rearing of farm animals in open spaces shows a dispersed distribution across the urban space, the housing of animals in wooden structures and walls roofed with zinc shows cluster distribution. The clustered distribution of urban farms can facilitate collaborative adaptation strategies among urban farmers, allowing for shared resources, knowledge exchange, and collective action to address climate change impacts effectively. Moreover, the choice of animals’ housing types on urban farms can significantly impact urban farmers’ climate change adaptation strategies, influencing factors such as resource efficiency, animal welfare, and resilience to extreme weather events. Promoting urban agricultural production despite climate stressors calls for collaboration and knowledge-sharing among neighbouring farms while implementing resilient and adaptable infrastructure to mitigate climate change risks and enhance sustainability in urban agriculture in Africa, particularly Ghana. Therefore, developmental policies should focus on the integration of urban agriculture and land use planning and zoning by the Town and Country Planning Departments. Further study should look at the stakeholders’ analysis of urban agricultural production.
Authors’ contributions
Godwin Kumpong. Naazie: Substantial contributions to the conception or design of the work; or the acquisition, analysis, or interpretation of data for the work; AND Drafting the work or reviewing it critically for important intellectual content; AND Final approval of the version to be published; AND Agreement to be accountable for all aspects of the work in ensuring that questions related to the accuracy or integrity of any part of the work are appropriately investigated and resolved. Isaac Agyemang: Drafting the work or reviewing it critically for important intellectual content; AND Final approval of the version to be published; AND Agreement to be accountable for all aspects of the work in ensuring that questions related to the accuracy or integrity of any part of the work are appropriately investigated and resolved. Anthony Mwinlanaah. Tampah-Naah: Drafting the work or reviewing it critically for important intellectual content; AND Final approval of the version to be published; AND Agreement to be accountable for all aspects of the work in ensuring that questions related to the accuracy or integrity of any part of the work are appropriately investigated and resolved.
Acknowledgments
We acknowledge Endogenous Development Services (EDS) Ghana for providing office space for this work and all the Associates of EDS Ghana, particularly Dr. Issah Baddianaah. Also, we acknowledge the contributions of the following individuals and Institutions during the fieldwork, Mr. Abu Inusah, Mr. Crispin Kanaata Dankana, Mr. Richard B. Bapuurintiere, Mrs. Janet B. Yelfaare, Mr. Alex Tieronwie and Mr. Edward Kandolnyuo. Again, appreciation goes to the Crop and Animals Departments of the Ministry of Food and Agriculture (MoFA), The editorial services from ALHAJI Ibrahim Kwabena ANTWI, Former University Liberian, University for Development Studies, Tamale are acknowledged.
Disclosure statement
No potential conflict of interest was reported by the author(s).
Data availability statement
The data that support the findings of this study are available from the corresponding author [GKN] upon reasonable request.
Additional information
Notes on contributors
Godwin K. Naazie
Godwin K. Naazie Naazie has a B.A. and MPhil in Environment and Resource Management. He is currently a PhD Candidate at the Department of Environment and Resource Studies, Faculty of Integrated Development Studies, Simon Diedong Dombo University of Business and Integrated Development Studies (SDD-UBIDS), Wa, Ghana, West Africa. His research focus is on agriculture and climate change adaptation. He is also a research fellow at the Endogenous Development Service (EDS), Ghana, and a lecturer in the Department of Mathematics and Natural Sciences, William V.S. Tubman University (WVSTU), Liberia, West Africa. He teaches environmental science related courses.
Isaac Agyemang
Isaac Agyemang Agyemang is an Associate Professor of Environmental Management in the Department of Environment and Resources Studies at the SDD-UBIDS, Wa, Ghana. He holds a PhD from the University of Leeds, UK; a Masters of Human Ecology from the University of Brussels, Belgium; and a B.Sc. from the KNUST, Kumasi, Ghana. Prof. Agyemang teaches environmental-related courses at the UBIDS. He has over 30 peer-reviewed journals and has supervised many undergraduates, masters, and Ph.D. theses and external examiner at the Presbyterian University College, Ghana, and the Bonn-Rhein-Sieg University of Applied Sciences, Germany, and member, of KNUST O. R Tambo Ph.D. Research Chair.
Anthony M. Tampah-Naah
Anthony M. Tampah-Naah Tampah-Naah is a senior lecturer at the Department of Geography, Faculty of Social Science and Arts, SDD-UBIDS, Wa, Ghana. He holds a Ph.D. and MPhil in Population and Health and a B.A. in Population and Family Life, all from the University of Cape Coast, Ghana. His research focuses on population health, maternal and child health, and food and nutrition security. He has published scientific articles in reputable peer-reviewed journals and supervised many Bachelors, Masters and Ph.D. Degree students.
References
- Akinyemi, B. E., & Mushunje, A. (2019). Land ownership and usage for agriculture: Empirical evidence from South African Living Conditions Survey. Cogent Social Sciences, 5(1), 1. https://doi.org/10.1080/23311886.2019.1663691
- Akoto-Danso, E. K., Manka’abusi, D., Steiner, C., Werner, S., Häring, V., Nyarko, G., Marschner, B., Drechsel, P., & Buerkert, A. (2019). Agronomic effects of biochar and wastewater irrigation in urban crop production of Tamale, northern Ghana. Nutrient Cycling in Agroecosystems, 115(2), 231–16. https://doi.org/10.1007/s10705-018-9926-6
- Al-Kofahi, S. D., Gharaibeh, A. A., Bsoul, E. Y., Othman, Y. A., & St. Hilaire, R. (2019). Investigating domestic gardens’ densities, spatial distribution and types among city districts. Urban Ecosystems, 22(3), 567–581. https://doi.org/10.1007/s11252-019-0833-7
- Alam, S., Barik, V. K., & Vishal, W. (2012). Learning about data to learning with Data. National Geographical Journal of India, 66(1), 37–39.
- Ali, D. A., Deininger, K., Mahofa, G., & Nyakulama, R. (2019). Sustaining land registration benefits by addressing the challenges of reversion to informality in Rwanda. Land Use Policy, 110, 104317. https://doi.org/10.1016/j.landusepol.2019.104317
- Anderson, C., Buchanan, C., Chang, M., Sanchez Rodriguez, J., & Wakeford, T. (2017). Everyday experts: How people’s knowledge can transform the food system. https://www.coventry.ac.uk/research/areas-of-research/agroecology-water-resilience/our-publications/everyday-experts-how-peoples-knowledge-can-transform-the-food-system/. https://doi.org/10.18552/9781846000751
- Asadu, A. N., Chah, J. M., Attamah, C. O., & Igbokwe, E. M. (2021). Knowledge of hazards associated with urban livestock farming in Southeast Nigeria. Frontiers in Veterinary Science, 8(March), 600299. https://doi.org/10.3389/fvets.2021.600299
- Campbell, C. G., Ruiz-Menjivar, J., & Delong, A. (2022). Commercial urban agriculture in Florida: Needs, opportunities, and barriers. HortTechnology, 32(4), 331–341. https://doi.org/10.21273/HORTTECH05038-22
- Cattivelli, V. (2020). The urban gardens in South Tyrol (IT): Spatial distribution and some considerations about their Rolein mitigating the effects of aging and urbanization. Regional Studies, Regional Science, 7(1), 206–209. https://doi.org/10.1080/21681376.2020.1770121
- Cheng, M., Mccarl, B., & Fei, C. (2022). Climate change and livestock production: A literature review. Atmospere, 13(1), 140.
- Diehl, J. A., Sweeney, E., Wong, B., Sia, C. S., Yao, H., & Prabhudesai, M. (2020). Feeding cities: Singapore’s approach to land use planning for urban agriculture. Global Food Security, 26(August 2019), 100377. https://doi.org/10.1016/j.gfs.2020.100377
- Echendu, A. J. (2020). The impact of flooding on Nigeria’s sustainable development goals (SDGs). Ecosystem Health and Sustainability, 6(1), 1791735. https://doi.org/10.1080/20964129.2020.1791735
- Escarcha, J., Lassa, J., & Zander, K. (2018). Livestock under climate change: A systematic review of impacts and adaptation. Climate, 6(3), 54. https://doi.org/10.3390/cli6030054
- FAO. (2020). Cities and local government at the forefront in building inclusive and resilient food systems. FAO.
- Feldt, T., Karg, H., Kadaouré, I., Bessert, L., & Schlecht, E. (2020). Growing struggle over rising demand: How land use change and complex farmer-grazier conflicts impact grazing management in the Western Highlands of Cameroon. Land Use Policy, 95(March), 104579. https://doi.org/10.1016/j.landusepol.2020.104579
- Fijn, L. B., Josef van der Staay, F., Goerlich-Jansson, V. C., & Arndt, S. S. (2020). Importance of basic research on the causes of feather pecking in relation to welfare. Animals: An Open Access Journal from MDPI, 10(2), 213. https://doi.org/10.3390/ani10020213
- Garber, J. C., Barbee, R. W., Bielitzki, J. T., Clayton, L. A., Donovan, J. C., Hendriksen, C. F. M., Kohn, D. F., Lipman, N. S., Locke, P. A., Melcher, J., Quimby, F. W., Turner, P. V., Wood, G. A., & Wurbel, H. (2011). Guide for the care and use of labooraatory animals (8th ed.). The National Academies Press.
- Gaughan, J. B., Sejian, V., Mader, T. L., & Dunshea, F. R. (2019). Adaptation strategies: Ruminants. Animal Frontiers, 9(1), 47–53. https://doi.org/10.1093/af/vfy029
- Ghana Statistical Service. (2021). Ghana 2021 population and housing census general report. https://www2.statsghana.gov.gh/nada/index.php/catalog/110/download/459#:∼:text=More%20recently%2C%20due%20to%20the,independence%20%2D%202021%20was%20the%20last.
- Hallegatte, S., Rentschler, J., & Rentschler, J. (2020). The adaptation principles; A guide for designing strategies for climate change adaptation and resilience. https://www.adaptation-undp.org/resources/reports/adaptation-principles-guide-designing-strategies-climate-change-adaptation-and
- Halvey, M. R., Santo, R. E., Lupolt, S. N., Dilka, T. J., Kim, B. F., Bachman, G. H., Clark, J. K., & Nachman, K. E. (2020). Beyond backyard chickens: A framework for understanding municipal urban agriculture policies in the United States. Food Policy. 103(July), 102013. https://doi.org/10.1016/j.foodpol.2020.102013
- Jaatinen, K., Westerbom, M., Norkko, A., Mustonen, O., & Koons, D. N. (2021). Detrimental impacts of climate change may be exacerbated by density-dependent population regulation in blue mussels. The Journal of Animal Ecology, 90(3), 562–573. https://doi.org/10.1111/1365-2656.13377
- Karg, H., Drechsel, P., Dittrich, N., & Cauchois, A. (2020). Spatial and temporal dynamics of croplands in expanding West African cities. Urban Agriculture & Regional Food Systems, 5(1), 1–16. https://doi.org/10.1002/uar2.20005
- Khan, R., Aziz, Z., & Ahmed, V. (2018). Building integrated agriculture information modelling (BIAIM): An integrated approach towards urban agriculture. Sustainable Cities and Society, 37, 594–607. https://doi.org/10.1016/j.scs.2017.10.027
- Kirsch, K. R., Newman, G. D., Zhu, R., McDonald, T. J., Xu, X., & Horney, J. A. (2022). Applying and integrating urban contamination factors into community garden siting. Journal of Geovisualization and Spatial Analysis, 6(2), 2022. https://doi.org/10.1007/s41651-022-00129-7
- Laari, B. P., Bayorbor, A. S., & Sagoe, G. (2019). Urban land use planning and its effects on the provision of public sanitation facilities in the Wa Municipality, Ghana. Journal of Geography and Regional Planning, 12(4), 60–75. https://doi.org/10.5897/jgrp2019.0741
- Langemeyer, J., Madrid-Lopez, C., Mendoza Beltran, A., & Villalba Mendez, G. (2021). Urban agriculture—A necessary pathway towards urban resilience and global sustainability? Landscape and Urban Planning, 210, 104055. https://doi.org/10.1016/j.landurbplan.2021.104055
- Lindahl, E., Sattorov, N., Boqvist, S., & Magnusson, U. (2015). A study of knowledge, attitudes and practices relating to brucellosis among small-scale dairy farmers in an urban and peri-urban area of Tajikistan. PloS One, 10(2), e0117318. https://doi.org/10.1371/journal.pone.0117318
- Mack, E. A., Tong, D., & Credit, K. (2017). Gardening in the desert: A spatial optimization approach to locating gardens in rapidly expanding urban environments. International Journal of Health Geographics, 16(1), 37. https://doi.org/10.1186/s12942-017-0110-z
- Meenar, M. R. (2017). Assessing the spatial connection between Urban agriculture and equity. Built Environment, 43(3), 364–375. https://doi.org/10.2148/benv.43.3.364
- Miernicki, E. A., Lovell, S. T., & Wortman, S. E. (2018). Raised beds for vegetable production in urban agriculture. Urban Agriculture & Regional Food Systems, 3(1), 1–10. https://doi.org/10.2134/urbanag2018.06.0002
- Omondi, S. O., Oluoch-Kosura, W., & Jirström, M. (2017). The role of urban-based agriculture on food security: Kenyan case studies. Geographical Research, 55(2), 231–241. https://doi.org/10.1111/1745-5871.12234
- Osman, A., Karikari, P. K., Osafo, E. L. K., & Attoh-Kotoku, V. (2018). Smallholder urban cattle production: Prospects and challenges in the Kumasi Metropolis and Asokore Mampong Municipality of the Ashanti Region of Ghana. Journal of Animal Science and Biotechnology, 9(January), 98–110.
- Osumanu, I. K., Akongbangre, J. N., Tuu, G. N. Y., & Owusu-Sekyere, E. (2019). From patches of villages to a municipality: Time, space, and expansion of Wa, Ghana. Urban Forum, 30(1), 57–74. https://doi.org/10.1007/s12132-018-9341-8
- Payen, F. T., Evans, D. L., Falagán, N., Hardman, C. A., Kourmpetli, S., Liu, L., Marshall, R., Mead, B. R., & Davies, J. A. C. (2022). How much food can we grow in urban areas? Food production and crop yields of urban agriculture: A meta-analysis. Earth’s Future, 10(8), 1–22. https://doi.org/10.1029/2022EF002748
- Robinson, E., Nicholson, C., & Kelly, R. L. (2019). The Importance of spatial data to open-access national archaeological databases and the development of paleodemography research. Advances in Archaeological Practice, 7(4), 395–408. https://doi.org/10.1017/aap.2019.29
- Rojas-Downing, M. M., Nejadhashemi, A. P., Harrigan, T., & Woznicki, S. A. (2017). Climate change and livestock: Impacts, adaptation, and mitigation. Climate Risk Management, 16, 145–163. https://doi.org/10.1016/j.crm.2017.02.001
- Shackleton, C. M., Cilliers, S. S., Davoren, E., & Du, M. J. (2021). Urban ecology in the global south. https://doi.org/10.1007/978-3-030-67650-6
- Shields, S., & Orme-Evans, G. (2015). The impacts of climate change mitigation strategies on animal welfare. Animals, 5(2), 361–394. https://doi.org/10.3390/ani5020361
- Siegner, A., Sowerwine, J., & Acey, C. (2018). Does urban agriculture improve food security? Examining the Nexus of Food Access and Distribution of Urban Produced Foods in the United States: A systematic review. Sustainability, 10(9), 2988. https://doi.org/10.3390/su10092988
- Tang, D., Liu, H., Song, E., & Chang, S. (2020). Urban expansion simulation from the perspective of land acquisition-based on bargaining model and ant colony optimization. Computers, Environment and Urban Systems, 82(December 2019), 101504. https://doi.org/10.1016/j.compenvurbsys.2020.101504
- Tapia, C., Randall, L., Wang, S., & Aguiar Borges, L. (2021). Monitoring the contribution of urban agriculture to urban sustainability: An indicator-based framework. Sustainable Cities and Society, 74, 103130. https://doi.org/10.1016/j.scs.2021.103130
- Taylor, J. R., & Lovell, S. (2012). Mapping public and private spaces of urban agriculture in Chicago through the analysis of high-resolution aerial images in Google Earth. Landscape and Urban Planning, 108(1), 57–70. https://doi.org/10.1016/j.landurbplan.2012.08.001
- Usmani, A. R. S., Hashem, T. I. A., Pillai, T. R., Saeed, A., & Abdullahi, A. M. (2020). Geographic information system and big spatial data: A review and challenges. International Journal of Enterprise Information Systems, 16(4), 101–145. https://doi.org/10.4018/IJEIS.2020100106
- Wa Municipal Assembly. (2021). Municipal composite budget for 2021-2024. Wa Municipal Assembly.
- William, R. B. G. (1968). Intermediate statistics for geographers and earth scientists. Educational and Psychological Measurement, 28(2), 619–620. https://doi.org/10.1177/001316446802800256
- Wood, A. L., Ansah, P., Rivers, L., & Ligmann-Zielinska, A. (2021). Examining climate change and food security in Ghana through an intersectional framework. The Journal of Peasant Studies, 48(2), 329–348. https://doi.org/10.1080/03066150.2019.1655639