
 ?Mathematical formulae have been encoded as MathML and are displayed in this HTML version using MathJax in order to improve their display. Uncheck the box to turn MathJax off. This feature requires Javascript. Click on a formula to zoom.
Abstract
Increasing atmospheric greenhouse gas (GHG) concentrations causes global temperature rising as well as extreme hydrological events. Understanding the effects of climate change-induced severe hydrological events such as flooding and drought on soil properties and subsequent GHG emissions from soil has enabled scientists to optimize different land management and global warming potential mitigation of a system. Flooding and drought dynamics affect soil physicochemical properties and GHG emissions specifically from land use systems that are adjacent to streams like riparian buffers. Drivers of soil GHG emissions and the effect of extreme hydrological events on the GHG flux from riparian systems in three climate zones (Mediterranean, temperate, and tropical/subtropical) were investigated in this review utilizing Web of Science and Scopus databases. Wet soil conditions contribute more to global warming (7.2 Mg CO2eq-C ha−1 h−1) than dry soils (2.1 Mg CO2eq-C ha−1 h−1) in riparian systems. Temperate riparian systems showed the greatest soil N2O emissions (0.7 mg N2O-N m−2 h−1) after flooding events/during wet seasons. The greatest CH4 (12 mg CH4-C m−2 h−1) and CO2 (15.2 g CO2-C m−2 d−1) flux from wet soils were observed in tropical/subtropical riparian systems. Greater soil inorganic N content (NO3- and NH4+) in temperate riparian systems is responsible for the higher soil N2O flux during wet seasons. Intense precipitation events and greater soil carbon content in tropical/subtropical riparian systems contributed to more CO2 and CH4 emissions relative to the temperate and Mediterranean riparian systems.
REVIEWING EDITOR:
1. Introduction
In recent decades, anthropogenic and natural sources have driven a rise in greenhouse gas (GHG) concentrations. Between 1990 and 2019, the cumulative warming impact of human-added greenhouse gases on the Earth’s atmosphere rose by 45%. Specifically, the warming effect attributed to carbon dioxide alone saw a 36% increase during this period (Ipcc et al., Citation2021). Due to the rise of GHG concentrations, the average global surface temperature between 2001 and 2020 was 0.99 °C higher than 1850–1900 and it is projected to rise 2 °C above the pre-industrial level by 2050 (NASA, Citation2021; Pathak et al., Citation2012). This warming atmosphere contributes to increased evaporation, intense precipitation, and severe weather conditions, altering precipitation intensity, surface runoff ratios, and inducing heat waves (Ipcc et al., Citation2021). Per decade global precipitation has increased at an average rate of 0.25 cm since 1901 whereas future projections suggest some regions will have a continuous decrease in soil moisture (Mortsch et al., Citation2000). Projections indicate further heightened hydrological events like flooding or drought due to global warming effects (NASA, Citation2021). Flooding and drought events in agricultural and other land use systems affect the quantity of soil GHG production by altering soil physical and chemical properties (Davis, Citation2018; Ussiri et al., Citation2009). Soil can be either a sink or a source of the GHGs, carbon dioxide (CO2), Methane (CH4), and Nitrous oxide (N2O) depending on variations in environmental conditions (Ipcc et al., Citation2021). Soil physicochemical properties such as soil temperature, water content, and soil carbon (C) and nitrogen (N) play important roles in soil GHG production and emission (Wang et al., Citation2021).
Riparian areas, recognized for providing ecosystem services such as the removal of nutrients from incoming surface runoffs, are susceptible to the impacts of climate change (Gundersen et al., Citation2012). The frequency and duration of climate-induced hydrological gradients (drought and flooding) that have increased in recent years affect riparian soil nutrient cycle, as well as GHG emission (Aronson et al., Citation2019). Riparian areas adjacent to the streams are subjected to frequent flooding due to the heavy precipitation and can also be loaded with surface runoff from adjacent agricultural land use systems (Iqbal et al., Citation2015). Floods, droughts, and alterations in water levels can influence the availability of soil oxygen, which, in turn, affects the microbial processes responsible for greenhouse gas production (Ansari et al., Citation2023a; Aronson et al., Citation2019). The variability in greenhouse gas emissions from soil in riparian systems across different climate zones could be significant because it reflects the diverse ecological and environmental conditions present in these regions (Poblador et al., Citation2017). Extreme hydrological events influence soil nutrient storage, specifically soil C and N content by altering vegetation coverage in tropical riparian forests (Yang et al., Citation2022). In tropical riparian land use, abundant rainfall leads to the formation of oxygen-depleted soil conditions as a result of higher water table levels, consequently amplifying the release of both N2O and CH4 (Vidon et al., Citation2016). Soil moisture and carbon content can substantially affect the emissions of CO2 and CH4 in intermittently flooded riparian systems in temperate climates (Altor & Mitsch, Citation2006; Baskerville et al., Citation2021). However, soil water stress and drought conditions in the temperate riparian forests are projected to be increased under climate change which can contribute to the lower emission of CH4 and N2O (Cholet et al., Citation2022). As a result, crop coverage will be decreased in temperate zones more severely than in tropical riparian systems (Porfirio et al., Citation2017). Flooding occurrences will decline in Mediterranean riparian systems, while the frequency of soil moisture drought conditions is anticipated to increase due to rising global temperatures ranging from 1.5 °C to 2.0 °C (Poblador et al., Citation2017). Elevated temperatures in Mediterranean riparian systems can support substantial respiration and nitrogen mineralization rates. As a result, the extent to which rewetting microbial pulses contribute to annual carbon dioxide (CO2) and nitrous oxide (N2O) production in Mediterranean riparian soils is currently a subject of ongoing debate (Poblador et al., Citation2017).
Managing and quantifying diverse sources influencing GHG emissions from riparian systems can be challenging, and there remains an insufficient level of research on the quantity of GHG fluxes originating from these systems (Vidon et al., Citation2019). Understanding the interactions between riparian ecosystems and broader climate change trends is crucial for effective mitigation strategies and helps to quantify the role of riparian zones in the global C and N cycles (Wilcock et al., Citation2008). Moreover, climate-specific approaches to address the environmental challenges associated with GHG emissions from riparian land use contribute to implementing regional policies aimed at optimizing agronomic activities and urbanization in riparian areas. Policymakers, researchers, and land managers need to consider these variations when designing environmental policies and practices, especially in the context of climate change. This review aimed to investigate, (1) the soil physicochemical properties that play a crucial role in the release of greenhouse gases (CO2, N2O, and CH4) from soil, and (2) the emission of greenhouse gases from riparian systems vulnerable to extreme hydrological events, such as flooding and drought, across different climate zones.
2. Methods
2.1. Drivers of soil greenhouse gas emissions
A literature search was conducted using ‘soil’, ‘greenhouse gas’, and ‘drivers’ as keywords and refined by the review articles on two common databases Scopus and Web of Science. A total of 86 and 43 review articles were retrieved, respectively. The common drivers of soil GHG emissions were investigated in the collected articles and discussed in this review. Soil C and N content, moisture, temperature, redox potential, and pH on the production and emission of CO2, N2O, and CH4 from soils were found as the most common important factors discussed in the review articles.
2.2. Soil greenhouse gas flux from riparian systems
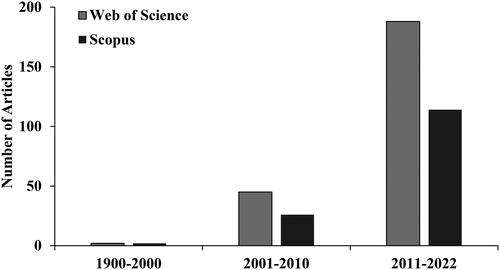
To access the studies on the soil GHG emissions from riparian systems, a database search was continued using ‘soil’, ‘greenhouse gas’, and ‘riparian’ as the keywords for the 1990–2022 period, and 235, and 142 articles were retrieved from the Web of Science and Scopus databases, respectively (). The outcome was refined by ‘wet’ and ‘dry’ keywords which returned 19 and 34 articles, respectively, from the Web of Science, and 38 and 42 articles, respectively, from Scopus. Duplicates were eliminated. The number of studies that have been conducted on soil greenhouse gas emissions from riparian systems has increased considerably during the past three decades (). Among all studies, soil GHG emissions after frequently/occasionally flooded events and from wet soil conditions (saturated soil) as well as emissions during wet seasons were considered as emissions under flooding events/from wet soil. Due to the data shortage regarding greenhouse gas emissions from dry soils, (i.e. at the wilting point), this review categorizes emissions during dry seasons as emissions from dry soil. As a result, dry seasons are considered drought events.
Figure 1. Selected articles on soil greenhouse gas emissions from riparian systems between 1990 and 2022 from the Web of Science and Scopus databases.
Hourly basis emission units were converted into daily units. Whenever needed, emissions were converted from mol into mass basis using the appropriate molecular weight. The area units were converted to hectares by the appropriate conversion factor for annual emissions. Mean values of N2O and CH4 fluxes were small and expressed to two/three decimal places. To calculate the global warming potential (GWP), the following formula was used:
where 27.9 and 273 are 100-year time-horizon global warming potential values of CH4 and N2O, respectively, as compared to CO2 (Ipcc et al., Citation2021). Analysis of variance (ANOVA) was performed to compare the effect of wet and dry soil conditions on soil GHG emissions using SAS Studio (University edition). Treatment differences were accepted as significant at p = 0.05 level.
3. Greenhouse gas (GHG) emissions from soil
3.1. Soil C and N content and microbial activity
Soil-based fluxes of GHG are produced primarily through plant and microbial respiration through enzymatic oxidation-reduction processes that are part of the soil C and N cycle (Stohl et al., Citation1996). Soil C and N content, inorganic N, and C: N ratio affect microbial activity and thus GHG emissions (Wan et al., Citation2015). Inorganic ions such as nitrate (NO3-) and ammonium (NH4+) are products of plant litter proteins decomposition that affect soil GHG emissions specifically N2O emission through nitrification, in aerobic well-aerated soils, and denitrification (reduction of NO3- to N2) under anaerobic wet soils (Dalal et al., Citation2003; Palm et al., Citation2002; Tenuta & Beauchamp, Citation2003). The runoff from agricultural or urban areas, discharging into riparian systems, carries elevated concentrations of nutrients, including NO3- and NH4+, which can potentially stimulate greater microbial activity and lead to increased emission of N2O (Ullah & Zinati, Citation2006). Greater C: N ratio (36–82) results in lower N2O emission (Takakai et al., Citation2008), while the highest emission occurs at C: N = 11 (Gundersen et al., Citation2012). Soil CO2 flux is positively correlated with soil total organic carbon and nitrogen, particulate, and dissolved organic C (DOC), and N (Bailey et al., Citation2009). Riparian systems dominated by trees and herbaceous vegetation can significantly enhance soil organic carbon (SOC) content, thereby contributing to elevated CO2 emissions (Baskerville et al., Citation2021; Collins et al., Citation2017; Gacengo et al., Citation2009). In available C shortage conditions, CO2 is negatively correlated with soil N availability (Hassler et al., Citation2015; Oertel et al., Citation2016). Increased amounts of SOC within riparian systems play a role in the occurrence of methanogenesis (microbial-mediated CH4 production), particularly following soil anaerobic conditions triggered by flooding events (Ansari et al., Citation2023b). However, enhanced soil available N could reduce CH4 uptake (Hassler et al., Citation2015), and thus, a lower C: N ratio positively affects soil CH4 emission (Jiang et al., Citation2011). Ammonium is toxic to CH4 oxidizing bacteria which could lead to a lower CH4 uptake (Müller et al., Citation2006).
3.2. Temperature
Warm temperatures are in favor of soil microbial activities. Soil respiration, nitrification and denitrification accelerate at temperatures between 25 °C and 35 °C (Butterbach-Bahl et al., Citation2013). Temperatures higher than 37 °C and lower than -7 °C negatively impact soil microbial activities and GHG emissions (Brooks et al., Citation1997; Oertel et al., Citation2016). Waldo et al. (Citation2019) found a positive relationship between the mean daily air temperature and soil N2O emission. Temperature-induced freezing-thawing events affect the concentration of soil N2O production. Soil thaw during the Spring season contributes to N2O production and emission (Castaldi, Citation2000; Goodroad & Keeney, Citation1984). Soil microbial activity is stimulated by more available nutrients released after thaw events and thus enhances N2O emission (Mørkved et al., Citation2006). Similarly, there is a positive relationship between temperature and CO2 emission from soil (Schaufler et al., Citation2010). Greater soil CO2 emission is attributed to a higher microbial decomposition rate (Lopez de Gerenyu et al., 2005). Low temperatures during the Winter season affect CO2 emission negatively mostly due to the lower soil microbial activity and root respiration (Groffman et al., Citation2006). Soil CH4 emission in wet soils (e.g. paddy soils) occurs once the soil temperature is less than 30 °C (Xu et al., Citation2021). However, CH4 uptake increases in soils under warmer and drier conditions. Increasing temperature positively influences soil CH4 production and emission due to the greater activity of biotic factors such as methanogens (e.g. Methanosaeta, Methanocella) and methanotrophs in flooded rice soils (Lee et al., Citation2014).
3.3. pH and redox potential
Soil hydrology dynamics as affected by drying-wetting events influence soil physicochemical properties like soil pH, redox potential (Eh) and nutrient fate (Zhang & Furman, Citation2021). Redox potential indicates soil oxygen status and plays a key role in soil nutrient cycling and GHG emissions (Moore et al., Citation2017; Zhang & Furman, Citation2021). Redox potential decreases in flooding events and becomes negatively correlated (r = -0.25) with CH4 production (Moore et al., Citation2017). Wang et al. (Citation1993) observed the maximum CH4 emissions at pH = 6.9. In flooding events, soil pH reduces due to the reduction reactions and denitrification (Hansen et al., Citation2014). During denitrification, N2O as an intermediary product is produced and increased as soil acidity and NO3- concentration increase (Krichels et al., Citation2019). Soil pH < 7 accelerates denitrification while pH between 7 and 9 is in favor of nitrification (Heil et al., Citation2016; Oertel et al., Citation2016) (). Acidic soils (pH < 5) stimulate the chemodenitrification process (Hu et al., Citation2015) through which N2O is produced via oxidation of Fe2+ coupled to the reduction of NO3-, nitrite (NO2-), or nitric oxide (NO). The neutral and alkaline soil stimulates soil CO2 fluxes (Wang et al., Citation2010). Wang et al. (Citation2010) reported the lowest and highest soil CO2 flux at soil pH= 3.65 and 8.55, respectively.
Table 1. Oxidation-reduction reactions and associated optimum redox potential values (adapted from Zhang & Furman, Citation2021), and optimum soil physicochemical properties (pH, water-filled pore space) contribute to the greenhouse gas (CO2, N2O, and CH4) emissions from soil.
3.4. Moisture/flooding and drought
Spatial and temporal variations in soil GHG efflux are associated with heterogeneity in soil moisture content (Turner et al., Citation2008; Zhong & Makeschin, Citation2006). Soil water content controls the amount of available oxygen to microorganisms and affects soil microbial population size and therefore GHG emissions (Krichels et al., Citation2019). Soil water-filled pore space (WFPS) plays an important role in the rate of nutrient decomposition and mineralization, as well as GHG emissions from soil (Galic et al., Citation2019). Soil aerobic (WFPS≈ 20%–70%) and anaerobic conditions (WFPS ≈ 70%–100%) control soil GHG production by regulating respiration, nitrification, and denitrification (Oertel et al., Citation2016) ().
Soil WFPS between 20% and 60% accelerates CO2 emissions (Moore et al., Citation2017). ; Schaufler et al., Citation2010). The greatest CO2 emission was observed at WFPS = 20% by Schaufler et al. (Citation2010). The lowest CO2 emission occurs in soil-saturated conditions at WFPS≥ 90% (Ruser et al., Citation2006). Proton consumption by imported NO3- and Fe3+ ions through redox reactions in flooding conditions could increase soil pH. Raising soil pH and available nutrients due to flooding events increases soil enzyme and microbial activity, soil respiration, and CO2 emission from riparian systems (Moore et al., Citation2017; Ou et al., Citation2019). Moreover, translocation of oxygen from above-ground shoots into below-ground roots by riparian vegetation under flooding conditions could increase substrate oxidation and CO2 emission at the cost of CH4 reduction (Nag et al., Citation2017). On the contrary, O’Connell et al. (Citation2018) and Koebsch et al. (Citation2020) reported that short-term drought events can stimulate plant root respiration and CO2 flux. However, they consider well-aerated soils with a sufficient amount of organic C in which oxidation decomposition rate mediated by heterotrophic microorganisms is increased and thus can raise CO2 flux. These uncertainties in the relationship between extreme hydrological events and soil CO2 emissions from riparian systems are due to the differences in site-specific factors like microclimate, soil and vegetation type, temperature, and microbial community diversity (Baskerville et al., Citation2021; Patel et al., Citation2021).
The greatest N2O flux was observed at soil WFPS> 60% by Merino et al. (Citation2004). According to Yanai et al. (Citation2003) N2O emissions accelerate at WFPS∼60% while, lower N2O production occurs at WFPS< 30% (Gao et al., Citation2014). Soil WFPS between 70% and 95% maximizes the reduction of NO3- into N2O gas (Ruser et al., Citation2006; Säurich et al., Citation2019). Due to the damage of severe flooding, degraded riparian vegetation roots cannot remove excess N from soil (Ou et al., Citation2019; Peralta et al., Citation2014). Several studies found a positive correlation between soil N2O-N flux in riparian systems and concentration of NH4+ and NO3- which are imported to the system through surface runoff during flooding events (Davis, Citation2018; Nag et al., Citation2017; Xu et al., Citation2021). Riparian forests subjected to frequent flooding emit more N2O relative to occasional flooding events (Jacinthe et al., Citation2012). Soil pH controls the activity of N2O reductase, and the decreased soil pH caused by flooding events inhibits the function of the enzyme and results in an incomplete denitrification process from N2O to N2 (Davis, Citation2018; Nag et al., Citation2017). Soil inorganic N (NO3− and NO2−) concentrations are responsible for nitrification-derived N2O products in dry soil conditions. In soils with higher N content which are subjected to dry climate conditions, ammonium ions are oxidized rather than methane which could be the reason for the higher N2O emission in drought conditions (Aronson et al., Citation2019). Moreover, lower soil water drainage and plant N uptake in dry seasons or dry soil conditions contribute to NO3-N accumulation and N2O emission (Iqbal et al., Citation2015; Venterea et al., Citation2011). Jacinthe et al. (Citation2012) reported that within a mature riparian forest experiencing frequent flooding (four to six times annually), the average N2O flux exhibited a notably higher level compared to periods of occasional floods (2 to 3 times per year) or infrequent floods (occurring every 20 years). Therefore, lower soil water content and shifting from anoxic to oxic conditions in severe drought conditions could reduce the denitrification rate and thus N2O emission (Liu et al., Citation2021).
Microorganisms that are involved in CH4 production through the methanogenesis process are anaerobes (Methanogen microbes) that function better under soil-saturated conditions in flooded soils (Angel et al., Citation2012; Nazaries et al., Citation2013; Smith et al., Citation2003). The maximum CH4 efflux rate from riparian forest soils under investigation by Moore et al. (Citation2017) was observed at soil saturation conditions. Dry soils are CH4 sinks due to the increased methanotrophic activity under improved soil aeration (Kwak et al., Citation2019). Riparian systems in floodplain soils under saturated conditions emit more CH4 than under normal season conditions due to the lower redox potential and oxygen diffusion (Moore et al., Citation2017; Peralta et al., Citation2014). In flooded soils, methanogenic microorganisms become dominant and facilitate the breakdown of organic matter. As a result, an increased presence of soil C leads to elevated CH4 emissions in riparian systems following flooding events (Xu et al., Citation2021). The standing water above the soil surface after flood events influences the CH4 release positively (Shi et al., Citation2021). The two groups of methanogens (acetoclastic and hydrogenotrophic) play a key role in the biogenically produced CH4 in anoxic conditions when the water stands above the soil surface (Kollah et al., Citation2018). Moreover, water table depth is negatively correlated with soil CH4 emission (Soosaar et al., Citation2011). As the water table increases, the shift from aerobic to anaerobic conditions occurs, and methanogens use soil carbon sources to generate CH4 (Keane et al., Citation2021). In dry seasons methane oxidation becomes the limiting factor in CH4 production from soil (Sha et al., Citation2011). Soil CH4 production is substantially correlated (r2=0.32) with soil moisture content (Amadi et al., Citation2016) and thus CH4 emission is reduced during drought conditions (Keane et al., Citation2021). However, rewetting the soil could trigger soil CH4 production in post-drought periods (Keane et al., Citation2021; O’Connell et al., Citation2018).
4. Greenhouse gas flux from riparian systems under extreme hydrological events
4.1. CO2 exchange
Wet soil conditions due to the flooding and heavy rainfall events contributed more to the soil CO2 emission (7.4 g CO2-C m−2 d−1) relative to dry soil conditions (3.1 g CO2-C m−2 d−1) (). Soil CO2 emissions from dry and wet soil tropical/subtropical riparian systems (dry: 3.9 g CO2-C m−2 d−1; wet: 15.2 g CO2-C m−2 d−1) were greater than temperate and Mediterranean riparian land use systems (). The emission of CO2 from dry riparian soils was substantially (P = 0.007) greater in tropical/subtropical climates than in temperate regions (2.1 g CO2-C m−2 d−1) (). This could be attributed to the higher soil and ambient temperatures in tropical/subtropical regions as compared to temperate and Mediterranean climates (). A strong positive correlation (r2=0.56) between soil CO2 emission from a riparian system and soil temperature was observed by Gebremichael et al. (Citation2017). Moreover, higher soil CO2 flux in tropical riparian zones could be correlated with higher soil temperature, as well as lower substrate quality of these land use systems (Keane et al., Citation2021; Zhang et al., Citation2022) (). Intense precipitation events in tropical/subtropical regions cause a sharp increase in soil moisture content which in turn triggers soil enzyme activity and microbial respiration and thus CO2 emission (Liu et al., Citation2021; Zhang et al., Citation2022) () relative to temperate and Mediterranean riparian systems. Mean soil C: N ratio and DOC were greater by roughly 1.5 and 19 times, respectively, in Mediterranean riparian systems compared to the temperate systems. This could be the reason for the higher CO2 flux from Mediterranean riparian systems (dry soil: 3.3 g CO2-C m−2 d−1; wet soil: 3.9 g CO2-C m−2 d−1) relative to temperate systems. Although soil carbon content derived from the studies conducted on tropical/subtropical riparian systems was expressed in units other than dissolved organic carbon (DOC), Kachenchart et al. (Citation2012) noted that the DOC concentration in tropical riparian systems is estimated to be roughly three times higher than that reported for temperate riparian zones. Since CO2 emission is positively correlated with the soil DOC (Bailey et al., Citation2009), this could be another factor that contributes to the higher CO2 flux from tropical riparian systems relative to temperate systems.
Figure 2. Mean greenhouse gas emissions from soils under different climate and hydrological conditions (A); and mean soil emissions (all climates) under dry-wet conditions (B). Bar charts are standard errors. Bars (±SE) followed different letters in each hydrological condition, showing significant differences at p < 0.05. In this study, soil greenhouse gas emissions during the dry season and after flooding events/from saturated soils are considered dry and wet soil emissions, respectively. Source: Altor and Mitsch (Citation2006); Hernandez and Mitsch (Citation2006); McLain and Martens (Citation2006); Hinshaw and Dahlgren (Citation2016); Audet et al. (Citation2013); Kachenchart et al. (Citation2012); Lopes de Gerenyu et al. (Citation2011) (2015); Batson et al. (Citation2015); Jacinthe et al. (Citation2015); Mander et al. (Citation2015); Vidon et al. (Citation2017); Vidon et al. (Citation2016); Jacinthe and Vidon (Citation2017); Gebremichael et al. (Citation2017); Poblador et al. (Citation2017); Smith et al. (Citation2017); Kaiser et al. (Citation2018); Kandel et al. (Citation2019); Mafa-Attoye et al. (Citation2020); Schindler et al. (Citation2020); Liu et al. (Citation2021); Wang et al. (Citation2021); Mander et al. (Citation2022); Zhang et al. (Citation2022).
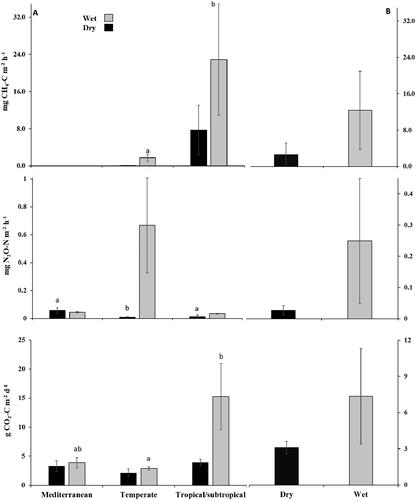
Table 2. Mean environmental properties in the reviewed riparian systems.
4.2. N2O exchange
Soil N2O flux was greater under flooding events (0.25 mg N2O-N m−2 h−1) as compared to dry soil (0.03 mg N2O-N m−2 h−1) conditions (). N2O emissions from wet soils in temperate riparian systems (0.7 mg N2O-N m−2 h−1) were greater than riparian systems located in tropical/subtropical (0.03 mg N2O-N m−2 h−1) and Mediterranean climate (0.04 mg N2O-N m−2 h−1) (). Soil N2O emissions under wet soil conditions were 2 times greater than dry conditions in temperate riparian systems. The greater wet soil N2O flux from temperate riparian systems relative to the two other climates is due to the higher soil inorganic N content (). A strong positive correlation (r2= 0.83) between soil N2O flux and soil NO3- concentration for a temperate riparian system during the wet season was reported by Jacinthe and Vidon (Citation2017). Moreover, Kachenchart et al. (Citation2012) reported a positive correlation (r = 0.13) between soil NH4+ concentration and nitrification rate in a tropical riparian system. Also, a positive correlation (r = 0.24) between soil N2O flux and NH4+ was observed by Gebremichael et al. (Citation2017) in a Mediterranean riparian system. A higher dry soil N2O flux in Mediterranean riparian systems (0.05 mg N2O-N m−2 h−1) than temperate (P = 0.03; 0.01 mg N2O-N m−2 h−1) and tropical/subtropical (0.013 mg N2O-N m−2 h−1) riparian landuse systems could be attributed to the higher soil temperature during dry seasons (Datta et al., Citation2011) (). Increased soil NH4+ oxidation due to the higher temperature in dry seasons could be responsible for the greater N2O emission in Mediterranean riparian systems relative to temperate and tropical/subtropical riparian systems (Jacinthe & Vidon, Citation2017; Kandel et al., Citation2019). Some of the temperate riparian systems were adjacent to the agricultural fields (Audet et al., Citation2013; Kandel et al., Citation2019). Therefore, discharging NO3- from adjacent fertilized agricultural systems into the riparian area could be another important reason for higher N2O flux from temperate riparian systems in wet seasons and after flooding events as compared to the Mediterranean and tropical/subtropical riparian systems (Kandel et al., Citation2019).
4.3. CH4 exchange
The higher soil CH4 flux was observed under soil saturation conditions after flooding events (12 mg CH4-C m−2 h−1) than from dry soils (2.6 mg CH4-C m−2 h−1). Soil CH4 flux was greater from riparian systems in tropical/subtropical climate (dry: 7.7 mg CH4-C m−2 h−1; wet: 22.9 mg CH4-C m−2 h−1) as compared to the temperate (dry: 0.05 mg CH4-C m−2 h−1; wet: 1.7 mg CH4-C m−2 h−1) and Mediterranean (dry: ∼0.0 mg CH4-C m−2 h−1; wet: not available) riparian systems (). Greater soil DOC along with, rainfall and WFPS accumulation in tropical climate contribute to the more CH4 flux (Kachenchart et al., Citation2012). In contrast, when the water level drops below the soil surface in dry seasons, riparian soils become CH4 sinks (Liu et al., Citation2021). Dry soil CH4 flux from tropical/subtropical riparian systems was higher by almost 4 and 8 times relative to temperate and Mediterranean riparian systems. Following summer flooding events causing soil saturation, the elevated dry season temperatures in tropical/subtropical climates, compared to temperate and Mediterranean regions, stimulate both CH4 production and oxidation in riparian systems (Liu et al., Citation2021; Zhang et al., Citation2022).
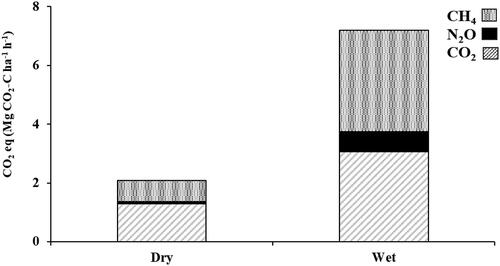
Due to the greater GWP of CH4 and N2O relative to CO2, an estimated GWP of riparian systems under severe weather conditions revealed that the wet conditions with higher soil N2O and CH4 fluxes could seriously impact climate change () as compared to dry soil conditions. Although this was not the aim of this study, to estimate the overall GWP of riparian ecosystems, the net C budget of the system including C restoration and C output (GHG emissions) should be evaluated in future studies. Limited information on the net carbon release from riparian systems still hinders the assessment of the sources/sinks from these ecosystems and their contribution to the global climate.
Figure 3. Soil CO2 eq of CO2, N2O, and CH4 from riparian systems under dry and wet soil conditions. Soil greenhouse gas emissions during the dry season and after flooding events/from wet soils are considered dry and wet soil emissions, respectively.
5. Conclusions and future prospects
Riparian areas are ecologically important transition zones between terrestrial and aquatic environments, and their role in greenhouse gas emissions is an area of active research. Riparian systems play crucial rules in global C cycling and can influence or be influenced by climate change-induced hydrological events. Several factors such as land use, vegetation types, soil characteristics, and climatic conditions can influence the greenhouse gas dynamics in riparian zones. This review indicated that, (1) soil moisture, among various soil properties, plays a crucial role in influencing the emissions of GHGs from soil, and wet soil conditions contribute more to global warming by almost three times relative to dry soils in riparian systems; (2) the greatest soil N2O and CH4 emissions occur in wet soil conditions/after flooding events in temperate and tropical/subtropical riparian systems, respectively.
There are still opportunities for new research initiatives to address the gaps in understanding greenhouse gas emissions from riparian system soils in various climates. We propose that further research studies should address the following questions:
Is there a potential tradeoff between the nutrient removal capabilities of riparian systems from soil and water and their role in contributing to climate change and air quality through greenhouse gas emissions from the soils of these systems?
What is the influence of land use changes in riparian areas on greenhouse gas emissions, and how can land management practices mitigate or exacerbate these emissions?
What effective mitigation strategies can be employed in riparian areas to reduce greenhouse gas emissions, and how can these strategies be integrated into broader climate change mitigation efforts?
What role do various plant and microbial communities in riparian zones play in greenhouse gas dynamics, and how might shifts in these communities affect emissions?
Disclosure statement
The authors declare that they have no known competing financial interests or personal relationships that could have appeared to influence the work reported in this article.
Data availability statement
The data that support the findings of this study are available from the corresponding author, [Jamshid Ansari], upon reasonable request.
References
- Altor, A. E., & Mitsch, W. J. (2006). Methane flux from created riparian marshes: relationship to intermittent versus continuous inundation and emergent macrophytes. Ecological Engineering, 28(3), 1–13. https://doi.org/10.1016/j.ecoleng.2006.06.006
- Amadi, C. C., Van Rees, K. C., & Farrell, R. E. (2016). Soil–atmosphere exchange of carbon dioxide, methane and nitrous oxide in shelterbelts compared with adjacent cropped fields. Agriculture, Ecosystems & Environment, 223, 123–134. https://doi.org/10.1016/j.agee.2016.02.026
- Angel, R., Claus, P., & Conrad, R. (2012). Methanogenic archaea are globally ubiquitous in aerated soils and become active under wet anoxic conditions. The ISME Journal, 6(4), 847–862. https://doi.org/10.1038/ismej.2011.141
- Ansari, J., Bardhan, S., Eivazi, F., Anderson, S. H., & Mendis, S. S. (2023a). Bacterial community diversity for three selected land use systems as affected by soil moisture regime. Applied Soil Ecology, 192, 105100. https://doi.org/10.1016/j.apsoil.2023.105100
- Ansari, J., Davis, M. P., Anderson, S. H., Eivazi, F., & Bardhan, S. (2023b). Greenhouse gas emissions from row crop, agroforestry, and forested land use systems in floodplain soils. Water, Air, & Soil Pollution, 234(4), 227. https://doi.org/10.1007/s11270-023-06227-6
- Aronson, E. L., Goulden, M. L., & Allison, S. D. (2019). Greenhouse gas fluxes under drought and nitrogen addition in a Southern California grassland. Soil Biology and Biochemistry, 131, 19–27. https://doi.org/10.1016/j.soilbio.2018.12.010
- Audet, J., Elsgaard, L., Kjaergaard, C., Larsen, S. E., & Hoffmann, C. C. (2013). Greenhouse gas emissions from a Danish riparian wetland before and after restoration. Ecological Engineering, 57, 170–182. https://doi.org/10.1016/j.ecoleng.2013.04.021
- Bailey, N. J., Motavalli, P. P., Udawatta, R. P., & Nelson, K. A. (2009). Soil CO2 emissions in agricultural watersheds with agroforestry and grass contour buffer strips. Agroforestry Systems, 77(2), 143–158. https://doi.org/10.1007/s10457-009-9218-x
- Baskerville, M., Bazrgar, A., Reddy, N., Ofosu, E., Thevathasan, N., Gordon, A. M., & Oelbermann, M. (2021). Greenhouse gas emissions from riparian zones are related to vegetation type and environmental factors. Journal of Environmental Quality, 50(4), 847–857. https://doi.org/10.1002/jeq2.20250
- Batson, J., Noe, G. B., Hupp, C. R., Krauss, K. W., Rybicki, N. B., & Schenk, E. R. (2015). Soil greenhouse gas emissions and carbon budgeting in a short‐hydroperiod floodplain wetland. Journal of Geophysical Research: Biogeosciences, 120(1), 77–95. https://doi.org/10.1002/2014JG002817
- Brooks, P. D., Schmidt, S. K., & Williams, M. W. (1997). Winter production of CO2 and N2O from alpine tundra: Environmental controls and relationship to inter-system C and N fluxes. Oecologia, 110(3), 403–413. https://doi.org/10.1007/PL00008814
- Butterbach-Bahl, K., Baggs, E. M., Dannenmann, M., Kiese, R., & Zechmeister-Boltenstern, S. (2013). Nitrous oxide emissions from soils: how well do we understand the processes and their controls? Philosophical Transactions of the Royal Society of London. Series B, Biological Sciences, 368(1621), 20130122. https://doi.org/10.1098/rstb.2013.0122
- Castaldi, S. (2000). Responses of nitrous oxide, dinitrogen and carbon dioxide production and oxygen consumption to temperature in forest and agricultural light-textured soils determined by model experiment. Biology and Fertility of Soils, 32(1), 67–72. https://doi.org/10.1007/s003740000218
- Cholet, C., Houle, D., Sylvain, J. D., Doyon, F., & Maheu, A. (2022). Climate change increases the severity and duration of soil water stress in the temperate forest of eastern North America. Frontiers in Forests and Global Change, 94.
- Collins, H. P., Fay, P. A., Kimura, E., Fransen, S., & Himes, A. (2017). Intercropping with switchgrass improves net greenhouse gas balance in hybrid poplar plantations on a sand soil. Soil Science Society of America Journal, 81(4), 781–795. https://doi.org/10.2136/sssaj2017.09.0294
- Dalal, R. C., Wang, W., Robertson, G. P., & Parton, W. J. (2003). Nitrous oxide emission from Australian agricultural lands and mitigation options: a review. Soil Research, 41(2), 165–195. https://doi.org/10.1071/SR02064
- Datta, A., Santra, S. C., & Adhya, T. K. (2011). Relationship between CH4 and N2O flux from soil and their ambient mixing ratio in a riparian rice-based agroecosystem of tropical region. Journal of Environmental Monitoring: JEM, 13(12), 3469–3474. https://doi.org/10.1039/c1em10478k
- Davis, M. P. (2018). Greenhouse gas emissions from saturated riparian buffers and woodchip bioreactors [Doctoral dissertation]. Iowa State University.
- Dutaur, L., & Verchot, L. V. (2007). A global inventory of the soil CH4 sink. Global Biogeochemical Cycles, 21(4). https://doi.org/10.1029/2006GB002734
- Gacengo, C. N., Wood, C. W., Shaw, J. N., Raper, R. L., & Balkcom, K. S. (2009). Agroecosystem management effects on greenhouse gas emissions across a coastal plain catena. Soil Science, 174(4), 229–237. https://doi.org/10.1097/SS.0b013e31819f5fce
- Galic, M., Bilandzija, D., Percin, A., Sestak, I., Mesic, M., Blazinkov, M., & Zgorelec, Z. (2019). Effects of agricultural practices on carbon emission and soil health. Journal of Sustainable Development of Energy, Water and Environment Systems, 7(3), 539–552. https://doi.org/10.13044/j.sdewes.d7.0271
- Gao, B., Ju, X., Su, F., Meng, Q., Oenema, O., Christie, P., Chen, X., & Zhang, F. (2014). Nitrous oxide and methane emissions from optimized and alternative cereal cropping systems on the North China Plain: A two-year field study. The Science of the Total Environment, 472, 112–124. https://doi.org/10.1016/j.scitotenv.2013.11.003
- Gebremichael, A. W., Osborne, B., & Orr, P. (2017). Flooding-related increases in CO2 and N2O emissions from a temperate coastal grassland ecosystem. Biogeosciences, 14(10), 2611–2626. https://doi.org/10.5194/bg-14-2611-2017
- Goodroad, L. L., & Keeney, D. R. (1984). Nitrous oxide emission from forest, marsh, and prairie ecosystems. Journal of Environmental Quality, 13(3), 448–452. https://doi.org/10.2134/jeq1984.00472425001300030024x
- Groffman, P. M., Hardy, J. P., Driscoll, C. T., & Fahey, T. J. (2006). Snow depth, soil freezing, and fluxes of carbon dioxide, nitrous oxide and methane in a northern hardwood forest. Global Change Biology, 12(9), 1748–1760. https://doi.org/10.1111/j.1365-2486.2006.01194.x
- Gundersen, P., Christiansen, J. R., Alberti, G., Brüggemann, N., Castaldi, S., Gasche, R., Kitzler, B., Klemedtsson, L., Lobo-do-Vale, R., Moldan, F., Rütting, T., Schleppi, P., Weslien, P., & Zechmeister-Boltenstern, S. (2012). The response of methane and nitrous oxide fluxes to forest change in Europe. Biogeosciences, 9(10), 3999–4012. https://doi.org/10.5194/bg-9-3999-2012
- Hansen, M., Clough, T. J., & Elberling, B. (2014). Flooding-induced N2O emission bursts controlled by pH and nitrate in agricultural soils. Soil Biology and Biochemistry, 69, 17–24. https://doi.org/10.1016/j.soilbio.2013.10.031
- Hassler, E., Corre, M. D., Tjoa, A., Damris, M., Utami, S. R., & Veldkamp, E. (2015). Soil fertility controls soil–atmosphere carbon dioxide and methane fluxes in a tropical landscape converted from lowland forest to rubber and oil palm plantations. Biogeosciences, 12(19), 5831–5852. https://doi.org/10.5194/bg-12-5831-2015
- Heil, J., Vereecken, H., & Brüggemann, N. (2016). A review of chemical reactions of nitrification intermediates and their role in nitrogen cycling and nitrogen trace gas formation in soil. European Journal of Soil Science, 67(1), 23–39. https://doi.org/10.1111/ejss.12306
- Hernandez, M. E., & Mitsch, W. J. (2006). Influence of hydrologic pulses, flooding frequency, and vegetation on nitrous oxide emissions from created riparian marshes. Wetlands, 26(3), 862–877. https://doi.org/10.1672/0277-5212(2006)26[862:IOHPFF]2.0.CO;2
- Hinshaw, S. E., & Dahlgren, R. A. (2016). Nitrous oxide fluxes and dissolved N gases (N2 and N2O) within riparian zones along the agriculturally impacted San Joaquin River. Nutrient Cycling in Agroecosystems, 105(2), 85–102. https://doi.org/10.1007/s10705-016-9777-y
- Hu, H. W., Chen, D., & He, J. Z. (2015). Microbial regulation of terrestrial nitrous oxide formation: understanding the biological pathways for prediction of emission rates. FEMS Microbiology Reviews, 39(5), 729–749. https://doi.org/10.1093/femsre/fuv021
- Ipcc, V., Zhai, P., Pirani, A., Connors, S. L., Pean, C., Berger, S., Caud, N., Chen, Y., Goldfarb, L., Gomis, M. I., & Huang, M. (2021). Climate Change 2021: The Physical Science Basis. Contribution of Working Group I to the Sixth Assessment Report of the Intergovernmental Panel on Climate Change. In V. Masson-Delmotte, P. Zhai, A. Pirani, S. L. Connors, C. Pean, S. Berger, N. Caud, Y. Chen, L. Goldfarb, M. I. Gomis, M. Huang, K. Leitzell, E. Lonnoy , J. B. R. Matthews, T.K. Maycock, T. Waterfield, O. Yelekçi, R. Yu, and B. Zhou (Eds.) Cambridge University Press.
- Iqbal, J., Parkin, T. B., Helmers, M. J., Zhou, X., & Castellano, M. J. (2015). Denitrification and nitrous oxide emissions in annual croplands, perennial grass buffers, and restored perennial grasslands. Soil Science Society of America Journal, 79(1), 239–250. https://doi.org/10.2136/sssaj2014.05.0221
- Jacinthe, P. A., & Vidon, P. (2017). Hydro-geomorphic controls of greenhouse gas fluxes in riparian buffers of the White River watershed, IN (USA). Geoderma, 301, 30–41. https://doi.org/10.1016/j.geoderma.2017.04.007
- Jacinthe, P. A., Bills, J. S., Tedesco, L. P., & Barr, R. C. (2012). Nitrous oxide emission from riparian buffers in relation to vegetation and flood frequency. Journal of Environmental Quality, 41(1), 95–105. https://doi.org/10.2134/jeq2011.0308
- Jacinthe, P. A., Vidon, P., Fisher, K., Liu, X., & Baker, M. E. (2015). Soil methane and carbon dioxide fluxes from cropland and riparian buffers in different hydrogeomorphic settings. Journal of Environmental Quality, 44(4), 1080–1090. https://doi.org/10.2134/jeq2015.01.0014
- Jiang, T., Schuchardt, F., Li, G., Guo, R., & Zhao, Y. (2011). Effect of C/N ratio, aeration rate and moisture content on ammonia and greenhouse gas emission during the composting. Journal of Environmental Sciences (China), 23(10), 1754–1760. https://doi.org/10.1016/s1001-0742(10)60591-8
- Kachenchart, B., Jones, D. L., Gajaseni, N., Edwards-Jones, G., & Limsakul, A. (2012). Seasonal nitrous oxide emissions from different land uses and their controlling factors in a tropical riparian ecosystem. Agriculture, Ecosystems & Environment, 158, 15–30. https://doi.org/10.1016/j.agee.2012.05.008
- Kaiser, K. E., McGlynn, B. L., & Dore, J. E. (2018). Landscape analysis of soil methane flux across complex terrain. Biogeosciences, 15(10), 3143–3167. https://doi.org/10.5194/bg-15-3143-2018
- Kandel, T. P., Karki, S., Elsgaard, L., & Lærke, P. E. (2019). Fertilizer-induced fluxes dominate annual N2O emissions from a nitrogen-rich temperate fen rewetted for paludiculture. Nutrient Cycling in Agroecosystems, 115(1), 57–67. https://doi.org/10.1007/s10705-019-10012-5
- Keane, J. B., Toet, S., Ineson, P., Weslien, P., Stockdale, J. E., & Klemedtsson, L. (2021). Carbon dioxide and methane flux response and recovery from drought in a hemiboreal ombrotrophic fen. Frontiers in Earth Science, 8, 562401. https://doi.org/10.3389/feart.2020.562401
- Koebsch, F., Gottschalk, P., Beyer, F., Wille, C., Jurasinski, G., & Sachs, T. (2020). The impact of occasional drought periods on vegetation spread and greenhouse gas exchange in rewetted fens. Philosophical Transactions of the Royal Society of London. Series B, Biological Sciences, 375(1810), 20190685. https://doi.org/10.1098/rstb.2019.0685
- Kollah, B., Patra, A. K., & Mohanty, S. R. (2018). Microbial cycling of greenhouse gases and their impact on climate change. In Advances in soil microbiology: recent trends and future prospects (pp. 129–143). Springer.
- Krichels, A. H., Sipic, E., & Yang, W. H. (2019). Iron redox reactions can drive microtopographic variation in upland soil carbon dioxide and nitrous oxide emissions. Soil Systems, 3(3), 60. https://doi.org/10.3390/soilsystems3030060
- Kwak, J.-H., Lim, S.-S., Baah-Acheamfour, M., Choi, W.-J., Fatemi, F., Carlyle, C. N., Bork, E. W., & Chang, S. X. (2019). Introducing trees to agricultural lands increases greenhouse gas emission during spring thaw in Canadian agroforestry systems. The Science of the Total Environment, 652, 800–809. https://doi.org/10.1016/j.scitotenv.2018.10.241
- Lee, H. J., Kim, S. Y., Kim, P. J., Madsen, E. L., & Jeon, C. O. (2014). Methane emission and dynamics of methanotrophic and methanogenic communities in a flooded rice field ecosystem. FEMS Microbiology Ecology, 88(1), 195–212. https://doi.org/10.1111/1574-6941.12282
- Liu, X., Lu, X., Yu, R., Sun, H., Xue, H., Qi, Z., Cao, Z., Zhang, Z., & Liu, T. (2021). Greenhouse gases emissions from riparian wetlands: an example from the Inner Mongolia grassland region in China. Biogeosciences, 18(17), 4855–4872. https://doi.org/10.5194/bg-18-4855-2021
- Lopes de Gerenyu, V. O., Anichkin, A. E., Avilov, V. K., Kuznetsov, A. N., & Kurganova, I. N. (2015). Termites as a factor of spatial differentiation of CO2 fluxes from the soils of monsoon tropical forests in southern Vietnam. Eurasian Soil Science, 48(2), 208–217. https://doi.org/10.1134/S1064229315020088
- Lopes de Gerenyu, V. O., Kurbatova, Y. A., Kurganova, I. N., Tiunov, A. V., Anichkin, A. Y., Myakshina, T. N., & Kuznetsov, A. N. (2011). Daily and seasonal dynamics of CO2 fluxes from soils under different stands of monsoon tropical forest. Eurasian Soil Science, 44(9), 984–990. https://doi.org/10.1134/S1064229311090067
- Mafa-Attoye, T. G., Baskerville, M. A., Ofosu, E., Oelbermann, M., Thevathasan, N. V., & Dunfield, K. E. (2020). Riparian land-use systems impact soil microbial communities and nitrous oxide emissions in an agro-ecosystem. The Science of the Total Environment, 724, 138148. https://doi.org/10.1016/j.scitotenv.2020.138148
- Mander, Ü., Krasnova, A., Schindler, T., Megonigal, J. P., Escuer-Gatius, J., Espenberg, M., Machacova, K., Maddison, M., Pärn, J., Ranniku, R., Pihlatie, M., Kasak, K., Niinemets, Ü., & Soosaar, K. (2022). Long-term dynamics of soil, tree stem and ecosystem methane fluxes in a riparian forest. The Science of the Total Environment, 809, 151723. https://doi.org/10.1016/j.scitotenv.2021.151723
- Mander, U., Maddison, M., Soosaar, K., Teemusk, A., Kanal, A., Uri, V., & Truu, J. (2015). The impact of a pulsing groundwater table on greenhouse gas emissions in riparian grey alder stands. Environmental Science and Pollution Research International, 22(4), 2360–2371. https://doi.org/10.1007/s11356-014-3427-1
- McLain, J. E., & Martens, D. A. (2006). Moisture controls on trace gas fluxes in semiarid riparian soils. Soil Science Society of America Journal, 70(2), 367–377. https://doi.org/10.2136/sssaj2005.0105
- Merino, A., Pérez-Batallón, P., & Macías, F. (2004). Responses of soil organic matter and greenhouse gas fluxes to soil management and land use changes in a humid temperate region of southern Europe. Soil Biology and Biochemistry, 36(6), 917–925. https://doi.org/10.1016/j.soilbio.2004.02.006
- Moore, B. D., Kaur, G., Motavalli, P. P., Zurweller, B. A., & Svoma, B. M. (2017). Soil greenhouse gas emissions from agroforestry and other land uses under different moisture regimes in lower Missouri River Floodplain soils: A laboratory approach. Agroforestry Systems, 92(2), 335–348. https://doi.org/10.1007/s10457-017-0083-8
- Mørkved, P. T., Dörsch, P., Henriksen, T. M., & Bakken, L. R. (2006). N2O emissions and product ratios of nitrification and denitrification as affected by freezing and thawing. Soil Biology and Biochemistry, 38(12), 3411–3420. https://doi.org/10.1016/j.soilbio.2006.05.015
- Mortsch, L., Hengeveld, H., Lister, M., Wenger, L., Lofgren, B., Quinn, F., & Slivitzky, M. (2000). Climate change impacts on the hydrology of the Great Lakes-St. Lawrence system. Canadian Water Resources Journal, 25(2), 153–179. https://doi.org/10.4296/cwrj2502153
- Müller, T., Walter, B., Wirtz, A., & Burkovski, A. (2006). Ammonium toxicity in bacteria. Current Microbiology, 52(5), 400–406. https://doi.org/10.1007/s00284-005-0370-x
- Nag, S. K., Liu, R., & Lal, R. (2017). Emission of greenhouse gases and soil carbon sequestration in a riparian marsh wetland in central Ohio. Environmental Monitoring and Assessment, 189(11), 580. https://doi.org/10.1007/s10661-017-6276-9
- NASA. (2021). What is the greenhouse effect? Retrieved from The National Aeronautics and Space Administration. https://climate.nasa.gov
- Nazaries, L., Murrell, J. C., Millard, P., Baggs, L., & Singh, B. K. (2013). Methane, microbes and models: fundamental understanding of the soil methane cycle for future predictions. Environmental Microbiology, 15(9), 2395–2417. https://doi.org/10.1111/1462-2920.12149
- O’Connell, C. S., Ruan, L., & Silver, W. L. (2018). Drought drives rapid shifts in tropical rainforest soil biogeochemistry and greenhouse gas emissions. Nature Communications, 9(1), 1348. https://doi.org/10.1038/s41467-018-03352-3
- Oertel, C., Matschullat, J., Zurba, K., Zimmermann, F., & Erasmi, S. (2016). Greenhouse gas emissions from soils—A review. Geochemistry, 76(3), 327–352. https://doi.org/10.1016/j.chemer.2016.04.002
- Ou, Y., Rousseau, A. N., Wang, L., Yan, B., Gumiere, T., & Zhu, H. (2019). Identification of the alteration of riparian wetland on soil properties, enzyme activities and microbial communities following extreme flooding. Geoderma, 337, 825–833. https://doi.org/10.1016/j.geoderma.2018.10.032
- Palm, C. A., Alegre, J. C., Arevalo, L., Mutuo, P. K., Mosier, A. R., & Coe, R. (2002). Nitrous oxide and methane fluxes in six different land use systems in the Peruvian Amazon. Global Biogeochemical Cycles, 16(4), 21–21. https://doi.org/10.1029/2001GB001855
- Patel, K. F., Fansler, S. J., Campbell, T. P., Bond-Lamberty, B., Smith, A. P., RoyChowdhury, T., McCue, L. A., Varga, T., & Bailey, V. L. (2021). Soil texture and environmental conditions influence the biogeochemical responses of soils to drought and flooding. Communications Earth & Environment, 2(1), 127. https://doi.org/10.1038/s43247-021-00198-4
- Pathak, H., Aggarwal, P. K., & Singh, S. D. (2012). Climate change impact, adaptation and mitigation in agriculture: methodology for assessment and applications (Vol. 302). Indian Agricultural Research Institute.
- Peralta, A. L., Ludmer, S., Matthews, J. W., & Kent, A. D. (2014). Bacterial community response to changes in soil redox potential along a moisture gradient in restored wetlands. Ecological Engineering, 73, 246–253. https://doi.org/10.1016/j.ecoleng.2014.09.047
- Poblador, S., Lupon, A., Sabate, S., & Sabater, F. (2017). Soil water content drives spatiotemporal patterns of CO2 and N2O emissions from a Mediterranean riparian forest soil. Biogeosciences, 14(18), 4195–4208. https://doi.org/10.5194/bg-14-4195-2017
- Porfirio, L. L., Newth, D., Harman, I. N., Finnigan, J. J., & Cai, Y. (2017). Patterns of crop cover under future climates. Ambio, 46(3), 265–276. https://doi.org/10.1007/s13280-016-0818-1
- Ruser, R., Flessa, H., Russow, R., Schmidt, G., Buegger, F., & Munch, J. C. (2006). Emission of N2O, N2 and CO2 from soil fertilized with nitrate: Effect of compaction, soil moisture and rewetting. Soil Biology and Biochemistry, 38(2), 263–274. https://doi.org/10.1016/j.soilbio.2005.05.005
- Säurich, A., Tiemeyer, B., Dettmann, U., & Don, A. (2019). How do sand addition, soil moisture and nutrient status influence greenhouse gas fluxes from drained organic soils? Soil Biology and Biochemistry, 135, 71–84. https://doi.org/10.1016/j.soilbio.2019.04.013
- Schaufler, G., Kitzler, B., Schindlbacher, A., Skiba, U., Sutton, M. A., & Zechmeister‐Boltenstern, S. (2010). Greenhouse gas emissions from European soils under different land use: Effects of soil moisture and temperature. European Journal of Soil Science, 61(5), 683–696. https://doi.org/10.1111/j.1365-2389.2010.01277.x
- Schindler, T., Mander, Ü., Machacova, K., Espenberg, M., Krasnov, D., Escuer-Gatius, J., Veber, G., Pärn, J., & Soosaar, K. (2020). Short-term flooding increases CH4 and N2O emissions from trees in a riparian forest soil-stem continuum. Scientific Reports, 10(1), 3204. https://doi.org/10.1038/s41598-020-60058-7
- Sha, C., Mitsch, W. J., Mander, Ü., Lu, J., Batson, J., Zhang, L., & He, W. (2011). Methane emissions from freshwater riverine wetlands. Ecological Engineering, 37(1), 16–24. https://doi.org/10.1016/j.ecoleng.2010.07.022
- Shi, W., Du, M., Ye, C., & Zhang, Q. (2021). Divergent effects of hydrological alteration and nutrient addition on greenhouse gas emissions in the water level fluctuation zone of the Three Gorges Reservoir, China. Water Research, 201, 117308. https://doi.org/10.1016/j.watres.2021.117308
- Smith, K. A., Ball, T., Conen, F., Dobbie, K. E., Massheder, J., & Rey, A. (2003). Exchange of greenhouse gases between soil and atmosphere: interactions of soil physical factors and biological processes. European Journal of Soil Science, 54(4), 779–791. https://doi.org/10.1046/j.1351-0754.2003.0567.x
- Smith, R. M., Kaushal, S. S., Beaulieu, J. J., Pennino, M. J., & Welty, C. (2017). Influence of infrastructure on water quality and greenhouse gas dynamics in urban streams. Biogeosciences (Online), 14(11), 2831–2849. https://doi.org/10.5194/bg-14-2831-2017
- Soosaar, K., Mander, Ü., Maddison, M., Kanal, A., Kull, A., Lõhmus, K., Truu, J., & Augustin, J. (2011). Dynamics of gaseous nitrogen and carbon fluxes in riparian alder forests. Ecological Engineering, 37(1), 40–53. https://doi.org/10.1016/j.ecoleng.2010.07.025
- Stohl, A., Williams, E., Wotawa, G., & Kromp-Kolb, H. (1996). A European inventory of soil nitric oxide emissions and the effect of these emissions on the photochemical formation of ozone. Atmospheric Environment, 30(22), 3741–3755. https://doi.org/10.1016/1352-2310(96)00104-5
- Takakai, F., Desyatkin, A. R., Lopez, C. L., Fedorov, A. N., Desyatkin, R. V., & Hatano, R. (2008). CH4 and N2O emissions from a forest‐alas ecosystem in the permafrost taiga forest region, eastern Siberia, Russia. Journal of Geophysical Research: Biogeosciences, 113(G2), G000521. https://doi.org/10.1029/2007JG000521
- Tenuta, E. G., & Beauchamp, M. (2003). Nitrous oxide production from granular nitrogen fertilizers applied to a silt loam soil. Canadian Journal of Soil Science, 83(5), 521–532.
- Thiel, B., Krzic, M., Gergel, S., Terpsma, C., Black, A., Jassal, R., & Smukler, S. M. (2017). Soil CO2, CH4 and N2O emissions from production fields with planted and remnant hedgerows in the Fraser River Delta of British Columbia. Agroforestry Systems, 91(6), 1139–1156. https://doi.org/10.1007/s10457-016-9990-3
- Turner, D. A., Chen, D., Galbally, I. E., Leuning, R., Edis, R. B., Li, Y., Kelly, K., & Phillips, F. (2008). Spatial variability of nitrous oxide emissions from an Australian irrigated dairy pasture. Plant and Soil, 309(1-2), 77–88. https://doi.org/10.1007/s11104-008-9639-8
- Ullah, S., & Zinati, G. M. (2006). Denitrification and nitrous oxide emissions from riparian forests soils exposed to prolonged nitrogen runoff. Biogeochemistry, 81(3), 253–267. https://doi.org/10.1007/s10533-006-9040-8
- Ussiri, D. A., Lal, R., & Jarecki, M. K. (2009). Nitrous oxide and methane emissions from long-term tillage under a continuous corn cropping system in Ohio. Soil and Tillage Research, 104(2), 247–255. https://doi.org/10.1016/j.still.2009.03.001
- Venterea, R. T., Maharjan, B., & Dolan, M. S. (2011). Fertilizer source and tillage effects on yield‐scaled nitrous oxide emissions in a corn cropping system. Journal of Environmental Quality, 40(5), 1521–1531. https://doi.org/10.2134/jeq2011.0039
- Vidon, P. G., Welsh, M. K., & Hassanzadeh, Y. T. (2019). Twenty years of riparian zone research (1997–2017): where to next? Journal of Environmental Quality, 48(2), 248–260. https://doi.org/10.2134/jeq2018.01.0009
- Vidon, P., Marchese, S., & Rook, S. (2017). Impact of Hurricane Irene and Tropical Storm Lee on riparian zone hydrology and biogeochemistry. Hydrological Processes, 31(2), 476–488. https://doi.org/10.1002/hyp.11045
- Vidon, P., Marchese, S., Welsh, M., & McMillan, S. (2016). Impact of precipitation intensity and riparian geomorphic characteristics on greenhouse gas emissions at the soil-atmosphere interface in a water-limited riparian zone. Water, Air, & Soil Pollution, 227(1), 1–12. https://doi.org/10.1007/s11270-015-2717-7
- Waldo, S., Russell, E. S., Kostyanovsky, K., Pressley, S. N., O’Keeffe, P. T., Huggins, D. R., Stöckle, C. O., Pan, W. L., & Lamb, B. K. (2019). N2O emissions from two agroecosystems: High spatial variability and long pulses observed using static chambers and the flux‐gradient technique. Journal of Geophysical Research. Biogeosciences, 124(7), 1887–1904. https://doi.org/10.1029/2019JG005032
- Wan, X., Huang, Z., He, Z., Yu, Z., Wang, M., Davis, M. R., & Yang, Y. (2015). Soil C: N ratio is the major determinant of soil microbial community structure in subtropical coniferous and broadleaf forest plantations. Plant and Soil, 387(1-2), 103–116. https://doi.org/10.1007/s11104-014-2277-4
- Wang, J., Bogena, H., Süß, T., Graf, A., Weuthen, A., & Brüggemann, N. (2021). Investigating the controls on greenhouse gas emission in the riparian zone of a small headwater catchment using an automated monitoring system. Vadose Zone Journal, 20(5), e20149. https://doi.org/10.1002/vzj2.20149
- Wang, L., Han, Z., & Zhang, X. (2010). Effects of soil pH on CO2 emission from long-term fertilized black soils in Northeastern China. In Proceedings of Conference on Environmental Pollution and Public Health (CEPPH 2010).
- Wang, Z. P., Delaune, R. D., Patrick, W. H., Jr, & Masscheleyn, P. H. (1993). Soil redox and pH effects on methane production in a flooded rice soil. Soil Science Society of America Journal, 57(2), 382–385. https://doi.org/10.2136/sssaj1993.03615995005700020016x
- Wilcock, R., Elliott, S., Hudson, N., Parkyn, S., & Quinn, J. (2008). Climate change mitigation for agriculture: water quality benefits and costs. Water Science and Technology: a Journal of the International Association on Water Pollution Research, 58(11), 2093–2099. https://doi.org/10.2166/wst.2008.906
- Xu, C., Wong, V. N., & Reef, R. E. (2021). Effect of inundation on greenhouse gas emissions from temperate coastal wetland soils with different vegetation types in southern Australia. The Science of the Total Environment, 763, 142949. https://doi.org/10.1016/j.scitotenv.2020.142949
- Yanai, J., Sawamoto, T., Oe, T., Kusa, K., Yamakawa, K., Sakamoto, K., Naganawa, T., Inubushi, K., Hatano, R., & Kosaki, T. (2003). Spatial variability of nitrous oxide emissions and their soil‐related determining factors in an agricultural field. Journal of Environmental Quality, 32(6), 1965–1977. https://doi.org/10.2134/jeq2003.1965
- Yang, Y., Berhe, A. A., Barnes, M. E., Moreland, K. C., Tian, Z., Kelly, A. E., Bales, R. C., O’Geen, A. T., Goulden, M. L., Hartsough, P., & Hart, S. C. (2022). Climate warming alters nutrient storage in seasonally dry Forests: insights from a 2,300 m elevation gradient. Global Biogeochemical Cycles, 36(11), e2022GB007429. https://doi.org/10.1029/2022GB007429
- Zhang, D., Li, J., Wu, J., & Cheng, X. (2022). Soil CO2 and CH4 emissions and their carbon isotopic signatures linked to saturated and drained states of the Three Gorges Reservoir of China. Environmental Pollution (Barking, Essex: 1987), 293, 118599. https://doi.org/10.1016/j.envpol.2021.118599
- Zhang, Z., & Furman, A. (2021). Soil redox dynamics under dynamic hydrologic regimes-A review. The Science of the Total Environment, 763, 143026. https://doi.org/10.1016/j.scitotenv.2020.143026
- Zhong, Z., & Makeschin, F. (2006). Differences of soil microbial biomass and nitrogen transformation under two forest types in central Germany. Plant and Soil, 283(1-2), 287–297. https://doi.org/10.1007/s11104-006-0018-z