
 ?Mathematical formulae have been encoded as MathML and are displayed in this HTML version using MathJax in order to improve their display. Uncheck the box to turn MathJax off. This feature requires Javascript. Click on a formula to zoom.
Abstract
Land valuation is essential for developing land use planning and achieving efficient land use, food security, and poverty reduction. This study aimed to assess land suitability for cassava and bean production using the multicriteria decision analysis AHP technique and GIS. Land suitability analysis considers factors affecting crop growth and development, particularly in producing beans and cassava. The Analytical Hierarchy Process (AHP) model was used to determine the importance of main and sub-criteria parameters. ArcGIS software was used to create crop suitability distribution maps for bean and cassava production. Each parameter was subjected to pair-wise comparison by employing the Analytical Hierarchy Process (AHP). The study found that the southern region displayed a vastly suitable level of 38% and 46% for beans and cassava, respectively. Farmers can use the comprehensive data to decide whether to plant beans and cassava on their lands, increasing revenue while preserving soil quality management. The GIS-AHP integration approach was suggested to determine optimal decisions based on chosen criteria.
REVIEWING EDITOR:
1. Introduction
Population growth, agricultural technique advancements, and the introduction of new diversity with economic benefits have all contributed to the rapid development of agricultural production management systems in various countries (Mazahreh et al., Citation2019; Seyedmohammadi et al., Citation2019a). Since time in memoria, humanity has always considered how to use resources as efficiently as possible, and it has come a long way toward accomplishing this goal (Mwendwa et al., Citation2019; Nungula et al., Citation2024). Soil is one of the most significant natural resources that humans use because it forms the foundation of all agricultural activities and natural resources, depends on proper management for the survival of human and animal life, and can be destroyed by improper management. Thus, it is important to use soil in a way to maximizes production without destroying this priceless resource for future use (Everest & Gür, Citation2022; Safwan et al., Citation2022). Additionally, the scarcity of arable land in many nations worries agricultural managers greatly (Navidi et al., Citation2022; Seyedmohammadi et al., Citation2019b). As a result, determining whether a piece of land is suitable for growing crops, especially beans and cassava is crucial. However, it is a significant challenge that needs to be evaluated concurrently due to numerous factors, such as location, climate, soil properties, and their interaction (Luan et al., Citation2021; Nungula et al., Citation2023; Seyedmohammadi et al., Citation2018; Zhang et al., Citation2015). Consequently, efforts must concentrate on evaluating the possibilities and limitations of land for sustainable crop production.
Land evaluation is one of the key steps in reducing human impact on the depletion of natural resources and determining the most suitable options for sustainable land use (Nungula et al., Citation2023). By identifying the primary factors limiting the specified agricultural production, this type of analysis enables decision-makers to implement the best land management practices and increase land productivity (Achoki & Gichaba, Citation2015). It is the information obtained through the land evaluation process that guides decisions on the best utilization of land resources by giving out the constraints and opportunities for specific land use, therefore this process is a necessary prerequisite in the development of land use planning (Ritung et al., Citation2007; Verheye et al., Citation2020). To achieve appropriate land use and lessen pressure and competition on uses of the same land, land evaluation is best approached as a long-term integrated approach. To help land users and farmers achieve high land use efficiency, increase food security, and reduce poverty, the adaptation of land evaluation will ensure the availability of soil information that will provide a picture of the physical and chemical properties of the soil as well as ecological condition characteristics (Nungula et al., Citation2024; Zabihi et al., Citation2015).
Selecting a high-quality, precise algorithm for determining land suitability has a significant influence on both present and future scenarios. Methods like the land suitability assessment with the square root parametric methods and the FAO land assessment framework (Food & Agriculture Organization [FAO], Citation1976), and the traditional methods used to assess land suitability in previous years, such as Rabia and Terribile (Citation2013), and Mathewos et al. (Citation2018), are examples of such cases for proper land management.
With these techniques, crop requirements are compared with land characteristics and soil, climatic, and landscape characteristics are used to determine the degree of suitability for target crops. Assessing the weight of soil, climate, and landscape features that affect land suitability is a crucial and necessary step in determining whether or not a piece of land is suitable for producing crops (Maitra et al., Citation2023; Musakwa, Citation2018). This is because different features have different effects on the production of different crops (Elsheikh et al., Citation2013; Luan et al., Citation2021; Maitra et al., Citation2024; Mwendwa et al., Citation2019).
AHP is among the best methods for determining the effect of multiple and heterogeneous parameters when determining the characteristic weight (Pramanik, Citation2016; Torrieri & Batà, Citation2017). When combined with GIS, the AHP approach is a suitable, superior method for controlling multiple, heterogeneous features (Zabihi et al., Citation2015). AHP-modelling framework is widely accepted and has been extensively applied for multi-criteria decision analysis (MCDA) purposes and utilized in many decision-making problems regarding land suitability evaluation at a regional level (Widiatmaka, Citation2016; Zabihi et al., Citation2015; Zolekar & Bhagat, Citation2015). In addition, the assessment and planning of land suitability for major crops, local foods, and agricultural land use have recently made use of GIS and AHP tools (Zolekar & Bhagat, Citation2015). The integrated use of GIS and AHP offers a lot of advantages including criteria related to vegetation, weather parameters, and topographic features as used in land suitability analyses.
Currently, in Tanzania, there are some studies done on the appraisal of land and its suitability for various crops (Kaaya et al., Citation1994; Kimaro & Hieronimo, Citation2014). However, it is important to highlight that these studies primarily concentrated on gathering data on soil and creating maps of suitability, with little regard for other factors like topography, climate, and socioeconomic characteristics, all of which are crucial for determining suitability (Kimaro & Hieronimo, Citation2014). Furthermore, the studies were conventional in that they focused primarily on expert judgments based on empirical data, with less emphasis on computer-based (GIS-based) land evaluation, which generates a database that can be utilized anywhere, regardless of farm size (Kimaro et al., Citation2001; Msanya et al., Citation2018; Otieno et al., Citation2022). Thus, land suitability analysis for different criteria related to ecological conditions or optimizing bean and cassava production at the regional scale in Tanzania can be done using GIS, and AHP (Nungula, Citation2024)
Bean and cassava are among the most significant, high-consumption, and strategic crops in Tanzania since they grow in a variety of environmental conditions. As a result, they need to be studied using new, improved techniques while taking into account local factors like soil, climate, and landscape features (Chappa, Citation2023). This study’s objectives were to accurately assess whether a piece of land is suitable for growing beans and cassava and present an accurate method by combining GIS technique, and AHP multi-criteria method. It is anticipated the study’s findings will provide insight into the best places to grow beans and cassava and any restrictions that may apply. Furthermore, the outcomes can help stakeholders and the government plan strategically for the development of sustainable agriculture. This will assist in meeting the region’s need for a green economy by maximizing yields, which raises the crop’s potential for production, through mapping appropriate areas for crop cultivation. This will assist in meeting the region’s need for a green economy.
2. Methodology
2.1. Study area description
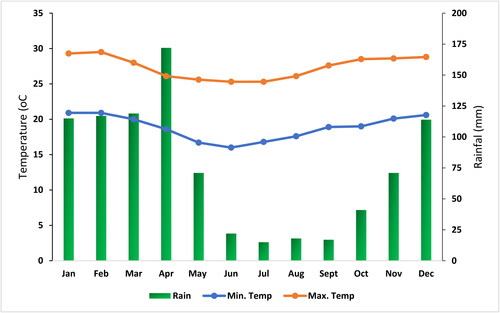
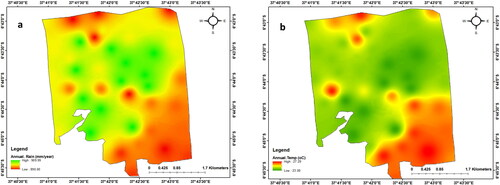
The study was carried out on Tungi Farm in Tanzania’s Morogoro District, which is located at latitude 6°44’15" and longitude 37°42’07" which is approximately 2000 hectares in size (). The region experiences two distinct seasons of rainfall annually. The first, shorter and less intense, lasts from November to January, while the second, longer and heavier, lasts from early March to May and peaks in April (Kihoro et al., Citation2013). Data from the Tanzania Meteorological Agency (TMA) station from 1991 to 2021 shows that the average annual temperature is 22.6 °C and there is an average of 892 mm of rainfall annually ().
Figure 1. Study area.
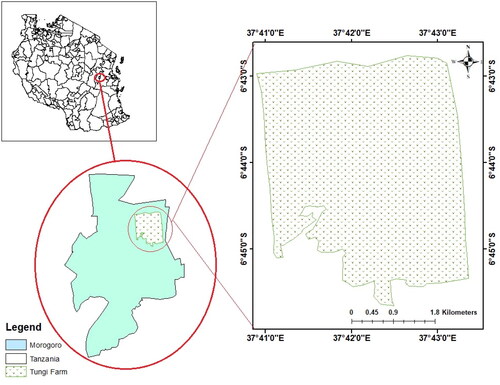
Figure 2. Mean monthly rainfall and temperatures (1991–2021) for the study area.
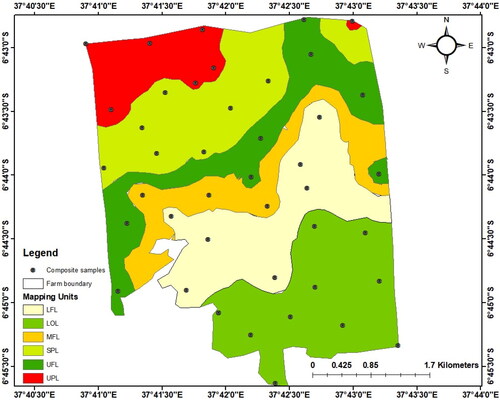
The topography of the area is mostly characterized by a plain and sloping land extending from (459 m a.s.l.) to (554 m a.s.l.). It was divided into six landforms as; LOL (459–469 m) = Lower Land, MFL (501–506 m) = Middle Flat Land, UPL (523–554 m) = Upper Land, UFL (506–511 m) = Upper Flat Land, LFL (489–501 m) = Lower Flat Land, and SPL (469–489 m) = Slopping Land landforms (). The major land-use patterns of the study area comprise cultivated land (84%), and grazing land (16%). Grass, shrubs, shrubs, lower forest cover, and scattered woodlands are the most prevalent vegetation types on the farm. The study area was dominated by the following soil types: Rhodic Umbric Ferralsols (Eutric, Arenic), Haplic Vertsols (Aric, Orchric), Rhodic Eutric Cambisols (Arenic, Aric), Haplic Arenosols (Aric, Orchric), and Umbric Ferralsols (Eutric, Arenic) (Nungula et al., Citation2024).
Figure 3. Mapping units and their respective composite samples.
2.2. Data collection
2.2.1. Terrain distribution parameters data
Digital elevation models (DEM) downloaded from the USGS Earth Explorer in the ArcGIS environment and the original Shuttle Radar Topography Mission (SRTM) were used to calculate the slope and elevation. Using the Universal Transverse Mercator (UTM) projection and the WGS 84 datum (WGS 84 46 N) in the ArcGIS environment, topographical maps were created and the projection was adjusted. By figuring out the maximum rate of change between each cell and its neighbors, the slope was found. Each cell in the output raster had a value for the slope. Whereas a higher slope value denotes a steeper terrain, a lower slope value indicates a flatter terrain. Because of their smooth surface, flat fields were better for crop cultivation because they allowed for more equitable and even water distribution. shows that the study area’s altitude varies from 459 to 554 meters and its slope spans from zero to 4.5%. Rainfall and temperature raster data were obtained for the entire nation from https://worldclim.org, and then the data for the study area was extracted using a mask in ArcGIS to facilitate additional reclassification. The raster has been resampled before being reclassified to achieve the desired cell size, which is consistent with the cell size of other criteria ().
Figure 4. Digital elevation map (a) and slope map (b).
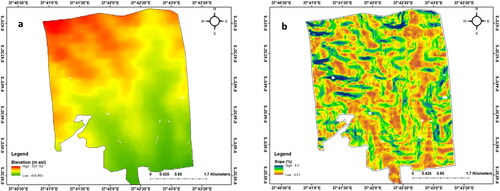
Figure 5. Rainfall map (a), and temperature map (b).
2.2.2. Soil sampling
Before the study during the experiment, each soil mapping unit composite soil samples () were taken at a depth of 0 – 0.3 m using a soil auger for disturbed samples and stainless-steel core rings with a 5 cm diameter for undisturbed samples, as per Pennock and Yates (Citation2008) instructions. Following their packaging in polythene bags, the samples were transported to the laboratory to undergo physical and chemical analyses. Cation Exchange Capacity (CEC), exchangeable K, pH, available P, soil organic carbon (SOC), and total N were among the chemical characteristics taken into consideration. Bulk density and particle size determination were included in the physical characterization. Information on soil type soil depth and drainage was determined and recorded during the characterization of soil.
2.2.3. Laboratory analysis
The hydrometer method was used to analyze soil texture for physical properties (Gee & Bauder, Citation1979). From the undisturbed samples, the bulk density of the soil was calculated using the method outlined by Doran and Mielke (Citation1984). For chemical analyses, the disturbed soil samples were allowed to air dry before being sieved through a 2 mm sieve. A pH meter at 1:2.5 (soil: water) ratio was used for pH determination (Ryan et al., Citation2001). The modified Walkley and Black method (Yeomans & Bremner, Citation1988) was used to analyze organic carbon, and the modified micro-Kjeldahl digestion method (Bremner, Citation1996) was used to analyze total nitrogen. An Atomic Absorption Spectrophotometer (AAS) was used to determine the exchangeable K (Jackson, Citation1967). A spectrophotometer was used to measure the available phosphorous from the soil extract (Murphy & Riley, Citation1962). Cation Exchange Capacity (CEC) was measured by the Ammonium acetate method (Bremner, Citation1996).
2.3. Reclassification criteria
According to the FAO suitability guideline (FAO, Citation1976) (), terrain parameters raster layers were reclassified using the reclassify function in ArcGIS into four classes: vastly suitable (S1), relatively suitable (S2), minimally suitable (S3), and currently unsuitable (N) for both beans and cassava ( and ). Base map vector data for soil physical and fertility parameters, including topsoil texture, soil type, soil pH, soil depth, drainage, organic carbon, topsoil nitrogen, available phosphorous, potassium, and CEC were imported into ArcGIS 10.8. With the extract-by-mask function, the study area is extracted. These data were georeferenced and projected to WGS 1984 UTM 37 N through the projected coordinate system in ArcGIS, transformed into raster data followed by reclassification into different classes following the FAO suitability class guidelines for bean and cassava ( and ). Ultimately, a corresponding score was allocated to every class for every parameter. The reclassified criteria show how the different suitability levels of the criteria are distributed both spatially and geographically.
Table 1. Suitability classes.
Table 2. Criteria requirement for bean production.
Table 3. Criteria requirement for cassava production.
2.4. Criteria weighting using AHP
Assigning weights to the various criteria was done using the Analytic Hierarchy Process (AHP) method of the Multi-Criteria Evaluation (MCE), which compares one criterion to another using a pair-wise preference matrix as explained by Saaty (Citation2014) (). A criterion’s weight value indicates how much weight it is given to other criteria that are being considered; the criterion with the highest weight is therefore given more weight than the others (Kumar et al., Citation2019).
Table 4. The Saaty’s rating scale.
The AHP was computed using the following mathematical model (EquationEquation 1(1)
(1) ).
(1)
(1)
Where A is the consistent matrix, having a set of n objects with weights w1, w2 ……wn (EquationEquation 1(1)
(1) ). A consistent matrix is one in which for each entry aij (the entry in the ith row and jth column), aij = akj = aki. Note that the ratio in entry aij is the ratio of wi to wj (EquationEquation 2
(2)
(2) )
(2)
(2)
A reciprocal matrix is one in which for each entry aij, aji = 1/aij because all consistent matrices are reciprocal matrices (EquationEquation 3(3)
(3) )
(3)
(3)
Note that for a standard scale ratio matrix
(4)
(4)
The eigenvector corresponding to in this equation is essentially the underlying standard scale and thus gives the ranking of each element in the ratio matrix. The last step includes the eigenvalue estimation and matrix (A) creation which finalizes the vector W (EquationEquation 5
(5)
(5) )
(5)
(5)
Consistency Ratio (CR) was calculated using (EquationEquation 6(6)
(6) ). During the judgment, the judgment matrix is only considered consistent if the ratio is < (0.1). A CR of 0.1 or less is more reasonable (Triantaphyllou & Mann, Citation1995).
(6)
(6)
Where CI = Consistency Index; RI = Random Index.
The Consistency Index (CI) value was calculated using the eigenvalue ( value obtained in the AHP calculator and the number of criteria (n) in the AHP calculator using EquationEquation 3
(3)
(3) and Random Index was simply obtained from Random Consistency Index table postulated by Saaty (Citation2014) ().
(7)
(7)
Table 5. Random Consistency Index (RCI).
2.5. Weight overlaying and crop suitability map
In coming up with a crop suitability map for beans and cassava the reclassified layers for the three criteria: terrain distribution, soil physical, and soil fertility parameters were determined by weights produced by the AHP process and were integrated into the ArcGIS environment. Weighted layers for each criterion were then overlayed using the weighted overlay analysis tool, which was created using the raster calculator tool in the spatial analysis tool extension of ArcGIS 10.8 (EquationEquation 8(8)
(8) ) as explained by Tashayo et al. (Citation2020). The overall suitability map was categorized as vastly suitable (S1), relatively suitable (S2), minimally suitable (S3), and currently unsuitable (N).
(8)
(8)
Where S = Suitability score; Wi = Weight of the ith criteria; Xi = Weight of the ith sub-criteria; n = Total number of criteria.
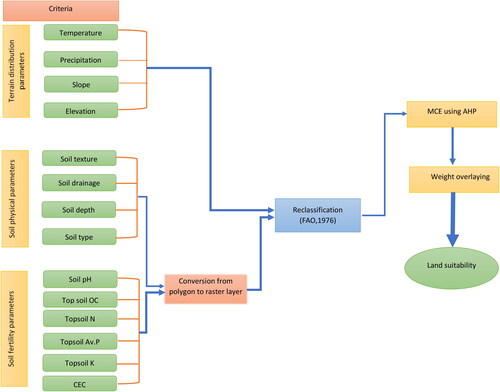
The overall process of producing a suitability map is summarized in .
Figure 6. Methodological flowchart for bean and cassava suitability assessment.
3. Results
3.1. Pair-wise comparison and parametric weights
3.1.1. Bean
Following AHP, fourteen parameters chosen to assess the physical suitability of bean production were compared; the findings are shown in , where precipitation and temperature had the highest weights among the Terrain distribution parameters of 0.37 each while slope had the lowest value (0.12). Topographically, elevation (with a weight of 0.14) was the main contributor to slope. Precipitation and temperature contribution were equally significant in influencing terrain distribution. Soil texture and soil drainage were highly influencing soil physical parameters with weightage of 0.38 and 0.35 respectively with soil depth scoring the lowest weight of 0.12 in this group. For the soil fertility group soil pH score high weight of 0.3 and the available phosphorous score lower weight of 0.09 ().
Table 6. AHP pairwise comparison matrix for bean production.
3.1.2. Cassava
Similarly, AHP was used to compare fourteen parameters selected to evaluate the physical suitability of cassava production; the results in , where temperature (0.41) and precipitation (0.36) had the highest weights among the terrain distribution parameters and slope (0.09) had the lowest. In terms of topography, elevation (0.14) was more important than slope. With weights of 0.36 and 0.33, respectively, soil texture and drainage had a significant impact on soil physical parameters. In this group, soil type received the lowest weight of 0.15. Regarding the soil fertility group, the exchangeable potassium score was lower at 0.11 and the soil pH score was high at 0.25 ().
Table 7. AHP pairwise comparison matrix for cassava production.
Weighting main criteria for beans shows that the soil fertility criterion was ranked first, scoring 0.44, then soil physical (0.39), and the lowest priority was for terrain distribution with a score of 0.17 (). Soil fertility criterion ranked first among other criteria for growing beans as it provides essential nutrients and creates a conducive setting for the growth of beans. Soil fertility including pH, OC, TN, Av. P, K, and CEC are important due to their limiting habit in bean production accompanied by continuous cultivation without adding fertilizer, which decreases the production potential of the land (Chikuvire et al., Citation2007). Similarly weighting the main criteria for cassava shows that soil physical criterion was ranked first by scoring 0.41, then soil fertility (0.33), and the lowest priority was for terrain distribution with a score of 0.26 (). Soil physical criterion ranked first among other criteria for growing cassava as it creates conducive soil conditions for cassava tuber formation, especially soil texture, drainage, and soil type. Soil fertility criteria are also important due to their limiting habit in cassava crops.
Table 8. Main Criteria Pairwise comparison matrix and ranking for bean and cassava production.
3.2. Terrain distribution suitability
Soil properties and crop productivity are primarily influenced by terrain variability (Nungula et al., Citation2023). Terrain distribution affects the physical, chemical, and biological properties of soil and the distribution of nutrients, all of which are factors that contribute to crop growth and development. Soil is the foundation for crop growth and yield, with topography affecting soil qualities greatly (Achoki & Gichaba, Citation2015). Precise elevation information, along with the topographic features it yields, are highly useful for precision farming (Safwan et al., Citation2022). This includes managing and organizing soil and water conservation initiatives for increased profitability, as well as applying seed, fertilizer, and water at the site specifically.
Rainfall and temperature are an important parameter under the terrain group that governs when and how fast a crop will grow and develop in line with precipitation and solar radiation (Nungula et al., Citation2024). Other factors that restrict the growth and development of crops are slope and altitude. Most agricultural practices, irrigation techniques, and rates of erosion are impacted by the slope factor (Safwan et al., Citation2022). The temperature of the soil and microbiological activity are impacted by altitude (Everest & Gür, Citation2022). According to the data the elevation range was 523–550 masl with 100% of the region (S1), which was extremely suitable for beans and cassava. Also, the slope varied according to the results of the digital elevation model, with ranges varying from 0 to 4.5% with 4.5 and 95.6% of the area deemed to be relatively suitable (S2) and vastly suitable (S1), respectively for both crops.
The distribution parameters of the terrain can be a major factor in restricting the yield of particular kinds of crops (Nungula et al., Citation2023). For the bean crop, the precipitation and temperature parameters had the same weightage value of 0.37 followed by temperature, elevation, and slope (). To ascertain the importance of these elements in the total farm plot-based suitability, the climate and topographic parameters were also examined. The study area’s terrain distribution parameters suitability map revealed that approximately 87.6% of the area falls under the vastly suitable (S1) and 14.3% under relatively suitable (S2) classes (; ). In the same way, for the cassava crop, the terrain distribution parameters’ CR value was 0.01. shows that the precipitation and temperature parameters scored highest based on AHP weightage. Nearly 100% percent of the study area falls under the vastly suitable (S1) class, less than 0.001 percent under the minimally suitable (S3) class according to the terrain distribution parameters of the cassava suitability map (; ).
Figure 7. Terrain distribution suitability map for bean (a) and cassava (b).
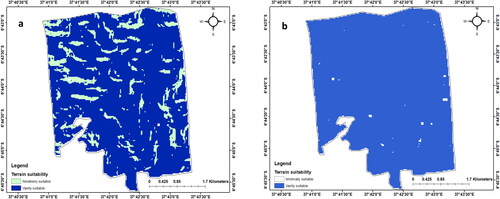
Table 9. Area percent coverage of the main parameter for land suitability assessment of bean and cassava crop.
3.3. Soil physical suitability
The degree of soil cultivation and the amount of biological activity that the soil can support are determined by the physical characteristics of the soil. The physical characteristics of the soil also have a major impact on how well plants can absorb water and air from it (Nungula, et al., Citation2024). Changes in the land use and management system affect many physical properties of the soil, including the type of land, the intensity of cultivation, and the tool used (Mwendwa et al., Citation2019). Exposing the less permeable soil to runoff and erosion losses to meet the food demands under cultivation. In this study, the soil texture, soil drainage, soil type, and rooting depth of the soil were observed to affect the production of beans and cassava (Elsheikh et al., Citation2013; Luan et al., Citation2021). Where by the soil texture was significantly seen to affect the crop production in this group. Analysis showed that the soil texture ranged from sand to loam. Soil drainage was in the form of poorly drained soils for the vertisols which cannot support bean and cassava production whereas others were well drained in the case of the Arenosols, Cambisols, and Ferrallisols which are minimally, relatively, and vastly suitable for bean and cassava respectively. But also, the soil depth ranges from 90 m up to 130+ m deep which is relatively vastly suitable for bean and cassava production.
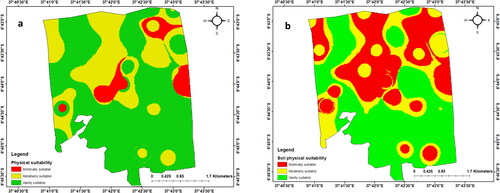
For the bean production, soil texture is the most influential parameter for bean crop production, with the highest weightage of 0.38 and soil depth with weightage of 0.12 and CR at 0.04. The vastly suitable class (S1), according to the soil physical parameters, covered about 63.5% of the area, while the relatively suitable (S2) and minimally suitable (S3) classes covered 30.4% and 6.3% of the area, respectively (; ). In a similar context, for cassava production, the soil texture parameter had the highest weight value (0.35) while soil type had the lowest value (0.15) for the cassava crop. Regarding the soil physical parameters, and show that the vastly suitable (S1) class accounted for about 45.1% of the total area, while the relatively suitable (S2) and minimally suitable (S3) class covered about 23.4% and 31.5% respectively.
Figure 8. Soil physical parameters suitability map for bean (a) and cassava (b).
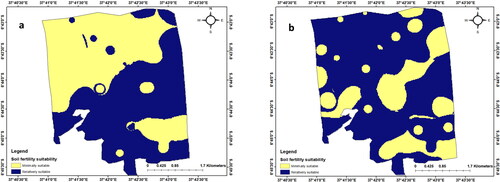
3.4. Soil fertility suitability
The chemical properties of soil are utilized as a gauge to determine the soil’s quality in relation to crop yields, environmental quality, and nutrient availability (Mugo et al., Citation2016). The pH of the soil has a significant impact on the nutrients that are available in the soil and how well they are absorbed by plants (Aden, Citation2023; Ochieng’, Citation2021). It also indicates whether a given area is suitable for producing crops (Cheptoek, Citation2022; Elsheikh et al., Citation2013). The mean pH of the soil in the current study was 6.3, which is fairly acidic. The pH level was largely and reasonably appropriate for the production of cassava and beans. The most crucial factors in choosing the most suitable land are provided by organic carbon (OC), which serves as a bank to store nutrients and gradually release them to the plants (Haile et al., Citation2023). It also provides nutrients and energy to the soil microbes (Nungula et al., Citation2024). The farm’s average OC was 0.35%, which is extremely ideal for crops like cassava and beans. Comparably, the average levels of available phosphorus and total nitrogen were 6.28 mg kg−1 and 0.35%, respectively, which are vastly appropriate for crops like cassava and beans. Average values for potassium and CEC were 0.44 and 6.67 cmol kg−1, respectively, and were deemed to be minimally suitable for the production of beans and cassava. Additionally, low CEC soil indicates low organic matter content, which indicates low water-holding capacity and necessitates the addition of more fertilizer due to its susceptibility to leaching and eventual low yield (Nyawade et al., Citation2019).
For the bean crop in the soil fertility group, the soil pH parameters had the highest weight (0.25) (). The maximum area falls under the relatively suitable (S2) class for bean land suitability assessment followed by minimally suitable with coverage of 54.1% and 45.8%. For the cassava crop, topsoil K has the lowest weight (0.11) and soil pH has the highest weight (0.25) among the soil fertility group (). Based on the parameters of soil fertility parameter, 18.5% of the land was classified as relatively suitable (S2), and 81.5% as minimally suitable (S3) for cassava LSA (; ).
Figure 9. Soil fertility parameters map for bean (a) and cassava (b).
3.5. Overall suitability
3.5.1. Bean
Following the integration of all parameter weights from the AHP matrix, the final map estimating the bean crop status was created (). According to , the soil fertility parameter had the highest weight (0.44), while the terrain distribution parameter had the lowest weight (0.17). The ultimate bean suitability map was created by superimposing the weighted values into four levels, with sigma max and CR values of 5.05 and 0.01 under the allowable bounds, respectively (; ). According to the final bean crop suitability, the maximum area was classified as vastly suitable class (37.9%) minimally suitable class (31.8%), and relatively suitable class (30.4%) in that order. Currently, the southern portion of the study area has a higher level of farm mechanization than other parts, making it home to the vastly suitable class (S1) (; ).
Figure 10. Suitability map for bean (a) and cassava (b).
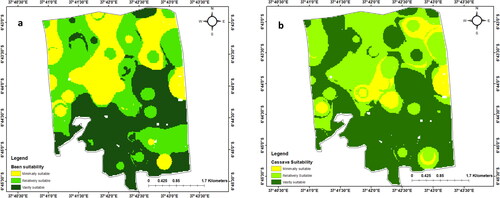
Table 10. Suitability and area coverage of Tungi Farm for bean and cassava production.
3.5.2. Cassava
In a similar vein, the final cassava suitability assessment result showed that the local variation parameter delineated with the lowest weight and the terrain distribution parameters had the highest weight. The AHP weighted technique was used to create the final potato crop estimation status. The final potato crop suitability assessment result showed that the vastly suitable class made up the largest percentage of the study area, accounting for 46.1% of the total. On the other hand, the region’s identified areas fall into two categories: approximately 41.0% under the relatively suitable, and 12.9% under the minimally suitable. When compared to other study areas, the northern portion of the area had low soil fertility and acidic soil conditions, which led to the finding of the relatively suitable class (S1) (; ).
4. Discussion
Land suitability analysis is essential for crop production because it feeds the ever-expanding population. By giving various parameters weights, the AHP technique is a powerful tool for efficient land suitability analysis that enables users to determine the consistency of various parameters. Users can decide on the proper weighting for each parameter during the analysis by involving GIS-AHP integration. Since it finally plans for the supply of vital nutrients and fostering a growth-friendly environment. Optimal conditions for crop suitability management for beans and cassava are provided by implementing GIS-AHP and incorporating biophysical variables. This improves crop management efficiency and helps farmers create effective fertilizer application plans (Ranjan et al., Citation2023). By using the AHP approach, users can calculate the consistency of different parameters by assigning weights to them. When using mapping techniques, GIS becomes a contemporary tool for managing and creating comprehensive analyses of land suitability (Otieno et al., Citation2022, Citation2023; Nungula et al., Citation2024).
The GIS-AHP approach’s integration enables users to determine the appropriate weighting for each parameter during the Land Suitability Analysis. Precision agriculture achieves greater success when such an integration technique is used to perform land suitability analysis. Implementing GIS-AHP and incorporating various biophysical variables offers optimal conditions for crop suitability management by assessing the biophysical parameters, such as soil, climate, and topography. Utilizing this technique improves crop management efficiency on the farm by offering a biophysical assessment that enables farmers to choose and implement effective crop and soil management techniques to attain high yields. Additionally, it will support farmers and extension personnel in creating efficient fertilizer application plans that will boost crop performance and maximize potential yield.
Soil fertility criterion ranked first among other criteria for growing beans as it provides essential nutrients and creates a conducive setting for the growth of such crops. Soil fertility including pH, OC, TN, Av. P, K, and CEC are important due to their limiting attributes in crop production accompanied by continuous cultivation without adding fertilizer, which decreases the production potential of the land (Chikuvire et al., Citation2007; Jena et al., Citation2022; Mirriam, Citation2023; Mwakidoshi, Citation2023). The results show that there are differences in elevation ranges and variations in altitude in the study area. Six topographic landforms were identified in the area based on slope and elevation characteristics: low land, slopping land, upper land, medium flat land, and lower flat land. A slightly plain area with 2 g kg−1 of soil organic matter, a pH range of 6.0–6.5, a texture class of loamy to sandy loam, favorable levels of N, P, and K, and optimal average temperatures between 25 and 30 °C the ideal range for the crops was highlighted. Upon integration of the three criteria (soil, climate, and topography) in ArcGIS, this southern region displays a vastly suitable level of 37.9% (757.2 ha) and 46.1% (922 ha) for beans and cassava, respectively. Aside from this, the suitability analysis shows that 20.4% (607 ha) and 41.0% (819.2 ha) of the land had a relatively suitable level for bean and cassava while 31.8% (635.8) and 12.9 (258.8) of the land were minimally suitable land for bean and cassava, which is defined by pH ranges of 5.5–6.0, and low available potassium and phosphorus as a result of leaching and nutrient washing by rainwater.
According to the study’s findings, regular soil analysis is essential for tracking the amount of accessible nutrients in the soil at a given time and location. This allows for the proper application of management practices at the appropriate time, location, and quantity. The goal is to achieve high land productivity. Since this study used a qualitative approach to analyze soil data, more research based on quantitative measures of soil suitability is required. Based on the study’s results, farmers will also be able to use the comprehensive data to decide whether to plant beans and cassava on their lands, as it presents an opportunity to increase revenue while preserving soil quality management. By incorporating several criteria to determine which decisions are optimal based on the chosen criteria, the GIS-AHP integration approach was suggested. Based on actual field conditions, the criteria might show which choice was made. The goal of the study was to thoroughly analyze the many variables influencing bean and cassava growth and yield in the research region. Additionally, the sub-criteria were confirmed as a crucial requirement that could be utilized in agricultural production planning.
6. Conclusion
The goal of land suitability is to take into account every factor that could affect crop growth and development, especially in the case of producing beans and cassava. The final land suitability analysis was conducted using a model based on the Analytical Hierarchy Process (AHP), which was utilized to determine the relative importance of the main criteria and sub-criteria parameters. Using the ArcGIS software environment, crop suitability distribution maps were created for bean and cassava production based on this analysis. AHP is a better technique for weighing many factors, and in the presence of conflicting criteria, its consistency can be monitored and managed. However, GIS is an effective tool that can be used to define the study area, gather and handle geographic data, and display the findings of a land suitability analysis. Given that the results of the integration of GIS and AHP offer precise and potent combinations for land suitability analysis, better management approaches for land use efficiency and better management for bean and cassava production are assured.
Authors’ contributions
The authors confirm contribution to the paper as follows: study conception and design were contributed by EZN, HIG, BHJM, LRC, DMN, NA, and MFS; data collection was contributed by EZN, NA, BHJM, LRC, DMN, and HIG; analysis and interpretation of results were contributed by EZN, BHJM, LRC, DMN, and HIG; draft manuscript preparation was contributed by EZN, LRC, DMN, MFS, BHJM, and HIG. All authors reviewed the results and approved the final version of the manuscript.
Disclosure statement
No potential conflict of interest was reported by the author(s).
Data availability statement
Data are available from the corresponding author upon reasonable request.
Additional information
Funding
Notes on contributors
Emmanuely Z. Nungula
Emmanuely Nungula is an assistant lecturer based at Mzumbe University, Tanzania with a passionate research interest in GIS, soil fertility management, and land use planning.
Boniface J. Massawe
Boniface Massawe is a lecturer, pedologist, and land use planning specialist based at Sokoine University of Agriculture, Tanzania.
Luciana R. Chappa
Luciana R. Chappa is an agronomist and soil scientist from Mzumbe University, Tanzania.
Daniel M. Nhunda
Daniel Nhunda is an assistant lecturer specializing in soil fertility and plant nutrition from Sokoine University of Agriculture, Tanzania.
Mahmoud F. Seleiman
Mahmoud Seleiman is an agronomist from King Saud University, Saudi Arabia, whereas Nawab Ali is a Biosystems Engineer based at Michigan State University USA.
Nawab Ali
Mahmoud Seleiman is an agronomist from King Saud University, Saudi Arabia, whereas Nawab Ali is a Biosystems Engineer based at Michigan State University USA.
Harun I. Gitari
Jayne Mugwe and Harun Gitari are dedicated lecturers at Kenyatta University with expertise in Integrated Soil Fertility Management.
References
- Achoki, D. O., & Gichaba, C. M. (2015). Geographic information systems and remote sensing for food security in Kenya. Department of Geology; University of Nairobi.
- Aden, M. (2023). Buffel (Cenchrus ciliaris) and Sudan (Sorghum sudanense) grasses’ growth, yield and quality responses to nitrogen application in Mandera County, Kenya [Master Thesis]. Kenyatta University.
- Bremner, J. M. (1996). Nitrogen total. In D. L. Sparks, A. L. Page, P. A. Helmke, R. H. Loeppert, P. N. Soltanpour, M. A. Tabatabai, C. T. Johnston, & M. E. Sumner (Eds.), Methods of soil analysis, part 3: Chemical methods (pp. 1–18). Soil Science Society for America Journals, Inc.
- Chappa, L. R. (2023). Soil chemical properties and sunflower (Helianthus annuus L) productivity responses to sunn Hemp intercropping and mineral fertilizer application in Dodoma, Tanzania [Master thesis]. Kenyatta University.
- Cheptoek, R. P. (2022). Organic and inorganic soil amendments effects on maize performance, economic returns and phosphorus use efficiency in Kakamega County, Kenya [Master thesis]. Kenyatta University.
- Chikuvire, T. J., Mpepereki, S., & Foti, R. (2007). Soil fertility variability in sandy soils and implications for nutrient management by smallholder farmers in Zimbabwe. Journal of Sustainable Agriculture 30(2): 69–87.
- Doran, J. W., & Mielke, L. N. (1984). A rapid, low-cost method for determination of soil bulk density. Soil Science Society of America Journal, 48(4), 717–719. https://doi.org/10.2136/sssaj1984.03615995004800040004x
- Elsheikh, R., Shariff, A. R. B. M., Amiri, F., Ahmad, N. B., Balasundram, S. K., & Soom, M. A. M. (2013). Agriculture Land Suitability Evaluator (ALSE): A decision and planning support tool for tropical and subtropical crops. Computers and electronics in agriculture, 93: 98–110.
- Everest, T., & Gür, E. (2022). A GIS-based land evaluation model for peach cultivation by using AHP: A case study in NW Turkey. Environmental Monitoring and Assessment, 194(4), 241. https://doi.org/10.1007/s10661-022-09898-6
- Food and Agriculture Organization. (1976). A framework for land evaluation: Soils Bulletin 32. Food and Agriculture Organization of the United Nations.
- Gee, G. W., & Bauder, J. W. (1979). Particle size analysis by hydrometer: A simplified method for routine textural analysis and a sensitivity test of measured parameters. Soil Science Society of America Journal, 43(5), 1004–1007. https://doi.org/10.2136/sssaj1979.03615995004300050038x
- Haile, M. A., Karanja, N. N., Nyawade, S. O., Gitari, H. I., Cheruto, G., Nyawira, L., Raza, M. A., & Kamau, S. (2023). Lupin and Lima beans diminish potatoes’ N and P uptake, uptake efficiency and use efficiency. Potato Research, 1–17. https://doi.org/10.1007/s11540-023-09625-9
- Jackson, M. L. (1967). Soil chemical analysis. Prentice Hall of India Private Limited.
- Jena, J., Maitra, S., Hossain, A., Pramanick, B., Ireri, G. H., Praharaj, S., Shankar, T., Palai, J. B., Rathore, A., Mandal, T. K., & Jatav, H. S. (2022). Role of legumes in cropping system for soil ecosystem improvement. In H. S. Jatav & V. D. Rajput (Eds.), Ecosystem services: Types, management and benefits. Nova Science Publishers, Inc. https://doi.org/10.52305/PFZA6988.
- Kaaya, A. K., Msanya, B. M., & Mrema, J. P. (1994). Soils and land evaluation of part of the Sokoine University of Agriculture farm (Tanzania) for some crops under rainfed conditions. African Studies Monographs, 15, 97–117.
- Kihoro, J., Bosco, N., & Murage, H. (2013). Suitability analysis for rice growing sites using a multi-criteria evaluation and GIS approach in great Mwea region, Kenya. SpringerPlus, 2, 12–20. https://doi.org/10.1186/2193-1801-2-265.
- Kimaro, D., & Hieronimo, P. (2014). Land for agriculture in Tanzania: Challenges and opportunities. Journal of Land and Society, 1, 91–102.
- Kimaro, D. N., Msanya, B. M., Mwango, S. B., Kimbi, G. G., & Kileo, E. P. (2001). Land suitability evaluation for the production of the major crops in the Southwestern part of the Uluguru Mountains, Morogoro Rural District, Tanzania. Soils and Land Resources of Morogoro Rural and Urban Districts, 2.
- Kumar E. S., Mandal T. K., Mishra G. C., Barman S., Maitra S. (2019). Effect of intercropping summer sunflower (Helianthus annuus L.) with legumes on yield attributes and productivity of crops. Int J Agric Environ Biotechnol 12:281–285. https://doi.org/10.30954/0974-1712.08.2019.12.
- Luan, C., Liu, R., & Peng, S. (2021). Land-use suitability assessment for urban development using a GIS-based soft computing approach: A case study of Ili Valley, China. Ecological Indicators, 123, 107333. https://doi.org/10.1016/j.ecolind.2020.107333
- Maitra, S., Bhattacharya, U., Pramanick, B., Sagar, L., Gaikward, D. J., Pramanick, B., Sairam, M., Sahoo, U., Jatav, H. S., Gitari, H. I., Shankar, T., Kandileri, A. M., Rezaei-Chiyaneh, E., & Hossain, A. (2024). Agroforestry: A resource conserving technology for efficient utilization of agricultural inputs, leads to food and environmental security. In H. S. Jatav, V. D. Rajput, T. Minkina, E. D. Van Hullebusch, & A. Dutta (Eds.), Agroforestry to combat global challenges. Sustainable development and biodiversity (Vol. 36). Springer. https://doi.org/10.1007/978-981-99-7282-1_2
- Maitra, S., Sahoo, U., Sairam, M., Gitari, H., Rezaei-Chiyaneh, E., Battaglia, L., & Hossain, A. (2023). Cultivating sustainability: A comprehensive review on intercropping in a changing climate. Research on Crops, 24(4), 702–715. https://doi.org/10.31830/2348-7542.2023.ROC-1020
- Mathewos, M., Dananto, M., Erkossa, T., & Mulugeta, G. (2018). Parametric land suitability assessment for rainfed agriculture: The case of Bilate Alaba Sub-watershed, Southern Ethiopia. Agrotechnology, 07(02), 183. https://doi.org/10.4172/2168-9881.1000183
- Mazahreh, S., Bsoul, M., & Hamoor, D. A. (2019). GIS approach for assessment of land suitability for different land use alternatives in semi-arid environment in Jordan: Case study (AlGadeer Alabyad-Mafraq). Information Processing in Agriculture, 6(1), 91–108. https://doi.org/10.1016/j.inpa.2018.08.004
- Mirriam, A. (2023). Optimizing soybean yield, phosphorus use efficiency and economic returns using phosphatic fertilizer and inoculation with Bradyrhizobium japonicum in Lira City, Uganda [Master thesis]. Kenyatta University.
- Msanya, B. M., Mwasyika, T. A., Amuri, N., Semu, E., & Mhoro, L. (2018). Pedological characterization of typical soils of Dodoma Capital City District, Tanzania: Soil morphology, physico-chemical properties, classification, and soil fertility trends. Annals of Advanced Agricultural Sciences, 2(4). https://doi.org/10.22606/as.2018.24002
- Mugo, J. W., Kariuki, P. C., & Musembi, D. K. (2016). Identification of suitable land for green gram production using GIS-based analytical hierarchy process in Kitui County, Kenya. Journal of Remote Sensing & GIS, 5(3). https://doi.org/10.4172/2469-4134.1000170
- Murphy, J., & Riley, J. P. (1962). A modified single solution method for the determination of phosphate in natural waters. Analytica Chimica Acta, 27, 31–36. https://doi.org/10.1016/S0003-2670(00)88444-5
- Musakwa, W. (2018). Identifying land suitable for agricultural land reform using GIS-MCDA in South Africa. Environment, Development and Sustainability, 20(5), 2281–2299. https://doi.org/10.1007/s10668-017-9989-6
- Mwakidoshi, E. R. (2023). Potato (Solanum tuberosum L.) growth and yield as influenced by bioslurry and inorganic fertilizer in Taita Taveta County, Kenya [Master thesis]. Kenyatta University.
- Mwendwa, S. M., Mbuvi, J. P., & Kironchi, G. (2019). Land evaluation for crop production in Upper Kabete Campus field, University of Nairobi, Kenya. Chemical and Biological Technologies in Agriculture, 6(1), 1–10. https://doi.org/10.1186/s40538-019-0156-1
- Navidi, M. N., Seyedmohammadi, J., & McDowell, R. W. (2022). A proposed new approach to identify limiting factors in assessing land suitability for sustainable land management. Communications in Soil Science and Plant Analysis, 53(19), 2558–2573. https://doi.org/10.1080/00103624.2022.2072511
- Nungula, E. Z. (2024). Geographic Information System-based land evaluation and suitability assessment for sunflower (Helianthus annus) production in Morogoro District, Tanzania [MSc thesis]. Kenyatta University.
- Nungula, E. Z., Mugwe, J., Massawe, B. H. J., & Gitari, H. (2024). Morphological, pedological and chemical characterization and classification of soils in Morogoro District, Tanzania. Agricultural Research, 1–11. https://doi.org/10.1007/s40003-023-00693-4
- Nungula, E. Z., Mugwe, J., Massawe, B. H. J., Seleiman, M. F., Ali, N., & Gitari, H. I. (2024). GIS-AHP based approach in land evaluation and suitability assessment for sunflower (Helianthus annus) Production. Cogent Food & Agriculture, 10(1), 2309831. https://doi.org/10.1080/23311932.2024.2309831
- Nungula, E. Z., Mugwe, J., Nasar, J., Massawe, H. J., Karuma, A. N., Maitra, S., Seleiman, M. F., Dindaroglu, T., Khan, N., & Gitari, H. I. (2023). Land degradation unmasked as the key constraint in sunflower (Helianthus annus) production: Role of GIS in revitalizing this vital sector. Cogent Food & Agriculture, 9(2), 2267863. https://doi.org/10.1080/23311932.2023.2267863
- Nyawade, S. O., Karanja, N. N., Gachene, C. K. K., Gitari, H. I., Schulte-Geldermann, E., & Parker, M. L. (2019). Short-term dynamics of soil organic matter fractions and microbial activity in smallholder legume intercropping systems. Applied Soil Ecology, 142, 123–135. https://doi.org/10.1016/j.apsoil.2019.04.015
- Ochieng’, I. O. (2021). Effectiveness of inorganic nitrogen forms on maize performance, nitrogen use efficiency and grain protein content in Kiambu County, Kenya [Master thesis]. Kenyatta University.
- Otieno, M. A., Gitari, H. I., Danga, B., & Karuma, A. N. (2022). Soil properties and fertility management with respect to Capsicum (Capsicum annum L.) production in Nairobi Peri-urban Counties. Journal of Soil Science and Plant Nutrition, 22(1), 374–392. https://doi.org/10.1007/s42729-021-00655-1
- Otieno, M. A., Gitari, H. I., Sagar, M., & Nungula, E. Z. (2023). GIS-AHP technique land suitability assessment for capsicum (Capsicum annuum L.) production. International Journal of Biological Sciences, 10(1), 19–30. https://doi.org/10.30954/2347-9655.01.2023.3.
- Pennock, D., & Yates, T. (2008). Soil sampling designs. In M. R. Carter & E. G. Gregorich (Eds.), Soil sampling and methods of analysis (2nd ed., pp. 25–38). Taylor and Francis Group.
- Pramanik, M. K. (2016). Site suitability analysis for agricultural land use of Darjeeling district using AHP and GIS techniques. Modeling Earth Systems and Environment, 2, 56.
- Rabia, A. H., & Terribile, F. (2013). Introducing a new parametric concept for land suitability assessment. International Journal of Environmental Science and Development, 4(1), 15–19. https://doi.org/10.7763/IJESD.2013.V4.295
- Ranjan, S., Sow, S., Kumar, M., Kumar, N., Padhan, S. R., Roy, D. K., Dayal, P., Nath, D., Kumar, P., & Gitari, H. (. (2023). Artificial intelligence for maximizing agricultural input use efficiency: Exploring nutrient, water and weed management strategies. Frontiers in Environmental Science, 11,1243292. https://doi.org/10.3389/fenvs.2023.1243292
- Ritung, S., Wahyunto, A. F., & Hidayat, H. (2007). Land suitability evaluation with a case map of Aceh Barat District. Indonesian Soil Research Institute and World Agroforestry Centre.
- Ryan, J., George, E., & Rashid, A. (2001). Soil and plant analysis laboratory manual (2nd ed., pp. 46–48). Jointly published by the International Centre for Agricultural Research in the Dry Areas (ICARDA) and the National Agricultural Research Centre (NARC).
- Saaty, T. L. (2014). Analytic hierarchy process. Wiley Stats Ref: Statistics Reference Online, University of Pittsburgh.
- Safwan, M., Alsafadi, K., Ali, H., Mousavi, S. M. N., Kiwan, S., Hennawi, S., Harsanyie, E., Pham, Q. B., Linh, T. T., Ali, R., Anh, D. T., & Thai, V. N. (2022). Assessment of land suitability potentials for winter wheat cultivation by using a multi-criteria decision support-geographic information system (MCDS-GIS) approach in Al-Yarmouk Basin (Syria). Geocarto International, 37(6), 1645–1663. https://doi.org/10.1080/10106049.2020.1790674
- Seyedmohammadi, J., Sarmadian, F., Jafarzadeh, A. A., & McDowel, R. W. (2019a). Integration of ANP and Fuzzy set techniques for land suitability assessment based on remote sensing and GIS for irrigated maize cultivation. Archives of Agronomy and Soil Science, 65(8), 1063–1079. https://doi.org/10.1080/03650340.2018.1549363
- Seyedmohammadi, J., Sarmadian, F., Jafarzadeh, A. A., & McDowell, R. W. (2019b). Development of a model using matter element, AHP and GIS techniques to assess the suitability of land for agriculture. Geoderma, 352, 80–95. https://doi.org/10.1016/j.geoderma.2019.05.046
- Seyedmohammadi, J., Sarmadian, F., Jafarzadeh, A. A., Ghorbani, M. A., & Shahbazi, F. (2018). Application of SAW, TOPSIS and fuzzy TOPSIS models in cultivation priority planning for maize, rapeseed and soybean crops. Geoderma, 310, 178–190. https://doi.org/10.1016/j.geoderma.2017.09.012
- Tashayo, B., Honarbakhsh, A., Akbari, M., & Eftekhari, M. (2020). Land suitability assessment for maize farming using a GIS-AHP method for a semi-arid region, Iran. Journal of the Saudi Society of Agricultural Sciences, 19(5), 332–338. https://doi.org/10.1016/j.jssas.2020.03.003
- Torrieri, F., & Batà, A. (2017). Spatial multi-criteria decision support system and strategic environmental assessment: A case study. Buildings, 7(4), 96. https://doi.org/10.3390/buildings7040096
- Triantaphyllou, E., & Mann, S. H. (1995). Using the analytic hierarchy process for decision making in engineering applications: Some challenges. International Journal of Industrial Engineering: Applications and Practice, 2(1), 35–44.
- Verheye, W., Koohafkan, P., & Nachterg, F. (2020). Land use, land cover and soil sciences (Vol. II – The FAO guidelines for land evaluation. http://www.eolss.net/Eolss-sample.
- Widiatmaka, W. (2016). Integrated use of GIS, AHP and remote sensing in land use planning for tropical high-altitude vegetable crops. Journal of Applied Horticulture, 18(02), 87–99. https://doi.org/10.37855/jah.2016.v18i02.19
- Yeomans, J. C., & Bremner, J. M. (1988). A rapid and precise method for routine determination of organic carbon in soil. Communications in Soil Science and Plant Analysis, 19(13), 1467–1476. https://doi.org/10.1080/00103628809368027
- Zabihi, H., Ahmad, A., Vogeler, I., Said, M. N., Golmohammadi, M., Golein, B., & Nilashi, M. (2015). Land suitability procedure for sustainable citrus planning using the application of the analytical network process approach and GIS. Computers and Electronics in Agriculture, 117, 114–126. https://doi.org/10.1016/j.compag
- Zhang, J., Su, Y., Wu, J., & Liang, H. (2015). GIS based land suitability assessment for tobacco production using AHP and fuzzy set in Shandong province of China. Computers and Electronics in Agriculture, 114, 202–211. https://doi.org/10.1016/j.compag.2015.04.004
- Zolekar, R. B., & Bhagat, V. S. (2015). Multi-criteria land suitability analysis for agriculture in hilly zone: remote sensing and GIS approach. Computers and Electronics in Agriculture, 118, 300–321. https://doi.org/10.1016/j.compag