
 ?Mathematical formulae have been encoded as MathML and are displayed in this HTML version using MathJax in order to improve their display. Uncheck the box to turn MathJax off. This feature requires Javascript. Click on a formula to zoom.
Abstract
The COVID-19 pandemic and associated policy responses disproportionately affected low-income households in Nairobi, Kenya. This study sought to provide empirical evidence on the responses of urban slum dwellers to the impact of COVID-19 on their diets and to determine the effectiveness of these responses. The study used four-wave balanced panel data collected during the pandemic from 437 households in Kibera and Mathare slums. To answer the research questions, the study calculated household Food Consumption Scores from the 7-day food consumption data, together with other socio-economic indicators collected in the surveys. Triangulation was also done using Key Informant Interviews with community leaders. The study employed a combination of descriptive analysis and Fixed Effects model to analyze the survey data, and content analysis for key informant data. Results show that during the COVID-19 pandemic, only 38% of slum dwellers had consistently acceptable diets, while another two-thirds (61%) of the households fluctuated between acceptable and unacceptable diets, indicating the vulnerability of urban slum dwellers’ diets to food system shocks such as the COVID-19 pandemic. Household response strategies included changing consumption behavior, reorganizing household finances, reducing urban household size, prioritizing children’s access to food, relying on social networks, and relying on household food production. Some coping strategies were ineffective in improving the dietary intake of urban slum dwellers. However, changing consumption behavior by eating less preferred foods was associated with improved dietary intake. Conversely, changing consumption behavior by skipping meals, eating less variety of foods, and reducing urban household size were negatively associated with improved dietary intake. The study also finds that self-employment to generate higher income played a critical role in improving the diet of slum dwellers during the COVID-19 pandemic. The findings suggest that targeted strategies to stabilize livelihoods, incomes, and food access are critical to building resilience and responding to food system crises.
Keywords:
Reviewing Editor:
Introduction
The current food system is faced with the challenge of providing adequate nutrition to an ever-increasing world population (Trinh et al., Citation2021). According to the State of Food Security and Nutrition in the World 2019 report, an estimated 821 million people were undernourished between 2016 and 2018, most of them living in low-income countries (FAO, Citation2019). FAO’s 2023 State of Food Security and Nutrition in the World report shows that the pandemic increased the number of people facing hunger in the world by an estimated 90 million from 2019 to 2020 (FAO, Citation2022) and increased the prevalence of undernourishment by 1.4% between 2019 and 2012 (FAO, Citation2021). The pandemic has hurt food and nutrition security around the world.
In March 2020, the World Health Organization (WHO) declared COVID-19 disease a global pandemic (WHO, Citation2020). The declaration triggered global efforts to contain the spread of the disease. Despite concerted efforts and interventions to contain the virus, the disease evolved into an unprecedented public health crisis with huge economic and social impacts (Kansiime et al., Citation2021). In East Africa, the first case of COVID-19 was reported in Kenya on March 13, 2020 (MoH, Citation2020), and the disease has continued to spread in the region with new infections reported every day (Kansiime et al., Citation2021).
The Kenyan government, like many governments around the world, introduced several containment measures against the spread of the disease, including national and sub-national dusk-to-dawn curfews, periodic lockdowns, movement restrictions in COVID-19 hotspot areas, border closures, social distancing, and closure of non-essential services (Kansiime et al., Citation2021). While these response strategies were necessary to contain the spread of the COVID-19 virus, they posed a significant threat to livelihoods and food and nutrition security (Chege et al., Citation2021; Chege et al., Citation2022; Demeke et al., Citation2020; High-Level Panel of Experts (HLPE), Citation2020), especially to the vulnerable segments of the society. Béné et al. (Citation2021) argues that while the pandemic affected everyone, it had the greatest impact on the world’s poorest and most vulnerable people, such as the urban poor. According to Chege et al. (Citation2022), the COVID-19 containment measures disproportionately affected the urban poor, whose reliance on low-wage, casual employment and frequent market purchases led to widespread food and nutrition insecurity and other vulnerabilities.
A growing literature documents the impact of the COVID-19 pandemic on different sectors of the economy, including the health, agriculture, transportation, communications, manufacturing, and trade sectors, among others. The growing literature also documents the impact of the COVID-19 pandemic at different governance levels, such as regional, national, sub-national, community and household levels. Some studies show significant impacts on rural communities and economies, including job losses, lower livestock trade volume, and smaller income from remittances (Mueller et al., Citation2021; OECD, Citation2020; Olwande et al., Citation2021; Shafi et al., Citation2021; Sitko et al., Citation2022). Other studies have focused on the impacts of the COVID-19 pandemic on urban livelihoods, communities, and food systems, showing high employment losses, lower wages, and a higher prevalence of food and nutrition insecurity (Chege et al., Citation2021; Chege et al., Citation2022; Hirvonen et al., Citation2021; Kansiime et al., Citation2021). A few studies have documented the impacts of the pandemic on urban slum dwellers. For instance, according to UN-HABITAT (Citation2020), residents of slums and informal settlements faced heightened challenges in accessing healthcare services and products. From an economic perspective, urban-based enterprises and sectors have experienced drastic reductions and closures, especially small and medium enterprises (SMEs), which have a limited capacity to absorb shocks (UN-HABITAT, Citation2020). Additionally, widespread loss of employment and income sources has been reported in urban settlements, more so among slum dwellers who rely on low-wage casual work for their income and livelihoods (Béné et al., Citation2021; Chege et al., Citation2020).
Food remains central to human survival, even in times of crisis such as the COVID-19 pandemic. Given this importance, several studies document the impact of the COVID-19 pandemic on different aspects of consumer diets (Carreras et al., Citation2020; Chege et al., Citation2021; Chege et al., Citation2022; GAIN, Citation2020; Hirvonen et al., Citation2021; Innovations for Poverty Action (IPA), Citation2020; Tamru et al., Citation2020). Among urban slum dwellers during the pandemic, research has found less diversified diets, over-reliance on cereal-based meals, and lower consumption of nutritious foods such as fresh fruits, green leafy vegetables, and animal-sourced foods, compared to the situation before the pandemic. Hajipoor et al. (Citation2023), for instance, examined the changes between food groups, energy and macronutrients consumption before and after the COVID-19 pandemic among urban and rural population in Iran and found massive decreases among the urban populations. Mbijiwe et al. (Citation2021) also recorded similar results among Nairobi residents. These findings suggest a widespread deterioration in food and nutrition security among poor urban households.
The food that the slum dwellers have access to, can afford, and consume has a direct impact on their capacity to achieve their potential or to fall victim to various forms of malnutrition and disease. Nairobi, with a population of about 4.4 million inhabitants, is a case in point. Low-income residents face various food security challenges, including iron and vitamin A micronutrient deficiencies (KNBS, Citation2019; Wanyama et al., Citation2019). These challenges among poor urban residents are likely to have been exacerbated by the widespread impact of the COVID-19 pandemic, both at individual and household levels. Poor urban households, most of whom reside in slums, must make necessary social and economic adjustments to respond to these impacts and meet their food needs. However, the food security literature lacks analysis of response strategies employed by poor urban slum dwellers and of the effectiveness of such strategies in meeting dietary needs in the face of the ongoing pandemic. This study contributes to filling this gap through an in-depth panel analysis of the responses to the effects of the COVID-19 pandemic on the diets of urban slum dwellers in Nairobi. The study aimed to (1) assess dietary patterns among urban slum dwellers in Nairobi during the pandemic, (2) assess the response strategies employed by urban slum dwellers in Nairobi against the impacts of the pandemic on their diets, and (3), examine the effects of household coping strategies employed by urban slum dwellers in Nairobi.
Materials and methods
Household surveys and sampling
The study uses four-wave panel data that were collected in four rounds – Round 1 (R1) in April 2020, Round 2 (R2) in October 2020, Round 3 (R3) in April 2021, and Round 4 (R4) in April 2022. Data were collected from residences of the Kibera and Mathare slums of Nairobi. R1 data were collected during the first nationwide pandemic lockdown in Kenya. R2 data were collected just after the partial lifting of the first lockdown. R3 data were collected during the second lockdown in selected COVID-19 hotspot zones, while R4 data were collected after the government lifted major COVID-19-related restrictions countrywide. The use of panel data has several advantages. First, it significantly increases the sample size (Gujarati & Porter, Citation2003). Second, by examining repeated cross-sectional observations, panel data are better suited to studying the dynamics of change. Third, panel data enable us to develop more complex behavioral models. According to Ariga et al. (Citation2008), one major advantage of panel data analysis is that it overcomes problems of sample comparability over time while maintaining the ability to show trends and measure patterns. presents a summary of the total number of households interviewed across the four survey waves in Kibera and Mathare. A total of 1298 households were interviewed during R1. In the subsequent rounds, 907, 971, and 671 households were interviewed during R2, R3 and R4, respectively. A total of 437 households (266 households in Kibera and 171 households in Mathare) were interviewed consistently across all four survey waves, providing a balanced panel for the study. During R4, face-to-face key informant interviews (KIIs) were carried out with local administrators, including chiefs, village elders, and nyumba-kumi chairpersons. The KIIs provided qualitative data about the effects of the pandemic and the response options employed by residents in the study sites. A total of 30 informants were interviewed: 15 in Mathare and 15 in Kibera.
Table 1. Summary of survey response rate.
This study examined urban consumers residing in Nairobi slums. The study employed a multi-stage sampling approach to select households. In the first stage, two slums in Nairobi; Kibra and Mathare, were purposively selected due to their high levels of poverty and malnutrition (KNBS, Citation2015; Wanyama et al., Citation2019). In the second stage, simple random sampling was used to select six villages from each slum. In the third stage, systematic random sampling was applied, selecting every tenth household in all directions from the centre of the selected villages until the predetermined sample size was reached. To determine the sample size, the study employed the Cochran sampling procedure (Cochran, Citation1977), separately in Kibera and Mathare, resulting in a total of 384 households in each slum. An adjustment for attrition and non-response of 60% was applied to this number, assuming an average attrition rate of 15% in each survey wave, resulting in a sample size of 650 households in each location (Baird et al., Citation2008).
Telephone interviews were conducted using a structured questionnaire during periods of restricted movement in the study areas. Some face-to-face interviews were conducted when the situation allowed. The questionnaire consisted of several sections, including household demographic information, questions on food security, and household consumption behavior. Respondents were asked about their food consumption of diverse food groups, including staples, nuts and legumes, vegetables, fruits, meat and fish, milk, sugar, fats and oils, and condiments. They were also asked about the impact of COVID-19 on their food consumption and their response strategies to the dietary impact of the pandemic. The questionnaire was coded on tablet computers using SurveyCTO® software, a computer-assisted personal interview (CAPI) program for questionnaire design and data collection. Prior to each survey wave, the digitized survey was pretested with 20 respondents selected from non-sampled slums to assess face validity, reliability, usability and item comprehensibility.
Enumerators with at least one year of experience in conducting urban surveys and nutrition-related surveys were engaged in data collection across the survey rounds. They had at least a bachelor’s degree in social sciences, with knowledge and experience in food- and nutrition-related studies. Before each survey wave, enumerators received one week of intensive training on the survey protocol. The interactive training took a face-to-face setup with role-play practical sessions. The target respondent was the main decision-maker in the household for food purchases, preparation and consumption. Data quality assurance mechanisms – including skip logic, duplicate entry checks, high-frequency checks and audio audits – were incorporated into the digitized questionnaire design. These were complemented with daily backstopping and data quality reviews.
shows the attrition of panel households over the four waves of the survey. In R1, a total of 1298 households were interviewed. The attrition rate between R1 and R2 was 30.1%. However, there was a 7% increase in response rate between R2 and R3. Between R3 and R4 the attrition rate was 30.9%.
Table 2. Summary of between-wave attrition.
The reasons why participants did not take part in the surveys after R1 were recorded and are shown in . Telephone-related challenges – calls not answered despite numerous attempts to reach the respondent, phone switched off during the survey period, and wrong numbers recorded during R1 – accounted for 83.6% of non-response during R2. Another 5.4% were unable to complete the interview, while 4.9% refused to be interviewed. During R3, 75.7% of non-responses were due to phone-related challenges, including calls not answered despite numerous attempts, the telephone being switched off, and the telephone number being out of service. Enumerators mostly conducted face-to-face interviews in R4, although respondents were traced and contacted by telephone.
Table 3. Reasons for attrition, percentage of participants who did not take part in the survey after R1.
Attrition bias analysis
Attrition affects both the internal and external validity of the results in two main ways. First, it alters the covariance of variables, and second, it changes the characteristics of the sample (Barry, Citation2005). In panel surveys, attrition is a common occurrence and strategies must be put in place to detect and deal with it. In this study, we employ a two-pronged approach to detect and deal with attrition bias. First, t-tests were used to compare panel households with those who dropped out of the surveys. Second, a confirmatory logit analysis was conducted to predict survey participation from the data. A significant prediction of participation in a survey wave by any independent variable would confirm the existence of attrition bias. Results from the confirmatory logit analysis are presented in Appendix. Attrition bias was ruled out because no variable significantly predicted household participation in the surveys.
Food consumption score (FCS)
The World Food Program’s (WFP) Food Consumption Score (FCS) is a food frequency indicator that aims to capture both the quantity and quality of household food consumption (Marivoet et al., Citation2019). Dietary diversity, food frequency, and the relative nutritional importance of different food groups make up this composite score (WFP, Citation2008). FCS is considered a reasonably good proxy for the access dimension of food security, capturing variation in both calorie availability and diet quality in households (INDDEX Project, Citation2018; Marivoet et al., Citation2019). FCS can be used in various ways, including for program monitoring and evaluation, and population-level targeting. The FCS allows comparisons between households in different locations because it is a standardized measure. It can also track cyclical changes and patterns in the household diet when collected repeatedly across seasons or years (INDDEX Project, Citation2018).
In all four survey waves, food consumption data were collected using a 7-day food frequency module. The FCS was then calculated for each household across the four survey waves. We calculated the score using the WFP’s FCS technical guidance sheet (WFP, Citation2008). For each household, we calculated the FCS by multiplying the frequency of each food group by its weight () and then summing the food group scores into one composite score at the household level. A household can have a maximum score of 112, which implies that each of the food groups has been consumed every day for the last seven days (WFP, Citation2006). To understand the trends, we classified a household’s FCS into one of three Food Consumption Groups (FCG): poor, borderline, or acceptable consumption. The classification applies the WFP-recommended cut-offs for FSC scores of 28.5 and 42, given the results of the food group frequency analysis, which indicate homogeneous daily consumption of fats, oils, and sugars among slum dwellers in Nairobi (INDDEX Project, Citation2018; ). We then descriptively analyzed households’ movements from one FCG to another to understand households’ dietary transition patterns during the pandemic. Based on how households changed FCG across the survey rounds, a household was classified as ‘consistently poor,’ ‘Oscillators’ or ‘consistently acceptable’ if its FCG remained poor, borderline or acceptable across the four survey waves. The household was classified as an ‘oscillator’ if its FCG classification changed between the categories across the four survey waves.
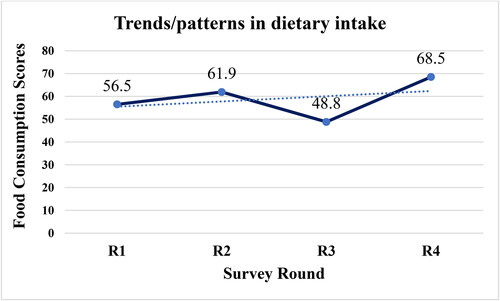
Figure 1. Trends in dietary intake during the COVID-19 pandemic.
Statistical analysis
The study objectives prescribed descriptive and econometric approaches to the analysis of the data. First, we use descriptive statistics to analyze household characteristics and to understand the consumption patterns and food intake transitions during the pandemic among panel households. Additionally, we use descriptive statistics to analyze self-reported household response strategies to the impact of the pandemic on slum dweller diets. Means, percentages, and t-tests are computed to describe the levels and trends in consumption of different FCGs and FCSs during the pandemic. Percentages are used to describe the response of slum dwellers to the impacts of the pandemic on their diets. We also use content analysis to analyze qualitative data from the KIIs, using the results largely to complement the quantitative survey results. Second, we use a fixed effects (FE) model to predict FCS. We used the Durbin–Wu–Hausman (DWH) test (Prob > chi2 = 0.0000) to select an FE model, after rejecting the null hypothesis (H0) that the most appropriate model for the panel data is a random effect (RE) model. FE models are used only when one is interested in analyzing the effects of variables that vary over time. In an FE model, the intercept in the regression model is allowed to vary across households because each household or unit may have some unique characteristics (Gujarati & Porter, Citation2003). The FE model is appropriate in situations where the individual, household-specific intercept may be correlated with one or more regressors (Gujarati & Porter, Citation2003). The model explores the relationship between predictors and outcome variables within an entity (country, household, person, company, etc.). In this study, each household has its own individual characteristics that may or may not influence the predictor variables. By using an FE model, the analysis assumes that something within the household may affect or bias the predictor or outcome variables and must be controlled for (Torres-Reyna, Citation2007). FE models remove the effect of time-invariant characteristics, thereby allowing the net effect of the predictors on household FCS to be assessed. The FE model also assumes that time-invariant characteristics are unique to the household and are not correlated with other household characteristics.
(1)
(1)
Where:
(i = 1….n) is the unknown intercept for each entity/household
Results
Characteristics of panel households
shows the demographic characteristics of panel households. The results show that on average, 39.8% of the households were female-headed, with little change in the head of household across the four survey rounds. Similarly, the household head’s number of years of schooling averaged 10 years across the survey rounds. About 59.1% of the household heads reported having a spouse, with the rest being single, separated, or widowed. In terms of the household size, there were on average 2.2 males and 2.4 females per household. However, there was a significant decline in household sizes during R3. This could be attributed to the reopening of schools and the relaxation of restrictions on movements, enabling household members to travel. The proportion of household heads with no employment was highest during R1 and R2 at 72.1 and 64.1%, respectively. However, this declined significantly to 10.5% during R3 and 8.2% during R4. The proportion of household heads with casual labor as their main occupation increased from 16% during R1 to 62.7% during R3 and R4. The proportion of household heads who were self-employed also increased significantly from 0.2% during R1 and R2 to 20.4% and 22.0% during R3 and R4, respectively. These results show that the number of household heads without employment declined over time, while the prominence of casual labor and self-employment increased over time. Monthly household income significantly increased between R3 and R4 from 4990 Kenyan shillings (KES) to 7891 KES. The overall average monthly household income during the pandemic was 7278 KES.
Table 4. Household demographic characteristics.
Dietary patterns of slum dwellers in Nairobi during the COVID-19 pandemic
Trends in dietary intake, indicated by FCS, are shown in . The mean FCS was lowest during R3, with a score of 48.8, followed by R1 with a score of 56.5. COVID-19 containment measures such as curfews and lockdowns were in full effect during these periods. After each of these survey rounds, there was a significant improvement in food consumption, with scores of 61.9 during R2 and 68.5 during R4. This shows that the diet of slum households improved after the first lockdown, but declined again during the second lockdown. The results also show that diets improved substantially after COVID-19 containment measures were relaxed in Kenya.
shows the proportions of households in each FCG over the four survey rounds. The percentage of households in the poor FCG declined from 14.4% during R1 to 4.6% during R4. The percentage of households in the borderline FCG increased from 5.7% in R1 to 31.4% recorded in R3. Households in the acceptable FCG declined from 79.9% in R1 to 57.7% in R3. The proportion of households in the acceptable FCG then increased to 85.6% during R4. Combining households in poor and borderline FCGs into one category of ‘unacceptable’ showed that about a quarter (24.3%) of the households had unacceptable food consumption, with the highest proportion (42.4%) recorded during R3.
Table 5. FCG by survey wave.
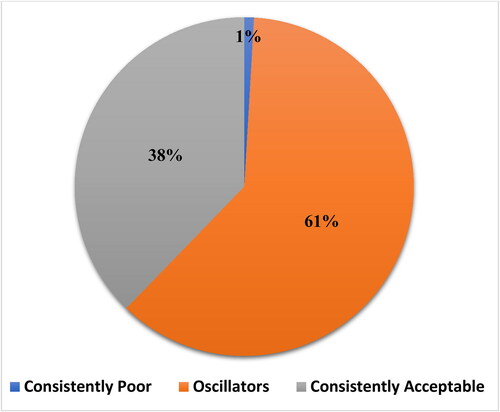
Household consumption trends across survey rounds are presented in . The results show that only 37.8% of the interviewed households had consistently acceptable dietary intakes over the four survey waves. Less than 1% of the households had consistently poor dietary intake. However, it is notable that around two-thirds (61.3%) fluctuated between acceptable and poor food consumption. This could be an indicator of the dietary vulnerability of the households, with direct implications for their food and nutrition security.
Figure 2. Household dietary transitions.
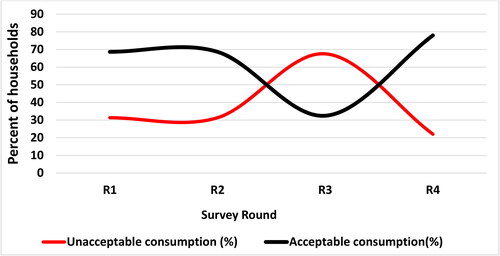
The consumption patterns of the 268 oscillator households are presented in . Even though a large proportion of the households (68.7%) had acceptable dietary intake during R1 and R2, a majority of the households (67.5%) fell into the unacceptable food intake category during the COVID-19 lockdown period in R3. During R4, when the COVID-19-related restrictions were lifted, the proportion of households in the acceptable FCG increased from 32 to 78%. This implies that the food consumption of oscillator households was vulnerable to the effects of the COVID-19 pandemic on the urban food systems. These trends raise the question of how households developed strategies to respond to the effects of the pandemic on their consumption.
Figure 3. Food consumption trends of oscillator households across survey waves.
Response strategies for curbing the effects of the COVID-19 pandemic on diets
presents a summary of how urban slum dwellers in Nairobi responded to the effects of the COVID-19 pandemic on their diets. Overall, they ate smaller meals (84.6%), consumed fewer preferred foods (83.7%), skipped meals during the day (77.1%), and ate less variety of foods (58.9%). Households relied on social networks to borrow money from relatives and friends to buy food (42%). Across the different survey waves, 93.6% of households consumed less variety of foods as a strategy during the R1 lockdown period. During the R3 lockdown period, 62.2% of households consumed less variety of foods. The higher use of these strategies during the lockdown periods contrasts with the lower proportions of households using them during R2 and R4, when 52.9% and 26.8% employed them, respectively. Discussions with key informants also support the finding that members of the slam community responded to the effects of the pandemic by eating less diverse food. The results also show that around one-third (33.9%) of households chose to reduce their family size by sending some family members to rural areas as a strategy to deal with the effects of the pandemic on their diets. Although uncommon among the interviewed households, reorganizing household finances by using savings to buy food was an important strategy employed by an average of 21.7% of the households across the study period. Relying on household food production was employed by less than 2% of the households. In 20% of households, children ate first and adults ate the remainder of the food afterwards.
Table 6. Summary of response strategies used by urban slum households during COVID-19 pandemic.
Response strategies and dietary intake of Nairobi slum dwellers
Regression results from the fixed-effects model are shown in . We analyzed the balanced panel to study the effects of the identified response strategies on dietary intake and quality (as measured by FCS). To manage both physical and economic access challenges associated with food during the pandemic, slum households relied on several self-initiated coping strategies, some of which were negatively associated with dietary intake. Results show that eating less preferred foods as a strategy to ease the effects of the pandemic on household diets was positively and significantly associated with improved dietary intake by urban slum dwellers. Foods such as cabbage and omena (silverfish), although less preferred, were generally less expensive during the pandemic. The lower cost of these foods freed up some money from limited food budgets, allowing households to either purchase other foods or maintain access to their normal consumption. Results from KIIs indicate that the less preferred foods, such as cabbages and omena, were the most available commodities in the local markets during the COVID-19 pandemic.
Table 7. Effects of response strategies on household food consumption scores.
Increased income was positively and significantly associated with improved dietary intake and quality during the pandemic. Self-employment as an occupation was also positively and significantly associated with improved dietary intake. Urban households largely depend on markets for food purchases. The positive association of income with improved dietary intake implies that any increase in income improves the food purchasing power of the households. Similar findings were reported by Wanyama et al. (Citation2019) who sought to understand the drivers of different indicators for food security in Nairobi and Kampala slums. Household income is also closely related to the occupation of the household head. Results show that relative to those without any income-generating occupation, households whose heads were self-employed had significantly higher odds of improved dietary intake. Similar findings are reported by Chege et al. (Citation2022) who analyzed the effects of COVID-19 on the dietary behavior of urban consumers in Nairobi. On the other hand, changing consumption behavior by skipping meals in a day, eating less variety of foods, and reducing urban household sizes by sending some household members to rural areas worsened dietary intake during the pandemic.
Kimani-Murage et al. (Citation2015) found that people in the slums eat just enough to survive. Some consider one meal per day to be sufficient and normal for adults, sometimes with an additional tea in the morning. With the effects of the pandemic, skipping meals became an easier option for slum households whose aim was not to eat for satisfaction, but to survive. Additionally, food access was a major challenge for slum dwellers during the pandemic because of government restrictions on movement. Loss of livelihoods and food inflation also reduced food purchasing power and access. KIIs revealed that slum dwellers sent some of their household members, mostly children, to rural homes as life and food access became unbearable during the pandemic. However, household consumption continued its negative trend despite fewer people in the household. This could mean that the remaining adults survived on fewer, less diversified meals owing to the effects of the pandemic.
Discussion, conclusions and policy implications
According to the FAO Report on the State of Food Security and Nutrition in the World (FAO, Citation2022), the lingering effects of the COVID-19 pandemic and its consequences continue to impede progress towards the achievement of the Sustainable Development Goal of eradicating hunger, food insecurity, and all forms of malnutrition by 2030. The uneven pattern of economic recovery among countries in 2021 and the unrecovered income losses among those most affected by the pandemic have exacerbated existing inequalities and have worsened the food security situation of populations already struggling the most to feed their families (FAO, Citation2022). The purpose of this study was to assess the responses to the effects of the COVID-19 pandemic on the diets of urban slum dwellers in Nairobi. Understanding how slum dwellers respond to the effects of shocks, such as the COVID-19 pandemic, on their diets is fundamental to achieving sustainable food and nutrition security in urban areas.
This study has demonstrated, through descriptive analysis, the vulnerability of urban slum dwellers’ diets to shocks such as the COVID-19 pandemic. The study shows that only 38% of slum dwellers had consistently acceptable diets during the pandemic with about two-thirds of the households oscillating between acceptable and unacceptable diets. The results further show how the proportion of households falling into the category of unacceptable food consumption increased during the periods of the pandemic when the government imposed disruptive measures to contain the COVID-19 virus, such as curfews and lockdowns. Previous studies have also reported the vulnerability to food insecurity among urban poor communities (Chege et al., Citation2022; Kimani-Murage et al., Citation2015; Wanyama et al., Citation2019).
The study finds that the majority of households resorted to changing their consumption patterns by eating smaller meals (84.6%), eating less preferred foods (83.7%), skipping meals during the day (77.1%), and eating less variety of foods (58.9%). Additionally, some households relied on social networks, accepting donations or borrowing money from relatives and friends to acquire food (42%). Further, in response to the effects of the pandemic, about one-third of households in the slums decided to reduce their household size by sending part of their family, mostly children, to rural areas as they struggled to put food on the table. To a lesser extent, the other response strategies used include reorganizing household finances by using savings to buy food, prioritizing children over adults in food access by letting them eat first, and relying on domestic food production.
The study further finds that even though the households employed several response strategies to reduce the impact of the pandemic on their diets, not all the strategies served their intended purpose. First, we find that changing consumption patterns by skipping meals during the day or eating less variety of foods were negatively associated with improved dietary intake and quality. Looking at COVID-19 implications on household income and food security in Kenya and Uganda, Kansiime et al. (Citation2021) also observed worsening food security and diet quality due to changes in dietary patterns such as skipping meals and eating less diversified foods. On the other hand, we find that changing consumption patterns by eating less preferred foods as a response strategy is positively associated with improved nutrition among slum dwellers. This implies that in the face of a shock such as the pandemic, one that negatively affects food access and availability, changing household food preferences may be a successful adaptation strategy. Reducing family size by sending some family members, mostly children, to the rural areas is negatively associated with improved dietary intake and quality. A possible explanation for this could be that adults can more easily tolerate skipped meals, reduced food variety, and declines in nutrition when children are absent from the household. The study finds that all the other response strategies, including reliance on social networks, reorganization of family finances, prioritization of children in the order of food access within the household, and reliance on domestic food production did not significantly affect dietary intake and quality among slum dwellers.
In addition to findings on coping strategies, this study finds that the occupation of the household head and household income is positively associated with improved food intake and quality. In terms of occupation, households whose heads are self-employed or are business owners have improved food intake and quality. As observed by Wanyama et al. (Citation2019), the urban poor have limited livelihood options and often rely on informal employment for their income. Informal employment is less stable, leaving households vulnerable to social and economic shocks. Self-employment provides an additional income stream, enhancing household food purchasing power. A rise in household income enables slum dwellers to purchase more food and eat more frequently, thereby improving their diets.
These findings may have policy relevance. The Kenyan government’s National Food and Nutrition Security Policy galvanizes efforts to build self-reliance to reduce chronic food insecurity. The government assists those in need when emergencies occur. But its commitment faced entirely new challenges during the pandemic. As the study shows, food vulnerability among urban slum dwellers worsened during the pandemic largely due to loss or reduction in household income, reduced access to markets due to travel restrictions, and low purchasing power. We recommend targeted strategies to stabilize livelihoods, incomes, and food access among vulnerable communities such as urban slum dwellers. A strong and effective social protection strategy is needed to protect the most vulnerable to future shocks, especially the urban poor and those in informal employment.
Authors contributions
Conceptualization and writing: Kevin O, Chege C, and Kariuki L. Methodology: Kevin O, and Chege C. Formal analysis and writing - original draft preparation: Kevin O and Kariuki L. Investigation: Kevin O, Kariuki L, Chege C and Lundy M. Review and editing: Kariuki L, Chege C, and Lundy M. Resources and funding acquisition: Lundy M, and Chege C.
Ethics statement
The studies involving human participants were reviewed and approved by CIAT Institutional Review Board (IRB). To participate in the study, the respondents provided their audio-informed consent in the case of a phone interview or written informed consent in the case of face-to-face interviews.
Acknowledgements
The authors of this manuscript thank the consumers who participated in this study and the research assistants who supported the data collection.
Disclosure statement
No potential conflict of interest was reported by the author(s).
Additional information
Funding
Notes on contributors
Kevin Onyango
Kevin Onyango is a seasoned researcher with over 10 years of experience in the fields of agricultural research and development; food systems development, market systems analysis, and food environment and consumer behavior. Kevin holds a Bachelor’s degree in Agriculture from the University of Nairobi, Kenya and an M.Sc. in Research methods from Jomo Kenyatta University of Agriculture and Technology (JKUAT) in Kenya.
Lilian W. Kariuki
Dr. Lilian W. Kariuki is an accomplished scientist and academician at Jomo Kenyatta University of Agriculture and Technology (JKUAT) in Kenya. She has made significant contributions in the field of horticulture, biotechnology and bioinformatics, particularly in the areas of molecular biology and genetics. Dr. Kariuki has been involved in various research projects aimed at addressing agricultural challenges and improving food security in Kenya and beyond. She holds a PhD in Horticultural Science from JKUAT, Kenya.
Christine G. K. Chege
Dr. Christine G. K. Chege is an Agri-Nutrition and Food System Scientist working within the Food Environment and Consumer Behavior (FECB) Research Area. She has over 10 years of progressive experience working on sustainable and healthy diets, nutrition, Agri-Nutrition interventions, market systems, value chains, consumer research, linking farmers to markets, behavioral experiments, and private sector engagement. She has implemented projects in several countries across sub-Saharan Africa (Kenya, Uganda, Tanzania, Ethiopia, Malawi, Rwanda, Zambia, Nigeria, Senegal) and Asia (Bangladesh, Vietnam, and Indonesia). Christine has a PhD in Agricultural Economics (with a focus on Agri-Nutrition and food security) from Göttingen University, Germany.
Mark Lundy
Mark Lundy is a Research Director and a senior scientist at the Alliance Bioversity International and CIAT, based in Cali, Colombia where he leads the global Food Environment and Consumer Behavior team. His work focuses on the role of market systems in reducing poverty including learning networks to increase capacities for enterprise development, the role of public agencies to promote inclusive markets and how to establish and sustain effective trading relationships between retailers, traders and farmers. Emerging areas of work include the food environment of traditional markets and low-income consumers, climate resilience and environmental sustainability of food systems, the political economy of food systems and multi-actor platforms to improve decision-making. Mark holds a PhD in Agricultural and Resource Economics from the University of California, Davis.
References
- Ariga, J., Jayne, T., Betty, K., & Nyoro, J. (2008). Trends and patterns in fertilizer use by smallholder farmers in Kenya, 1997-2007. Paper presented at Egerton Tegemoe Institute Agricultural Policy Conference.
- Baird, S., Hamory, J., & Miguel, E. (2008). Tracking, attrition and data quality in the Kenyan life panel survey round 1 (KLPS-1). Working paper, Center for International Development Economic Research,. University of Calif ornia, Berkeley.
- Barry, A. E. (2005). How attrition impacts the internal and external validity of longitudinal research. The Journal of School Health, 75(7), 267–270. https://doi.org/10.1111/j.1746-1561.2005.00035.x
- Béné, C., Bakker, D., Chavarro, M. J., Even, B., Melo, J., & Sonneveld, A. (2021). Impacts of COVID-19 on People’s Food Security: Foundations for a more Resilient Food System. CGIAR COVID-19 Hub Discussion Paper.
- Carreras, M., Saha, A., & Thompson, J. (2020). Rapid assessment of the impact of COVID-19 on food systems and rural livelihoods in sub-Saharan Africa. APRA COVID-19 Synthesis Report 1. Future Agriculture Consortium.
- Chege, C. G. K., Onyango, K., Kabach, J., & Lundy, M. (2020). Impact of COVID-19 on diets of poor consumers in Africa: Evidence from the slums of Nairobi. CIAT.
- Chege, C. G. K., Onyango, K., Kabach, J., & Lundy, M. (2022). Effects of COVID-19 on dietary behavior of urban consumers in Nairobi, Kenya. Frontiers in Sustainable Food Systems, 6, 718443. https://doi.org/10.3389/fsufs.2022.718443
- Chege, C. G., Mbugua, M., Onyango, K., & Lundy, M. (2021). Keeping food on the table: Urban food environments in Nairobi under COVID-19. CIAT.
- Cochran, W. G. (1977). Sampling techniques (3rd ed.). John Wiley & Sons.
- Demeke, M., Kariuki, J., & Wanjiru, M. (2020). Assessing the impact of COVID-19 on food and nutrition security and adequacy of responses in Kenya. FAO Policy Briefing May.
- FAO. (2019). The State of Food Security and Nutrition in the World 2019. Safeguarding against economic slowdowns and downturns. FAO.
- FAO. (2021). The State of Food Security and Nutrition in the World 2021: Transforming food systems for food security, improved nutrition and affordable healthy diets for all. FAO.
- FAO. (2022). The State of Food Security and Nutrition in the World 2022. Repurposing food and agricultural policies to make healthy diets more affordable. FAO.
- GAIN. (2020). Impact of COVID-19 on food systems: A situation report. Retrieved October 10, 2022, from https://www.gainhealth.org/sites/default/files/publications/documents/impact-of-covid-19-on-food-systems-a-situation-report-edition-3.pdf
- Gujarati, D. N., & Porter, D. C. (2003). Basic econometrics. McGrew Hill Book Co.
- Hajipoor, M., Rahbarinejad, P., Irankhah, K., & Sobhani, S. R. (2023). Comparing food consumption during the COVID-19 pandemic: analysis of household income and expenditure survey data in Iran. Journal of Health, Population and Nutrition, 42(1), 1–13. https://doi.org/10.1186/s41043-023-00385-3
- High-Level Panel of Experts (HLPE). (2020). Impacts of COVID-19 on food security and nutrition: Developing effective policy responses to address the hunger and malnutrition pandemic. FAO.
- Hirvonen, K., De Brauw, A., & Abate, G. T. (2021). Food consumption and food security during the COVID‐19 pandemic in Addis Ababa. American Journal of Agricultural Economics, 103(3), 772–789. https://doi.org/10.1111/ajae.12206
- INDDEX Project. (2018). Data4Diets: Building blocks for diet-related food security analysis. Tufts University. Retrieved September 9, 2021, from https://inddex.nutrition.tufts.edu/data4diets
- Innovations for Poverty Action (IPA). (2020). The effects of a Universal basic income during the COVID-19 pandemic in Kenya: Study Summary. IPA.
- Kansiime, M. K., Tambo, J. A., Mugambi, I., Bundi, M., Kara, A., & Owuor, C. (2021). COVID-19 implications on household income and food security in Kenya and Uganda: Findings from a rapid assessment. World Development, 137, 105199. https://doi.org/10.1016/j.worlddev.2020.105199
- Kimani-Murage, E. W., Muthuri, K. S., Oti, O. S., Mutua, K. M., van de Vijver, S., & Kyobutungi, C. (2015). Evidence of a double burden of malnutrition in urban poor settings in Nairobi, Kenya. PLOS One, 10(6), e0129943. https://doi.org/10.1371/journal.pone.0129943
- KNBS. (2015). Spatial Dimensions of Well-Being in Kenya: Where are the Poor? From Counties to Wards. Based on 2009 Census. Kenya National Bureau of Statistics, Nairobi.
- KNBS. (2019). 2019 Kenya population and housing census. Retrieved October 2, 2022, from https://www.knbs.or.ke/?wpdmpro=2019-kenya-population-and-housing-census-volume-i-population-by-county-and-sub-county
- Marivoet, W., Becquey, E., & Van Campenhout, B. (2019). How well does the Food Consumption Score capture diet quantity, quality and adequacy across regions in the Democratic Republic of the Congo (DRC)? Food Security, 11(5), 1029–1049. https://doi.org/10.1007/s12571-019-00958-3
- Mbijiwe, J., Kiiru, S., Konyole, S., Ndungu, N., & Kinyuru, J. (2021). Impact of covid-19 pandemic on food consumption pattern in the population of Nairobi, Kenya. Journal of Agriculture, Science and Technology, 20(3), 16–26.
- MoH. (2020). The first case of coronavirus disease confirmed in Kenya. Ministry of Health. https://bit.ly/3isa56c.
- Mueller, J. T., McConnell, K., Burow, P. B., Pofahl, K., Merdjanoff, A. A., & Farrell, J. (2021). Impacts of the COVID-19 pandemic on rural America. Proceedings of the National Academy of Sciences, 118(1), 2019378118. https://doi.org/10.1073/pnas.2019378118
- OECD. (2020). Policy implications of coronavirus crisis for rural development. OECD Publishing.
- Olwande, J., Ayieko, M., Mukundi, J., & Odhiambo, N. (2021). Impact of COVID-19 on Food Systems and Rural Livelihoods in Kenya. APRA Working Paper–Kenya–June.
- Shafi, M., Liu, J., Jian, D., Rahman, I. U., & Chen, X. (2021). Impact of the COVID-19 pandemic on rural communities: a cross-sectional study in the Sichuan Province of China. BMJ Open, 11(8), e046745. https://doi.org/10.1136/bmjopen-2020-046745
- Sitko, N., Knowles, M., Viberti, F., & Bordi, D. (2022). Assessing the impacts of the COVID-19 pandemic on the livelihoods of rural people: A review of the evidence. FAO.
- Tamru, S., Hirvonen, K., & Minten, B. (2020). 18. Impacts of the COVID-19 crisis on vegetable value chains in Ethiopia, IFPRI.
- Torres-Reyna, O. (2007). Panel data analysis fixed and random effects using Stata (v. 4.2): Data & statistical services (pp. 112–152) Princeton University.
- Trinh, H. T., Linderhof, V., Vuong, V. T., Esaryk, E. E., Heller, M., Dijkxhoorn, Y., Nguyen, T. M., Huynh, T. T. T., Hernandez, R., Duong, T. T., Luu, V. T., Jones, A. D., Talsma, E. F., Truong, M. T., Achterbosch, T., & de Haan, S. (2021). Diets, food choices and environmental impacts across an urban-rural interface in Northern Vietnam. Agriculture, 11(2), 137. https://doi.org/10.3390/agriculture11020137
- UN-HABITAT. (2020). COVID-19 in African cities: Impacts, responses and policies recommendations. Retrieved October 10, 2022, from https://unhabitat.org/sites/default/files/2020/06/covid-19_in_african_cities_impacts_responses_and_policies2.pdf
- Wanyama, R., Gödecke, T., & Qaim, M. (2019). Food security and dietary quality in African slums. Sustainability, 11(21), 5999. https://doi.org/10.3390/su11215999
- WFP. (2006). Food consumption analysis: calculation and use of the food consumption score in food security analysis. WFP.
- WFP. (2008). Food consumption analysis: calculation and use of the food consumption score in food security analysis. WFP.
- WHO. (2020). WHO Director-General’s opening remarks at the media briefing on COVID-19. Accessed September 29, 2022, from, https://www.who.int/director-general/speeches/detail/who-director-general-s-opening-remarks-at-the-media-briefing-on-covid-19-11-march-2020
Appendix A
Figure A1. FCGs and weights. Source: WFP (Citation2006).
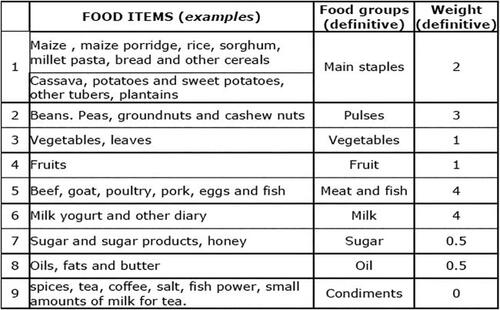
Table A1. Confirmatory attrition bias analysis using logistic regression.
Table A2. Proportions of households consuming different food categories over the survey waves.
Table A3. Frequency of consumption of different food categories in 7 d over the survey waves.