
 ?Mathematical formulae have been encoded as MathML and are displayed in this HTML version using MathJax in order to improve their display. Uncheck the box to turn MathJax off. This feature requires Javascript. Click on a formula to zoom.
ABSRACT
The objective of this study is to explore the influence of various factors on transportation development, considering their spillover effects on Gross Domestic Product (GDP) growth in neighboring provinces. The study utilizes time-series data from the transportation industry in Ho Chi Minh, Vietnam. Accordingly, a theoretical framework is constructed based on foundational theories. The methodology involves Structural Equation Modeling (SEM) analysis and its five steps of Goodness of Fit testing. The key findings include: (1) Mobile phones positively influence, while corruption control and state investment negatively impact goods labor productivity; (2) Provincial Competitiveness Index (PCI) and state investment positively influence both people labor productivity and people capital productivity; (3) Regarding spillover effects on neighboring provinces, mobile phones have a negative influence, while PCI positively impacts the GDP growth of Binh Phuoc. Mobile phones negatively affect GDP growth in Vung Tau and Dong Nai, whereas corruption control positively affects it in these provinces. Therefore, with regard to institutions, the government should regulate transportation industry activities towards environmental friendliness, such as developing PCI in the direction of a green environment or investing in green fuel for the transportation industry. As corruption control has both positive and negative effects, we recommend increasing corruption control towards a sustainable economy. Regarding technology, since mobile phones have both positive and negative effects, we suggest finding a balance to boost goods labor productivity. These results offer transportation policymakers and managers both theoretical and practical perspectives to improve the transportation industry’s development.
IMPACT STATEMENT
Our study is an empirical investigation into the factors influencing the development of transportation and the spillover effects on neighboring provinces, with a focus on the case of Ho Chi Minh, Vietnam. Ho Chi Minh stands as the largest city and economic hub of Vietnam, playing a crucial role in the southern key economic region. The transportation industry’s average contribution to Gross Regional Domestic Product (GRDP) in Ho Chi Minh was approximately 16% during the period from 2010 to 2020. However, a significant challenge emerges. From 2010 to 2020, just over 40% of enterprises in the transportation industry were profitable, with around 50% experiencing sales losses. Moreover, about 8% of enterprises encountered operational interruptions, temporary closures, or faced issues leading to dissolution or bankruptcy.
1. Introduction
The study on the basis of assessing the development status of transportation enterprises in HCM. Analyzing the causes, thereby proposing solutions to promote transportation enterprises to develop in the coming time in a sustainable way according to the world trend. These solutions are built on the basis of a theoretical overview from past studies with solid science and methodology, associating with analysis of the actual operation status of transportation enterprises and quantitative research results on factors affecting the development of transportation enterprises in HCM. Therefore, the results of the study and policy implications are feasible to be applied to transportation industry. The unique contribution with this paper is from evidence of the influence of the factors (transportation physical factor; political factor; and technological factor) on the development of transportation enterprises in HCM, aiming to contribute to the sustainable development of transportation industry.
Transportation exists for the purpose of shortening spatial distances, although these distances can be expressed not only in terms of distance but also in terms of time and cost. It is the means by which people and goods can be moved from where they are now to another place where they will have an advantage. The level of the transportation system, from the pack trails to the systems of road-railway-airway today can vary immensely (White & Senior, Citation1983, p. 207). Socially, as early as the 1960s, Clarke (Citation1963) and Frederick (1969) discovered that the desire to travel of the human race seems insatiable and has given rise to all speculation about how we might travel in the future. By the 1970s, Kranzberg (Citation1970) found that more and more people were aware of the role of transportation in shaping the way people live. In economic terms, Hicks (Citation1977, p. 100) noted that ‘Any urban area depends on its survival on the massive flow of goods in, out, and within its boundaries’.
The development of the transportation has been one of the key factors determining the success of Vietnam’s economic development in the past two decades of the renew era. The development of transportation has significantly contributed to poverty reduction, improved access for households and mobility of most people and businesses (Khuat Viet Hung, Citation2010). HCM is the largest city in Vietnam, the commercial center, and the economic engine of Vietnam. HCM’s GDP accounts for 23–25% of the country’s GDP. The average GDP of transportation in the period 2010–2020 is about 16% of the GDP of HCM. However, a serious problem is that in the period of 2010–2020, the total number of profitable enterprises in the transportation industry accounted for just over 40% while the number of sales losing businesses accounted for about 50%, and about 8% was the number of enterprises that temporarily stopped working, stopped working with an indefinite term, and/or had dissolution or bankruptcy problems (HCM statistical office, Citation2020).
Using previous studies’ results, factors have been identified that have an influence on transportation development which are in the form of a theoretical framework. From there, we developed and built each factor into variables that can be observed and measured quantitatively, which we think is a study gap. This content is presented in detail in Section ‘2.5. Literature gap’.
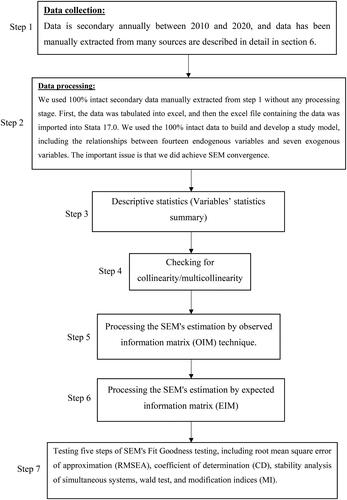
The study uses annual time series data for the period 2010–2020, manually extracted from eleven sources. We used the 100% intact data to build and develop a study model. Details are presented in section ‘4.5. Data collection and methodology’. We think that the data size of eleven years is quite small. We explained the reason why the data is only eleven years in the section ‘Limitations’. However, in order to have eleven year-data which is our great effort, and the important issue is that we did achieve SEM convergence.
The outstanding results are that the transportation physical factor did not affect transportation development, but did affect GDP growth of one neighboring province. Most of the variables in the political factor and institutional factor have a direct impact on transportation development and have a direct spillover effect on GDP growth of neighboring provinces. And there is no indirect influence from the above factors on GDP growth of transportation in HCM, GDP growth of HCM, and GDP growth of Vietnam.
The contributions of the paper are for both theory and practicality: Theoretically, study results support institutional theory because most of the variables of the institutional factor have a direct influence on the variables of transportation development and GDP growth of neighboring provinces. Similarly, research findings support the evolutionary theory and the theory related to spillover effects, because the results show that there is a direct spillover effect of most variables of the transportation physical factor, the political factor, and the institutional factor on GDP growth of neighboring provinces. In practical terms, the study results are evidence that government, planners, and transportation managers have a practical perspective to improve the development of the transportation industry. For example, they should accept the trade-off, that an increase in state investment will increase people labor productivity and people capital productivity and will decrease goods labor productivity. This content is detailed in section ‘9. Conclusion and Implications’.
From the fact, a serious problem is that in the period of 2010–2020, the total number of profitable enterprises in the transportation industry in HCM accounted for just over 40%. This may arise from the problem of internal weakness from each transportation enterprise in the industry, the root cause maybe due to exogenous factors such as institutions, transportation facilities, technology. Therefore, the objectives of this paper are to measure the direct influence of the transportation physical factor, the political factor, and the technological factor on transportation development in HCM, the direct spillover effect on GDP growth in neighboring provinces, and to measure whether or not those factors indirectly affect GDP growth of transportation development in HCM, GDP growth of HCM, and GDP growth of Vietnam. The first novelty of the study is most of the previous studies have systematically approached theoretical research method and qualitative method. Almost previous studies have clearly identified the factors affecting the development of transportation in the form of a theoretical synthesis. These factors have been studied in terms of concepts and theoretical frameworks using qualitative research method. Accordingly, we believe that this is the limitation, which means that the factors have not been transformed from concepts and theoretical frameworks into observable and measurable variables. So we believe that this is the first novelty of the study. The second novelty of the study is the article not only measures the direct influence of three factors on the development of transportation, but also have a direct spillover effect on GDP growth of neighboring provinces. Besides, the study also shows cause-and-effect relationships. Specifically, transportation development is affected by the above factors and at the same time it affects GDP growth of transportation in HCM, GDP growth of HCM, and GDP growth of Vietnam.
Structure of the research paper: Introduction (section 1); literature review (Section 2); methodology (Section 3); the innovation in proposed study model (section 4); social benefits of the research (section 5); data source (section 6); study results (section 7); discussion (section 8); and conclusion (section 9, including implications).
2. Literature review
2.1. Theories and previous studies review
.
Table 1. Theories and previous studies review.
2.2. Literature gap
Most of the previous studies approach systematically according to theoretical research method and qualitative method. Specifically, the factors affecting transportation development have been studied in terms of concepts and theoretical frameworks by qualitative research method with systematic approach. Accordingly, we believe that this is a limitation, which means that the factors have not been transformed from concepts and theoretical frameworks into observable and measurable variables. (The researcher has to turn theoretical concepts into observable and measurable variables, if the theoretical concept is multidimensional, all its dimensions must find the corresponding elements in the activity definition (Sekaran, Citation1992)). We believe that this is the limitation for previous studies. And this is the gap that we can continue to develop for this study.
In this study, transportation physical factor is transformed into road length variable and IW length variable, institutional factor is transformed into corruption control variable, state investment variable, and PCI variable, technological factor is transformed into abroad internet variable and mobile phone variable. All these variables can be measured quantitatively. We consider the need to develop theoretical definitions of factors affecting transportation development into specific quantifiable observed variables in order to measure by model and so test hypotheses is the literature gap.
2.3. The novelty of study
The first new point of the study is that the study proves that the transportation physical factor, the institutional factor, and the technological factor not only directly affect the development of transportation, but also have a direct spillover effect on GDP growth of neighboring provinces. Besides, the study also shows cause-and-effect relationships. Specifically, transportation development is affected by the above factors and at the same time it affects GDP growth of transportation in HCM, GDP growth of HCM, and GDP growth of Vietnam. Accordingly, GDP growth of transportation in HCM is affected by transportation development and affects GDP growth of HCM, and GDP growth of Vietnam. At the same time, the study also wants to test whether there is an indirect influence from the above factors on GDP growth of transportation in HCM, GDP growth of HCM, and GDP growth of Vietnam.
The second new point of the study is that the factors affecting transportation development have been transformed into variables which can be measured by a quantitative model. We consider this to be an advancement of this study, which the previous studies that are most closely related to this research topic have only been carried out at the level of providing a theoretical framework. Specifically, White and Senior (Citation1983) argued that technological development, Gordon (Citation1995), Button and Nijkamp (Citation1997), and Zeleny et al. (2018, 2010) determined the technological factor in general, and Macioszek and Jurdana (Citation2022) clearly identified E-commerce impact transporation development. Accordingly, we developed and used variables which can be observable and measurable. These included mobile phone variable and abroad internet variable representing E-commerce. Similarly, Button and Nijkamp (Citation1997) clearly presented the physical factor affects transportation development in theoretical form, and White and Senior (Citation1983, p. 32) suggested that the physical factor can be divided into topographic control of routes. Accordingly, we develop and construct the road length variable and the inland waterway length variable that can be measured quantitatively representing the physical factor. Finally, there is the political factor, the past studies have different theoretical approaches; For example, the political dimension includes incentives that have a decisive influence on transportation development and transportation structure (Zeleny et al., 2008, 2010). In most countries, the government has significant decision-making power over policy in allocating transportation infrastructure investment across regions. The reallocation of transportation infrastructure investment from one region to another cannot be considered random, it follows both economic and political motives (Castells & Solé-Ollé, Citation2005). Politics is the driving force behind the provision of transportation (White & Senior, Citation1983, pp. 56–57). Thus, we can understand that politics are expressed in the form of policy, law, and administrative procedures which can call institutions. From there, we develop and construct three variables representing the institutional factor that can be measured which are state investment variable, corruption control variable, and provincial competitiveness index variable.
2.4. Study hypotheses
2.4.1. The relationship between factors (transportation physical, institutions, and technology) and transportation development
White and Senior (Citation1983) asserted that the factors affecting the development of transportation included technology, physical, and politic. According to Gordon (Citation1995), basically, political and technological factors affect transportation development. Therefore, the development of a transportation system depends on both the development and adoption of new technologies, and politics are expressed through the making of policies. Button and Nijkamp (Citation1997) has presented the main links between social change and transportation development. Accordingly, the main factors included technology and transportation facilities. Coyle et al. (Citation2000, pp. 53–54) argued that political factor influences the development of transportation. Zurynek et al. (Citation2008, Citation2010) confirmed that the political factor (incentive policies have a decisive influence on the development of transportation and transportation structure, and the degree of openness of the country), technical factor (advancements in the field of engineering focusing on increasing vehicle performance and efficiency, reducing adverse impacts, and standardization and safety), technological factor (the available and potential level for technology development, and the level of contribution to scientific research). Macioszek and Jurdana (Citation2022) confirmed that E-commerce influences the development of transport in Poland.
2.4.2. Study hypothesises
H1: The transportation physical factor has a significant direct effect on transportation development.
H2: The institutional factor has a significant direct effect on transportation development.
H3: The technological factor has a significant direct effect on transportation development.
H4: The transportation physical factor has a significant direct spillover effect on GDP growth of the provinces in the key economic region of southern Vietnam (neighboring provinces).
H5: The institutional factor has a significant direct spillover effect on GDP growth of neighboring provinces.
H6: The technological factor has a significant direct spillover effect on GDP growth of neighboring provinces.
H7: The transportation physical factor has a significant indirect effect on GDP growth of transportation in HCM, GDP growth of HCM, and GDP growth of Vietnam.
H8: The institutional factor has a significant indirect effect on GDP growth of transportation in HCM, GDP growth of HCM, and GDP growth of Vietnam.
H9: The technological factor has a significant indirect effect on GDP growth of transportation in HCM, GDP growth of HCM, and GDP growth of Vietnam.
3. Methodology
3.1. Proposed study model
.
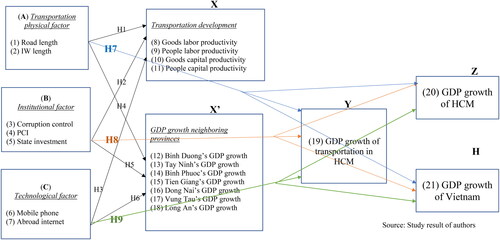
Figure 1. Model of conceptual factors affecting the development of transportation and spillover effects on neighboring provinces.
Source: Study result of authors.
3.2 Formula of conceptual model
From (1–4), and (5), we have:
(A, B, C, X, X’, Y, Z, H, e.X, e.X’, e.Y, e.Z, e.H) ∼ i.i.d. with mean vector μ and covariance matrix Σ where i.i.d. means that observations are independent and identically distributed.
We must appreciate that μ and Σ are estimated, just as ai, bi, ci, xi, yi. Some of the elements of Σ, however, are constrained to be 0; which elements are constrained is determined by how we specify the model (Stata Corp., Citation2021).
3.3. Explanation of variables in model of conceptual factors affect the development of transportation and spillover effects on neighboring provinces
The conceptual model is SEM includes seven exogenous variables and fourteen endogenous variables, they are described in the following .
Table 2. Variables explanation in conceptual model.
3.4. Data collection and data processing procedure
.
Figure 2. Data collection and data processing procedure.
4. The innovation in proposed study model
Firstly: the novelty of the proposed study model is that in addition to measuring the direct influence of factors (transportation physical, institutions, and e-commerce) on the development of transportation and measuring the direct spillover effects on GDP growth of neighboring provinces, the proposed study model is also built to measure the indirect effects of the above factors on GDP growth of transportation in HCM, GDP growth of HCM, and GDP growth of Vietnam. And moreover, the proposed study model measures the cause-and-effect relationships between development of transportation and GDP growth of transportation in HCM, GDP growth of HCM, and GDP growth of Vietnam; between GDP growth of transportation in HCM and GDP growth of HCM and GDP growth of Vietnam.
Secondly: The model fits the objectives of the study which are to answer these questions: (1) the three factors (transportation physical, institutions, and technology) have a direct influence on the development of transportation. The three factors above include seven observed variables acting as independent variables, transportation development includes four observed variables acting as dependent variables; (2) the direct spillover effects of the three factors above on GDP growth of neighboring provinces (GDP growth of neighboring provinces are the dependent variables); and (3) there is an indirect influence of the above three factors on GDP growth of HCM and GDP growth of Vietnam (in this case, the four variables of transportation development which are the dependent variables in the relationship (1) become independent variables of this relationship, GDP growth of HCM and GDP growth of Vietnam act as dependent variables). In order to test and measure the above objectives, we think SEM is the most appropriate. Because SEM is one of the extensions of the regression model. In SEM, the dependent variable no longer plays the only role but can become the independent variable for other dependent variables (Marsh et al., Citation1988; Rocha & Chelladurai, Citation2012).
Thirdly: the difference of the proposed study model from other models is that we used SEM to measure the direct influence of factors (transportation physical, institutions, and technology) on transportation development, and the direct spillover effect on GDP growth of neighboring provinces. Each factor includes observed variables, namely transportation physical includes road length and IW length, institutions include corruption control, state investment, and PCI, and technology includes mobile phone and abroad internet. We measure the indirect influence of the above factors on GDP growth of transportation in HCM, GDP growth of HCM, and GDP growth of Vietnam. In addition, another point of difference from other models is that our proposed SEM measures the cause-and-effect relationships between transportation development and GDP growth of transportation in HCM, GDP growth of HCM, and GDP growth of Vietnam. And finally, the proposed model helps us to test whether there is a direct effect of GDP growth of transportation in HCM on GDP growth of HCM and GDP growth of Vietnam.
5. Social benefits of the research
Transport enterprises play a very important role in the economic development of countries. They not only help economic growth, but also cause negative impacts on the environment. The nature, focus, and extent of this concern has continually changed as transportation evolves, but there is now a new urgency as scientific understandings of the environment and concerns about the impact of transportation on the environment has increased (Hensher & Button, Citation2003). There are many solutions to help transportation enterprises make the transformation of development model towards social, economic, and environmental considerations. In addition to the specific factors of the enterprises (internal), it is necessary to mention the impacts from factors that arise from outside the enterprise.
This study is based on assessing the development status of transportation enterprises in HCM. Analyzing the causes, thereby proposing solutions to promote transportation businesses to develop in the coming time in a sustainable direction that the world trend is aiming for. Therefore, the results of this study and policy implications are feasible to be applied to the transportation industry and have practical implications for society.
6. Data source
The data is annual secondary time series data between 2010 and 2020, collected and extracted manually by authors, is from many sources, including Statistical yearbooks of HCM for variables (8–11, 19, 20); of Vietnam for variable (21); of Binh Duong province for variable (12); of Tay Ninh province for variable (13); of Binh Phuoc province for variable (14); of Tien Giang province for variable (15); of Dong Nai province for variable (16); of Vung Tau province for variable (17); of Long An province for variable (18); from Thomson Reuters for variables (1, 2, 6), and (7); from Provincial competitiveness index of Vietnam chamber of commerce and industry and united states agency for international development in Vietnam for variables (3–5).
7. Study results
7.1. Summary of statistics of variables employed
is a statistics summary of the variables employed, including variable name, variable description, number of observed variables, mean, standard deviation, min, and max.
Table 3. Variables’ statistics summary.
The variable name is shown in the 1st column on the left.
The variable description is described in the 2nd column from the left.
There are five types of unit of observed variables. These are km, subscribers, score, money, and number. These are described in the 3rd column from the left.
Number of observed variables: There is a total of eleven observed variables. This is shown in the 4th column from the left.
Mean: Column 5th from the left is mean, the mean is between .039331 and 11,400,000, in which GDP growth of transportation in HCM has mean of .039331 and the total number of mobile network subscriptions has mean of 11,400,000.
Standard deviation: Standard deviation is shown in the 6th column from the left. The values of standard deviation are fluctuated from .0139496 to 1,316,648, in which .0139496 is the standard deviation of people capital productivity and 1,316,648 is total number of mobile network subscriptions.
Min: Min values are shown in the 2nd column from the right. The values of min are fluctuated between -.9990176 to 9,131,584, GDP growth of transportation in HCM has min is -.9990176 and 9,131,584 is total number of mobile network subscriptions.
Max: Max values are shown in the 1st column on the right. The values of max are from .1024402 to 13,900,000, in which .1024402 is max of people capital productivity and 13,900,000 is max of the total number of mobile network subscriptions.
7.2. Result of EFA analysis
shows the result of the KMO test of seven observed exogenous variables, including road length, IW length, abroad internet, mobile phone, corruption control, PCI, and state investment. The results show KMO = 0.745, P-value = 0.001.
Table 4. Kaiser-Meyer-Olkin (KMO) analysis results.
According to Hair et al. (Citation1995); Tabachnick and Fidell (Citation2001), KMO > = 0.50 is considered appropriate. But Netemeyer et al. (Citation2003) consider that KMO above 0.60–0.70 is appropriate. Thus, the seven observed variables in were selected to conduct SEM estimation in the next step.
Appendix A shows the results of factor analysis and correlation. The method is principal- component factors. The eigenvalues are greater than 1 at factor 2, all factors have stopped at 100% of the explained variance. The total variance of the two factors, which have eigenvalues greater than 1 is 0.8804, showing that these two factors explain 88.04% of the data variation of the seven observed variables in the factor analysis.
According to K1 – Kaiser’s method (Kaiser, Citation1960), only structures with eigenvalues are greater than one (1) are kept for interpretation (Fabrigar et al., Citation1999; Gorsuch, Citation1983). And, according to Hair, Anderson, et al. (1995) and Pett et al. (Citation2003), factors should be stopped when at least 95% of the variance is explained. Thus, the results are consistent with the theory mentioned.
Appendix B describes the results of factor loading and unique variance: showing that the factor loading coefficients of the seven observed variables are large. The magnitudes of factor loading are from 0.7181 to 0.9807. This shows that the correlation relationship between the observed variables and the factor is appropriate.
According to Hair et al. (Citation1998); Hair et al. (Citation2009); Anderson and Gerbing (1998), 0.3 < = factor loading < = 0.4 is considered minimal. Factor loading > = 0.5 it is considered to be of practical significance. Thus, the factor loading result is consistent with the theory mentioned.
7.3. Collinearity/multicollinearity
shows the results of three multivariate regression. The result of the 1st multivariate regression is R-Squared = 0.9716 and Adjusted R-Squared = 0.9053. And three independent variables have VIF > 10, including VIF of road length = 41.24, VIF of abroad internet = 32.70, and VIF of mobile phone = 10.55. Thus, road length was removed.
Table 5. Collinearity or Multicollinearity.
The results of the 2nd multivariate regression after removed the road length show R-Squared = 0.9056, Adjusted R-Squared = 0.7641. There is one independent variable that has VIF > 10. It is abroad internet with VIF = 22.79. Consequently, abroad internet was removed.
The results of the 3rd multivariate regression after removal of abroad internet show R-squared = 0.8191, and Adjusted R-squared = 0.6382, with VIFs of IW length = 3.53, mobile phone = 7.12, corruption control = 2.17, PCI = 4.41, and state investment = 4.13.
It is stated by Joseph et al. (Citation2010) that ‘A common cutoff threshold is a tolerance value of .10, which corresponds to a VIF value of 10’. Thus, these five independent variables are chosen for going to have SEM estimation.
7.4. SEM estimation results
7.4.1. SEM estimation depiction
.
Figure 3. Depiction of the Structural Equation Modeling (SEM) estimation illustrating factors influencing the development of transportation and spillover effects on neighboring provinces. comprises five detailed SEM estimates, denoted as figures 3.1, 3.2, 3.3, 3.4, and 3.5.
Source: Study result of authors.
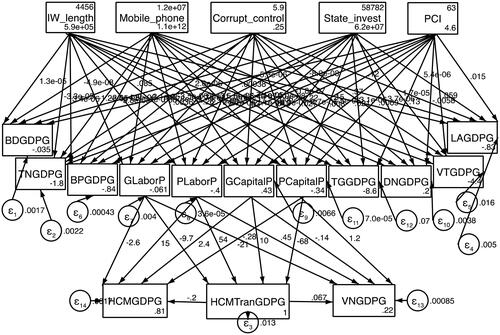
Figure 3.1. Depiction of the Structural Equation Modeling (SEM) estimation of the IW_length (inland waterway length) factor, illustrating its influence on the development of transportation and spillover effects on neighboring provinces.
Source: Study result of authors.
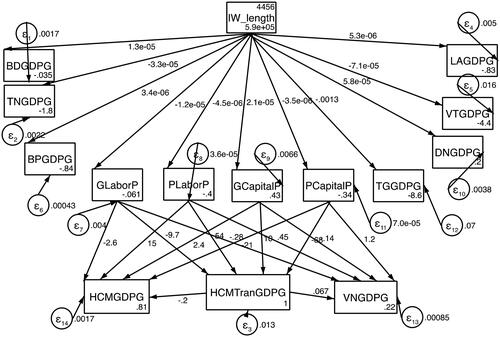
Figure 3.2. Depiction of the Structural Equation Modeling (SEM) estimation of the mobile_phone factor (total number of mobile network subscriptions), illustrating its influence on the development of transportation and spillover effects on neighboring provinces.
Source: Study result of authors.
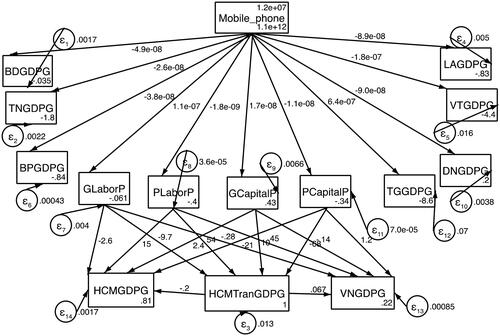
Figure 3.3. Depiction of Structural Equation Modeling (SEM) estimation of the corrupt_control factor (corruption control), illustrating its influence on the development of transportation and spillover effects on neighboring provinces.
Source: Study result of authors.
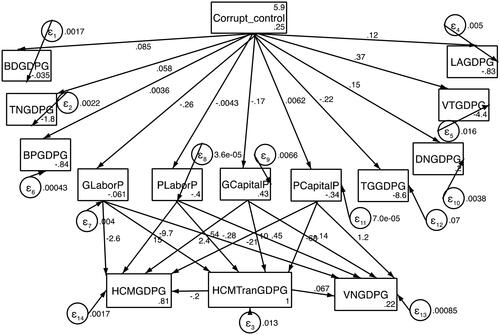
Figure 3.4. Depiction of the Structural Equation Modeling (SEM) estimation of the state_invest factor (investment from state capital in HCM), illustrating its influence on the development of transportation and spillover effects on neighboring provinces.
Source: Study result of authors.
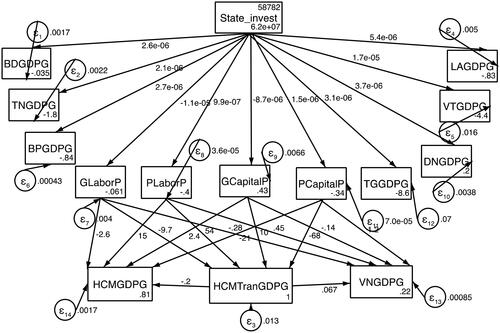
Figure 3.5. Depiction of the Structural Equation Modeling (SEM) estimation of the PCI factor (Provincial Competitiveness Index), illustrating its influence on the development of transportation and spillover effects on neighboring provinces.
Source: Study result of authors.
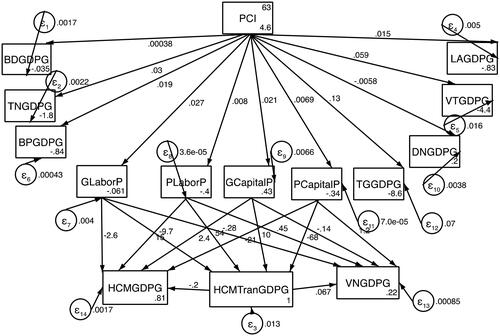
includes , , , , and , each detailing the Structural Equation Modeling (SEM) estimation of factors influencing the development of transportation and spillover effects on neighboring provinces. These figures illustrate the cause-and-effect relationship between exogenous and endogenous variables using the maximum likelihood estimation method. Rectangles represent exogenous and endogenous variables, while circles represent latent variables. The detailed results are provided in Appendix C.
Exogenous variables included IW_length (inland waterway length), mobile_phone (total number of mobile network subscriptions), corrupt_control (corruption control), state_invest (investment from state capital in HCM), and PCI (provincial competitiveness index). Endogenous variables included BDGDPG (GDP growth of Binh Duong province), TNGDPG (GDP growth of Tay Ninh province), BPGDPG (GDP growth of Binh Phuoc province), GLaborP (goods productivity calculated on the total number of employees), PLaborP (people productivity calculated on the total number of employees), GCapitalP (goods productivity calculated on total capital), PCapitalP (people productivity calculated on total capital), TGGDPG (GDP growth of Tien Giang province), DNGDPG (GDP growth of Dong Nai province), VTGDPG (GDP growth of Vung Tau province), LAGDPG (GDP growth of Long An province), HCMGDPG (GDP growth of HCM), HCMTranGDPG (GDP growth of transportation in HCM), and VNGDPG (GDP growth of VN).
7.4.2. Results of SEM estimation
H1, H2, H3: IW length, mobile phone, corruption control, PCI, and state investment have a significant effect on transportation development (goods labor productivity, people labor productivity, goods capital productivity, and people capital productivity):
The SEM estimation for the first result is that while mobile phone has a positive effect, corruption control and state investment have a negative effect on goods labor productivity. In addition, PCI and state investment have a positive effect on people labor productivity, corruption control has a negative effect on goods capital productivity. And finally, mobile phone has the opposite effect, PCI and state investment have a positive effect on people capital productivity. All of the above influences are direct and total effects.
H4, H5, H6: IW length, mobile phone, corruption control, PCI, and state investment have a significant effect on GDP growth of neighboring provinces:
The SEM estimation results show that firstly, corruption control has a positive effect on GDP growth of Binh Duong. Secondly, while mobile phone has the opposite effect, PCI has a positive influence on GDP growth of Binh Phuoc, at the same time mobile phone has a positive influence and IW length has a negative effect on GDP growth of Tien Giang. Thirdly, while mobile phone has an opposite effect, corruption control has a positive effect on GDP growth of Vung Tau and Dong Nai. And finally, there is no impact on GDP growth of Tay Ninh and Long An.
H7, H8, H9: The transportation physical factor, institutional factor, and technological factor have a significant indirect effect on GDP growth of transportation in HCM, GDP growth of HCM, and GDP growth of Vietnam:
SEM estimation results show that there is no indirect influence of transportation physical, institutional, and technological factors on GDP growth of transportation in HCM, GDP growth of HCM, and GDP growth of Vietnam.
In addition,
The results show that there are different influences on the cause-and-effect relationships between transportation development (goods labor productivity, people labor productivity, goods capital productivity, and people capital productivity) and GDP growth of transportation in HCM, GDP growth of HCM, and GDP growth of VN; between the GDP growth of transportation in HCM and GDP growth of HCM and GDP growth of Vietnam. The details will be made in the discussion section.
7.5. Testing the goodness of fit of SEM
7.5.1. RMSEA
shows RMSEA = 0.001, Probability RMSEA < = 0.05. CI = 90%.
Table 6. RMSEA test result.
Browne and Cudeck (Citation1993) defined ‘close match’ as an RMSEA value less than or equal to 0.05. And, according to MacCallum et al. (Citation1996), a 90% Confidence Interval (CI) around the point estimate allows an assessment of the accuracy of the RMSEA estimate. On the basis of CI, it can be said with a certain degree of confidence that the given interval contains the true value of the fit index for that model in the population. Thus, this result satisfies the theory mentioned.
7.5.2. The coefficient of determination (CD)
CD represents the amount of variability in the data that the model explains. The results show the CD = 0.999 which is significant, showing a good prediction of dependent variables. The closer CD is to 1, the better the model is. CD < 0.19 is very weak, 0.19 < = CD < 0.33 is weak, 0.33 < = CD < 0.67 is moderate, CD > = 0.67 is significant (Chin, Citation1998). According to Hair et al. (Citation2011), CD < 0.25 is very weak, 0.25 < = CD < 0.50 is weak, 0.50 < = CD < 0.75 is moderate, CD > = 0.75 is significant. The result of shows the CD = 0.999, which is significant and satisfies the theory mentioned.
7.5.3. Stability analysis of simultaneous systems
The result of stability analysis of simultaneous systems describes the eigenvalue stability condition clearly is stability index = .0000107.
A non-recursive SEM is said to be stable if an SEM has an eigenvalue is approaching zero, an eigenvalue equal to zero is perfectly stable (Daniel et al., Citation2021). Thus, results of SEM estimation satisfy the theory mentioned. And the output of the Stata software shows ‘All the eigenvalues lie inside the unit circle. SEM satisfies the stability condition’.
7.5.4. Wald test
shows Wald test results. The results show the magnitudes of chi square Δχ2 are quite large. Specifically, chi square of GDP growth of transportation in HCM = 1255.75, of GDP growth of Vietnam = 111.09.
Table 7. Wald test result.
The P-values of all variables are < = 5%, excepting P-values of GDP growth of Long An = 0.3802 > 5%, GDP growth of Tay Ninh = 0.2003 > 5%, and GDP growth of Binh Duong = 0.1362 > 5%.
However, the Wald test is asymptotically equivalent to the chi-squared difference test (Δχ2) and does not require a redefinition of the model (Bollen, Citation1989).
7.5.5. Modification indices (MI)
The result is that all MI values are less than 3.841458820694123.
MI is the index that estimates the change of χ2 for each case of adding a possible relationship (corresponding to one degree of freedom). If Δ𝜒2 > 3.84, then allowing the relationship increases the model’s goodness of fit. However, the researcher should be cautious because the relationship added to the model is only considered when it supports the theory and should not try everything to improve the indices to make the model more suitable (Hair et al., Citation1998; Topcu & Erdur-Baker, Citation2010). In this case, authors decided not to add any more relationships to the model.
8. Discussion
Based on SEM estimation results, the cause-and-effect relationship between exogenous variables and endogenous variables were tested. In this study, a significance level < =5% (P value < =5%) are accepted (Hair et al., Citation2016).
Below is our discussions, explanations, and comments for each hypothesis according to the SEM estimation results:
H1: The transportation physical factor has a significant direct effect on transportation development: SEM estimation results show that H1 was rejected
H4: The transportation physical factor (IW length observed variable) has a significant direct effect on transportation development and on GDP growth of the neighboring provinces:
SEM estimation results show that the exogenous observed variable IW length has only a statistical Significance (P value = 0.001) at a direct relationship with GDP Growth of Tien Giang with coefficient = –0.001348. Thus, it is concluded that IW length has a negative effect on GDP Growth of Tien Giang. That is, an increasing in IW length will decrease GDP Growth of Tien Giang and other endogenous variables remain unchanged. With this result, we can see the inland waterway length variable affects GDP Growth of Tien Giang (GDP Growth of neighboring provinces), it does not have influence on the variables on transportation development, we consider this to be the finding which is different from the past research studied by White and Senior (Citation1983) that the first factor affects transportation development is confirmed to be the physical factor, which can be understood as controlling the terrain of the roads and the routes.
H2, H5: The institutional factor (observed variables: corruption control, state investment, and PCI) has a significant direct effect on transportation development and on GDP growth of the neighboring provinces:
The results of SEM estimation show that all observed variables included corruption control, state investment, and PCI have influence on transportation development and GDP growth of the neighboring provinces, namely:
Firstly: with the results of a statistical significance at P value < 5%, it can be concluded that corruption control affects goods labor productivity, goods capital productivity, GDP growth of Binh Duong, GDP growth of Vung Tau, and GDP growth of Dong Nai. Specifically, corruption control has a significant negative effect on goods labor productivity at coefficients = –0.2614856, negatively affects goods capital productivity at coefficients = –0.1718876, has a significant positive effect on GDP growth of Vung Tau at coefficient = 0.3680052, and positively affects GDP growth of Binh Duong and GDP growth of Dong Nai at coefficients = 0.0853493 and 0.1487931, respectively. The results show that a reducing in corruption control will increase goods labor productivity and goods capital productivity, but if reducing the corruption control, it will reduce GDP growth of Binh Duong, GDP growth of Vung Tau, and GDP growth of Dong Nai. More importantly, Vietnam (especially HCM) is in the period of thorough and urgent corruption control, so the idea to decrease corruption control is not reasonable.
Secondly: Similarly, a result of P value < 5% shows that state investment has a negative effect on goods labor productivity at coefficient = –0.0000111, a positive effect on people labor productivity at coefficient = 9.85E-07, and a positive effect on people capital productivity at coefficients = 1.54E-06. Based on the magnitude of the coefficient, the effect is not significant. However, an increase in state investment will increase people labor productivity and people capital productivity and will decrease goods labor productivity.
Thirdly: Similarly, PCI positively affects people labor productivity at coefficient = 0.0080287, people capital productivity at coefficient = 0.0069236, and GDP growth of Binh Phuoc at coefficient= 0.0187554. With this result, based on the magnitude of the coefficients, although the impact of PCI is not significant. However, PCI (Provincial Competitiveness Index) is very important for the development of any industry, not just the transportation industry, so it is easy to see that in order to increase people labor productivity, people capital productivity, and GDP growth of Binh Phuoc, it is necessary to increase PCI.
H3, H6: The technological factor (mobile phone observed variable) has a significant direct effect on transportation development and on GDP growth of the neighboring provinces:
Similarly, SEM estimation results show that mobile phone positively affects goods labor productivity at coefficient = 1.06E-07, GDP growth of Tien Giang at coefficient = 6.37E-07, negatively affects people capital productivity at coefficient = –1.15E-08, GDP growth of Binh Phuoc, GDP growth of Vung Tau, and GDP growth of Dong Nai at coefficients = –3.77E-08, – 1.80E-07, and -9.00E-08, respectively. This result shows that the influence of mobile phones on endogenous variables is insignificant and the influence is complex in both directions (in the same direction and in the opposite direction), so there is a trade-off between increasing or decreasing mobile phone. For example, an increase in mobile phones will increase goods labor productivity and GDP growth of Tien Giang but will decrease people capital productivity, GDP growth of Binh Phuoc, GDP growth of Vung Tau, and GDP growth of Dong Nai.
H7, H8, H9: The transportation physical factor, institutional factor, and technological factor have a significant indirect effect on GDP growth of transportation in HCM, on GDP growth of HCM, and on GDP growth of Vietnam:
SEM estimation results show that there is no indirect influence of transportation physical factor, institutional factor, and technological factor on GDP growth of transportation in HCM, on GDP growth of HCM, and on GDP growth of Vietnam. This shows that although increasing or decreasing observed variables including IW length, corruption control, state investment, PCI, and mobile phone at any dose level, there is no indirect effect on GDP growth of transportation in HCM, GDP growth of HCM, and GDP growth of Vietnam. This is also a remarkable finding of the study.
In addition,
The SEM estimation results show that there are different influences. Specifically, while people labor productivity and goods capital productivity have a positive influence, goods labor productivity and people capital productivity have a negative influence on GDP growth of transportation in HCM. Similarly, people labor productivity and goods capital productivity have a positive effect, goods labor productivity, and people capital productivity have the opposite effect on GDP growth of HCM. But there is no impact on GDP growth of Vietnam. At the same time, the results show that GDP growth of transportation in HCM neither affects GDP growth of HCM nor affects GDP growth of Vietnam.
From the above discussion, we can see the impacts of exogenous variables (IW length, mobile phone, corruption control, PCI, and state investment) on endogenous variables (goods labor productivity, people labor productivity, goods capital productivity, people capital productivity, and GDP growth of the neighboring provinces) have exactly the same in direct influences and total influences. The influences of endogenous variables (goods labor productivity, people labor productivity, goods capital productivity, and people capital productivity) on endogenous variables (GDP growth of transportation in HCM, GDP growth of HCM, and GDP growth of Vietnam) are quite complicated. And GDP growth of transportation in HCM impacts neither GDP growth of HCM nor GDP growth of Vietnam.
Besides, it is noteworthy that there is no indirect effect between the five exogenous variables (IW length, mobile phone, corruption control, PCI, and state investment) and the three endogenous variables (GDP growth of transportation in HCM, GDP growth of HCM, and GDP growth of VN).
9. Conclusion
Firstly: Theory
The results show that corruption control has a negative effect on goods labor productivity and on goods capital productivity. State investment and provincial competitiveness index have different effects on goods labor productivity, people labor productivity, people capital productivity, which support institutional theory that institutions are perhaps the most important factor in explaining land use decisions and patterns related to transportation and land use. Various institutions and barriers both control and guide the decision-making process regarding transportation and land use (Amin & Thrift, Citation1995; Clingermayer & Feiock, Citation2001; North, Citation1990; Stough, Citation2016).
Mobile phone has different influences on goods labor productivity, people capital productivity, which supports the evolutionary theory that the technological changes affects maintaining the position of good transportation infrastructure. Finally, inland waterway, corruption control, provincial competitiveness index, and mobile phone have different influences on GDP growth of neighboring provinces, which supports the theory related to spillover effect that a transportation hub facilitates multimodal exchange as transportation services are provided in the supply chain network from the hub to the neighboring regions. Because transportation activities at any point in the network will affect the entire network for neighboring provinces (David & Yemisi, Citation2015).
Secondly: Practicality
Inland waterway length: has a negative direct effect on GDP growth Tien Giang. From this result, it is easy to see that a decreasing in inland waterway length will increase GDP growth of Tien Giang.
Mobile phone: has a positive direct effect on goods labor productivity and GDP growth of Tien Giang, it negatively affects people capital productivity and GDP growth of the neighboring provinces (Binh Phuoc, Vung Tau, and Dong Nai). This result shows that a decreasing in mobile phone will give an increase in people capital productivity, in GDP growth of the neighboring provinces (Binh Phuoc, Vung Tan, and Dong Nai). However, there will decrease goods labor productivity and in GDP growth of Tien Giang. In this case, we have to accept the trade-off between reducing goods labor productivity and GDP growth of Tien Giang and increasing people capital productivity, GDP growth of Binh Phuoc, GDP growth of Vung Tau, and GDP growth of Dong Nai.
Corruption control: while corruption control positively affects GDP growth of the neighboring provinces (Binh Duong, Vung Tau, and Dong Nai), it negatively affects goods labor productivity and goods capital productivity. The best solution for this case is increasing corruption control to increase GDP growth of the neighboring provinces, at the same time it must accept to decrease goods labor productivity and goods capital productivity.
Provincial competitiveness index: provincial competitiveness index has a positive direct effect on people labor productivity, people capital productivity, and GDP growth of Binh Phuoc. From this result, it is easy to see that an increasing provincial competitiveness index will increase people labor productivity, people capital productivity, and GDP growth of Binh Phuoc.
State investment: while state investment has a positive direct effect on people labor productivity and people capital productivity, has negative direct effect on goods labor productivity. This result shows that an increase in state investment will increase people labor productivity and people capital productivity but will decrease goods labor productivity.
Implications
Using the classical location theory, location theory, institutional theory, evolutionary theory, and theory related to spillover effect (theory of regional development and international trade), and based on the study results, discussion, and conclusions, we want to provide implications for the government, transportation policy makers and managers.
First of all, it should be noted that, in the case of there is a variable has a two-way effect (positive effect and negative effect) on endogenous variables, it is necessary to consider and accept the trade-off.
Firstly, it is recommended that a decrease in inland waterway length will have an increase in GDP growth of Tien Giang.
Next, because provincial competitive index has a positive direct effect on people labor productivity, people capital productivity, and GDP growth of Binh Phuoc, we suggest that the provincial competitiveness index must increase to increase people labor productivity, people capital productivity, and GDP growth of Binh Phuoc.
Also, mobile phone has a positive direct effect on goods labor productivity and GDP growth of Tien Giang, and it has a negative direct influence on people capital productivity, GDP growth of the neighboring provinces (Binh Phuoc, Vung Tau, and Dong Nai). Consequently, our recommendation is to reduce mobile phone to have an increase in people capital productivity and GDP growth of the neighboring provinces (Binh Phuoc, Vung Tau, and Dong Nai).
In addition, corruption control has a positive direct impact on GDP growth of the neighboring provinces (Binh Duong, Vung Tau, and Dong Nai), it has a negative direct influence on goods labor productivity and goods capital productivity. Because corruption control is the strategy for political stability and economic development in Vietnam (especially in HCM). Therefore, in this case, solutions to reduce corruption control are eliminated. We propose that increasing corruption control to increase GDP growth of the neighboring provinces (Binh Duong, Vung Tau, and Dong Nai), and at the same time we must accept a decrease in goods labor productivity and goods capital productivity.
And finally, government, planners, and transportation managers should accept the trade-off between increasing people labor productivity and people capital productivity and decreasing goods labor productivity by increasing state investment.
Limitations
Firstly, the annual time series data for the period 2010–2020 we consider to be short. Actually, we had great difficulty in extracting data from many sources as described in section 5. That is, since 2010 there were only a few provinces in Vietnam that have had a statistical system working, including HCM and eight neighboring provinces in the southern key economic region of Vietnam. Although we have tried with great effort, we still cannot collect enough data for 2021 and 2022 because the data which are published by the statistical bureaus and statistical yearbooks usually take about two years. However, Vietnam’s economic cycle is every four years. So, we think that the size of this data as eleven years is temporarily acceptable in the context of a country that has just escaped poverty like Vietnam. We believe that the future researches will have a better solution of the data issue.
Secondly, this study did not emphasize sustainable transport development or environmental friendly, we consider this is a limitation. Our next study will be about sustainable transportation development (social development, economic development, environmental development), data will be primary data by building a questionnaire to survey transportation enterprises in HCM.
Future study
We will study the same research topic as this article. However, we will use the cross-data method, by building a questionnaire and surveying enterprises in the transportation industry or logistics enterprises which specialize in transportation.
Author contributions
Both authors contributed equally to the conception and design of the study.
5th_paper_data_01_Dec_23__.xlsx
Download MS Excel (159.2 KB)PUBLIC INTEREST STATEMENT.docx
Download MS Word (28.7 KB)Acknowledgments
This research is funded by University of Economics and Law, Vietnam National University Ho Chi Minh City, Vietnam ‘We thank Dr. James Bleach, Susan Keron, and Dr. Graham Birley of the ōbex project for language editing support’.
Disclosure statement
We declare that we have no significant competing interests, including financial or non-financial, professional, or personal interests that interfere with the full and objective presentation of the work described in this manuscript.
We have described our financial and non-financial interests in the space below.
Correction Statement
This article has been corrected with minor changes. These changes do not impact the academic content of the article.
Additional information
Funding
Notes on contributors
Vu Thi Kim Hanh
Vu Thi Kim Hanh, is associated with University of Economics and Law, Ho Chi Minh City, Vietnam, and Vietnam National University, Ho Chi Minh City, Vietnam.
Nguyen Hong Nga
Nguyen Hong Nga, is associated with University of Economics and Law, Ho Chi Minh City, Vietnam, and Vietnam National University, Ho Chi Minh City, Vietnam.
References
- Amin, A., & Thrift, N. (1995). Globalization, inatitutional ‘thickness’ and the local economy. In P. Healey, S. Cameron, S. Davaoudi, S. Graham and A. Madani-Pour (Eds.), Managing cities: A new urban context. Wiley.
- Anderson, J. C., & Gerbing, D. W. (1988). Structural Equation modeling in practice: A review and recom- mended two-step approach. Psychological Bulletin, 103(3), 1–23. 103.3.411. https://doi.org/10.1037/0033-2909
- Banister, D. (2005). Transport and urban development. E & FN Spon, an imprint of Chapman & Hall.
- Blauwens, G., & Van de Voorde, E. (1988). The impact of port choice on inland transportation. Maritime Policy & Management, 15(2), 127–140. https://doi.org/10.1080/03088838800000023
- Blauwens, G., & Van de Voorde, E. (1988b). The valuation of time savings in commodity transport. International Journal of Transport Economics, 6(1), 77–87.
- Bollen, K. A. (1989). Structural equations with latent variables. Wiley.
- Browne, M. W., & Cudeck, R. (1993). Alternative ways of assessing model fit. In K. A. Bollen & J. S. Long (Eds.), Testing structural equation models (pp. 136–162). SAGE.
- Button, K., & Nijkamp, P. (1997). Social change and sustainable transport. Journal of Transport Geography, 5(3), 215–218. 1997. https://doi.org/10.1016/S0966-6923(97)00018-5
- Castells, A., & Solé-Ollé, A. (2005). The regional allocation of infrastructure investment: The role of equity, exigency and political factors. European Economic Review, 49(5), 1165–1205. https://doi.org/10.1016/j.euroecorev.2003.07.002
- Chin, W. W. (1998). The partial least squares approach to structural equation modeling. Modern Methods for Business Research, 295(2), 295–336.
- Clarke, A. (1963). Profiles of the fature. Bantam Books.
- Clingermayer, J. C., & Feiock, R. C. (2001). Institutional constraints andpolicy choice: An exploration of local government. State University of New York.
- Coyle, J. J., Bardi, E. J., & Novack, R. A. (2000). Transportation (Fifth edition). South Western College Publishing.
- Coyle, J. J., Novack, R. A., & Gibson, B. J. (2016). Transportation: A global supply chain perspective (Eighth Edition). South Western College Publishing.
- Daniel, K., Jessica, M., & Jason, N. (2021). Using eigenvalues and eigenvectors to find stability and solve ODEs. USA: University of Michigan.
- David, J. C., & Yemisi, A. B. (2015). Transportation’s role in economic development and regional supply chain hubs. Transportation Journal 54(1), Special Issue Transportation & Supply Chain Relations (Winter 2015) 33–34.
- Fabrigar, L. R., Wegener, D. T., MacCallum, R. C., & Strahan, E. J. (1999). Evaluating the use of explora- tory factor analysis in psychological research. Psychological Methods, 4(3), 272–299. https://doi.org/10.1037/1082-989X.4.3.272
- Gordon, D. (1995). Sustainable transportation: What do we mean and how do we get there? In D. Sperling & S. A. Shaheen (Eds.), Transportation and energy: Strategies for a sustainable transportation system (pp. 1–11). American Council for an Energy-Efficient Economy.
- Gorsuch, R. (1983). Factor analysis (2nd ed.). Lawrence Erlbaum Associates.
- Hair, J. F., Anderson, R. E., Tatham, R. L., & Black, W. C. (1995). Multivariate data analysis with readings (4 th ed.). Prentice-Hall.
- Hair, J. F., Jr., Anderson, R. E., Tatham, R. L., & Black, W. C. (1998). Multivariate data analysis with readings. Prentice-Hall.
- Hair, J., Jr, F., Hult, G. T. M., Ringle, C., & Sarstedt, M. (2016). A primer on partial least squares tructural equation modeling (PLS-SEM). Sage publications.
- Hair, J. F., Ringle, C. M., & Sarstedt, M. (2011). PLS-SEM: Indeed a silver bullet. Journal of Marketing Theory and Practice, 19(2), 139–152. https://doi.org/10.2753/MTP1069-6679190202
- Hair, J. F., William, C. B., Barry, J. B., & Rolph, E. A. (2009). Multivariate data analysis: A global perspective (7th ed., pp. 761). Prentice Hall.
- Hance, W. A. (1967a). African economic development (p. 117). Harper and Row.
- HCM Statistical Office. (2020). http://www.pso.hochiminhcity.gov.vn/web/guest/hom.
- Hensher, D. A., & Button, K. (2003). Handbook of transport and the environment. Elsevier.
- Hicks, S. (1977). Urban freight. In D. Hensher (Ed.), Urban transport economics. Cambridge University Press.
- Hoover, E. M. (1948). The location of economic activity. McGraw-Hill.
- Hung, K. V. (2010). Transport sector in Vietnam: Current issues and future agenda. Institute of Transport Planning and Management University of Transport and Communications
- Hunt, S. D., & Morgan, R. M. (1997). Resource-advantage theory: A Snake Swallowing Its Tail or a General Theory of Competition? Journal of Marketing, 61(4), 74–82. https://doi.org/10.2307/1252088
- Introna, L. D. (1991). The Impact of Information Technology on Logistics. International Journal of Physical Distribution & Logistics Management, 21(5), 32–37. https://doi.org/10.1108/EUM0000000000387
- Joseph, F. H.Jr., William, C., Black, B. J., & Barin, E. A. (2010). Multivariate data analysis (7th ed.). Pearson Prentice Hall.
- Kaiser, H. F. (1960). The application of electronic computers to factor analysis. Educational and Psychological Measurement, 20(1), 141–151. https://doi.org/10.1177/001316446002000116
- Kranzberg, M. (1970). The social impact of transportation technology: Some lessons of history. In G. Smerk (Ed.), Essays on transportation problems in the 1970s (pp. 4–35). Bureau of Business Research, Indiana University.
- MacCallum, R. C., Browne, M. W., & Sugawara, H. M. (1996). Power analysis and determination of sample size for covariance structure modeling. Psychological Methods, 1(2), 130–149. https://doi.org/10.1037/1082-989X.1.2.130
- Macioszek, E., & Jurdana, I. (2022). Analysis of the development of e-commerce in Poland from 2010–2020 and its impact on the transport sector. Scientific Journal of Silesian University of Technology, 116, 197–209. https://doi.org/10.20858/sjsutst.2022.116.12
- Marsh, H. W., Balla, J. R., & McDonald, R. P. (1988). Goodness-of-fit indexes in confirmatory factor analysis: The effect of sample size. Psychological Bulletin, 103(3), 391–410. https://doi.org/10.1037//0033-2909.103.3.391
- Medaniel, D. E. (1972). Transportation forecasting: A review. Technological Forecasting and Social Change, 3, 367–389.
- Netemeyer, R. G., Bearden, W. O., & Sharma, S. (2003). Scaling procedures: Issues and applications. Sage Publications. https://doi.org/10.4135/9781412985772
- North, D. (1990). Institutions, institutional change and economicperformance. Cambridge University Press.
- Pett, M. A., Lackey, N. R., & Sullivan, J. J. (2003). Making sense of factor analysis: The use of factor analysis for instrument development in health care research. SAGE Publications, Thousand Oaks. https://doi.org/10.4135/9781412984898
- Rocha, C. M., & Chelladurai, P. (2012). Item parcels in structural equation modeling: An applied study in sport management. International Journal of Psychology and Behavioral Sciences, 2(1), 46–53. https://doi.org/10.5923/j.ijpbs.20120201.07
- Rodrigue, J.-P. (2020). The geography of transport systems (Fifth edition, pp. 456). Routledge.
- Sekaran, U. (1992). Research methods for business. John Wiley & Sons.
- Stata Corp. (2021). Stata: Release 17. Statistical Software. StataCorp LLC.
- Stathopoulos, A., Valeri, V., & Marcucci, E. (2012). Stakeholder reactions to urban freight policy inno- vation. Journal of Transport Geography, 22, 34–45. https://doi.org/10.1016/j.jtrangeo.2011.11.017
- Stough, R. R. (2016). Institutions, land use and transportation. In Handbook of Transport Geography and Spatial Systems. 2016; 27–42. https://doi.org/10.1108/9781615832538-003
- Tabachnick, B. G., & Fidell, L. S. (2001). Using multivariate statistics (Fourth Edition ed.). Allyn & Bacon.
- The Port of New York Authority. (1963). Comprehensive Planning Office. Metropolitan Transportation-1980. The Port of New York Authority.
- Topcu, ç., & Erdur-Baker, O. ¨. (2010). The revised cyber bullying inventory (RCBI): Validity and reliability studies. Procedia – Social and Behavioral Sciences, 5, 660–664. https://doi.org/10.1016/j.sbspro.2010.07.161
- Wang, K.-J., Hong, W.-C., Chen, S.-H., & Jiang, J.-T. (2011). Strategic development trend and key factors analysis of airport city in Taiwan. Journal of Transport Geography, 19(4), 807–820. https://doi.org/10.1016/j.jtrangeo.2010.10.003
- Wartenberg, C. M. (1966). Von Thünen’s Isolated State. Pergamon Press.
- Weber, A. (1909). The theory of the location of industries. The University of Chicago Press.
- White, H. P., & Senior, M. L. (1983). Transport Geography. Longman.
- Zurynek, J., Zeleny, L., & Mervart, M. (2008). Dopravni procesy v cestovnim ruchu {Transport processes in tourism}. ASPI.
- Zurynek, J., Zeleny, L., & Mervart, M. (2010). Dopravni procesy v cestovnim ruchu. Transport processes in tourism. ASPI Ministry of Transport, Construction and Regional Development of the Slovak Republic. (2010). Strategia rozvoja dopravy Slovenskej republiky do roku.