
Abstract
This paper investigates the practicality of upholding supply chains’ resilience and sustainability using six aspects of closed-loop supply chain models considering circular economy (CLSMs). A plant-level survey was utilised to test the influence of CLSMs on resilience sustainability. A proposed research model and hypotheses are tested using cross-sectional face-to-face and e-mail survey data collected from manufacturing firms in Kenya. Structural equation modelling is used to test the proposed hypotheses. Cleaner production exhibits more influence on resilient sustainability on both economic and social sustainability, where the Japanese 5S approach is the most prevalent in cleaner production. Green procurement combined with design for the environment shows a positive effect on environmental sustainability, and reverse logistics shows a positive effect on resilience, unfolding the importance of devising CLSMs strategies for building both resilience and sustainability. Surprisingly, green logistics did not affect any of the resilient sustainability dimensions and reverse logistics on sustainability. These results reveal the practicality of upholding supply chains’ resilience and sustainability through CLSMs. While few studies test the direct link between CLSMs and resilient sustainability, this study is significant in the upstarting of such investigations, more so from an empirical perspective. This study contributes to extant literature, practice, and policy by showing the importance of building both resilience and sustainability of supply chains using CLSMs and adopting trade-offs as starting points as economies walk towards points of balance. From a policy perspective, this study points out the need for stringent CLSMs policy measures towards resilience and sustainability, more so in Sub-Saharan African manufacturing contexts.
Reviewing Editor:
1. Introduction
In recent scholarly discourse (Ramanathan et al., Citation2023), there has been emergent attention on closed-loop-based circular economy supply models (CLSMs) for achieving supply chain (SC) resilience and sustainability. This is in response to growing global societal, economic and environmental challenges. For instance, trade tensions among China, the US, and Europe, COVID-19 effects, the Ukraine-Russia wars, and the ever-warming globe threaten global SC sustainability. Manurung et al. (Citation2023) reiterate that SCs remain susceptible to several global disruptions that have a propagating effect on their networks. To address these challenges, SCs must be resilient and sustainable by adopting robust practices such as CLSCMs. Holling (Citation1973) argues that resilience is the capability of a system to bounce back after a disruption and move forward to an improved state. Novak et al. (Citation2021) emphasize that supply chain resilience (SCR) entails continual strategic transformations among SC partners in their response mechanisms to disruptions. This highlights a need for SCs to build and sustain their system resilience, recognizing the importance of system sustainability.
For systems to be sustainable, they must be persistent on the roadmap toward sustainable development (SD). SD delineates efficient resource usage in a manner that does not compromise future generations’ access to such resources (World Commission on Environment and Development, Citation1987). In that view, SD continues to be viewed from a stability perspective (Marchese et al., Citation2018) of the triple bottom line.
However, such a view shows a static system dimension of sustainability, which is disadvantaged by the need for more assessment and response to the dynamics of this system. This indicates the need to transition from a triple to a quadruple bottom line to arrest unsustainable turbulences.
Resilient sustainability is the capability of a system, an organization, a SC or an economy to cope with environmental, social, and economic disturbances. Against the backdrop, SD then calls for an ability to identify, assess, and respond to sustainability disruptions. That said, building resilient and sustainable systems calls for robust supply chain management (SCM) that essentially forms systems contributing to unsustainability. Nevertheless, SCs form the backbone of the global social-economic structure and the foundation of the natural environment. Also, SCs’ crucial role in economic development and social-ecological safety should take first-line priority amid their harmful activities to the planet. The Global Environmental Facility, as cited in De Backer and Flaig (Citation2017), argues that beef, soy, and palm oil in the agricultural SC contribute close to 80% of deforestation and 12% of the greenhouse gas effect globally. Such statistics highlight the need for CLSMs as a methodology that incorporates sustainability thinking into SCs from end to end (Guide & Wassenhove, Citation2009). This anchors regenerative and restorative practices (MC Arthur Foundation, Citation2015) towards SC resilience and sustainability. While CLSMs (Guide & Wassenhove, Citation2009) and resilient sustainability (Fahimnia & Jabbarzadeh, Citation2016) continue to gain traction, a sufficiently established model in emerging markets still needs to be explored.
The International Finance Corporation (Citation2021) highlights the need to prioritize the reduction of the GHG effect in emerging markets like Sub-Saharan Africa. Also, building upon this foundation, extant literature evaluates how the two CLSMs influence resilient sustainability (Cankaya & Sezen, Citation2019; Jassim et al., Citation2020; Rao & Holt, Citation2005; Binalla & Mate, Citation2022). Despite the extensive literature on the relationship between CLSMs and SC resilience and sustainability, empirical gaps in the direct link between the two components remain (Negri et al., Citation2022). Besides, frameworks on synergetic combinations of resilience and sustainability of SCs in Sub-Sahara contexts remain minimal. To address such gaps, this study investigates the influence of CLSMs and the resilient sustainability of SCs in a Sub-Saharan African manufacturing context (Kenya). Contexts in Sub-Saharan Africa, alluded to as agricultural-fed communities, continue to experience insurmountable challenges hindering their SC expansion, resilience and sustainability. The International Monetary Fund (Citation2020) argues that regions in the Sub-Sahara with weak governance systems, heavy dependence on agriculture, and conflict bound will continuously be disrupted. Such disruptions will continuously hinder the region’s sustainable and resilient growth. The United Nations Children’s Fund-UNICEF (2020) anticipates rising sea levels in most of the hotspots of the Sub-Sahara, like Kenya, Madagascar, and Mozambique, in their coastal regions and banks of their inland lakes.
UNICEF (2020) further documents hotspots in the Sub-Sahara with the most recent climate change disruptive occurrences, such as:
*Severe Horn of Africa drought in (Djibouti, Eritrea, Ethiopia, Kenya, Somalia, South Sudan, and Uganda). The drought affected at least 17 million people. *
*The cyclone Idai and Kenneth in Mozambique in 2019 affected 1.85 million people. *
*East Africa’s battle with locusts (Kenya) due to a warming climate (onset of 2020). *
*Occasional flooding in Lake Victoria (Kenya) affecting the surrounding communities. *
Also, the findings of this study reveal the need for a convergence between resilience and sustainability, which have long been argued to be distinct concepts.
The findings of this study still reveal that priority CLSMs are cleaner production, combined green procurement and design for the environment, and reverse logistics for the resilient sustainability of SCs. The study’s findings still reveal that achieving a point of equilibrium between the two components seems unrealistic. However, such convergence seems a realistic development towards a quadruple bottom line despite the existence of frameworks whose fit may be imperfect. These findings provide insights to practitioners, scholars and policymakers about sustainable and resilient investment decisions of supply chains taking the path of CLSMs.
This study selects a sample of manufacturing businesses from a Sub-Saharan African context (Kenya) for the above arguments. The Kenyan government continues to implement guidelines and regulations promoting circular economy, resilience, and sustainability. However, Kenya needs more stringent government measures to uphold such practices. This is evident from the need for more standardization on compliance of CLSMs. The Green Climate Fund-GCF (2017) argues that Kenya envisions manufacturing growth of 10% annually through its project flagship under the development of industrial zones. With the development of such zones and low social-environmental compliance, many negative environmental and social externalities emerge (GCF, 2017). GCF (2017) estimates an increase in emissions from 59 million tons of carbon dioxide equivalent (MtCO2 e) in 2010 to 102 MtCO2 e in 2030. The Kenya National Climate Change Action Plan-KNCCAP (2018-2022) shows statistics of climate change effects as:
*’Kenya was hit by a drought in February 2017, leading to food insecurity for about 3.4 million people and inaccessibility to water for 0.5 million people. *
*Mount Kenya Glaciers are estimated to disappear in the next 30 years. *
*An estimated reduction of up to 45% in crop yield production for maize, soybean, and rice is expected by 2100. This will lead to serious food insecurity in the country and neighbouring regions. *
*Flooding in 2018 claimed 183 lives.’ *
2. Literature review
2.1. Resilience sustainability of supply chains
Both resilience and sustainability are multifaceted and multidimensional, interdisciplinary concepts with different meanings, interpretations and perspectives. It is also extensively recognized that supply chains should be sustainable and resilient.
2.1.1. Resilience of supply chains
Unpacking the concept of supply chain resilience points to Holling’s (Citation1973) arguments that demonstrate resilience debates resting on two commonly confused terms: stability and resilience. Holling (Citation1973) posits that the latter is founded on systems being able to pull through when faced with a disturbance and move forward to a better state, while the former concentrates on being able to bounce back to the original state. In the quest to understand resilience, it is worth noting that stability is a significant component of resilience but not itself. In the contention of Erol et al. (Citation2010), resilience is characterized by robustness and reliability, where reliability keeps a system in check during disturbances to ensure systems do not fall, while robustness ensures system functionality without extreme destruction. McManus et al. (Citation2007) also look at resilience regarding situation awareness, management of vulnerabilities, and adaptive capacity.
Van Opstal (Citation2007, as cited in Erol et al., Citation2010) considers resilience as the ability to be risk-intelligent, flexible and agile. Hollnagel et al. (Citation2006) focus on preparedness, flexibility, and capacity as primary resilience attributes. According to Fiksel (Citation2006), resilience concentrates on efficiency, cohesion, diversity, and adaptability as significant attributes of resilience.
Moreover, Christopher & Peck (Citation2004) look at resilience in terms of the risk management culture, supply chain design principles, supply chain engineering, visibility, collaboration, and the ability to be agile. Jain et al. (Citation2017) looked at 13 measures to define resilience: adaptive capacity, technological capacity among partners, reduction of uncertainty, a risk management culture, supply chain agility, supply chain visibility, market sensitiveness, supply chain structure, information sharing, sustainability, risk and revenue sharing and collaboration. The arguments of prior scholars depict resilience measures as risk management culture, visibility, velocity, flexibility, agility, redundancy, robustness, adaptability, and transformability. The discussions on resilience from different scholars show a static-based approach to resilience, which only indicates the ability of a system to bounce back. The growth of systems goes beyond their static nature and instead depends on their continuous development. According to Novak et al. (Citation2021), the resilience of supply chains is usually viewed from an equilibrium perspective that brings forth tensions between supply chain resilience and firm resilience.
Novak et al. (Citation2021) argue that an equilibrium-based approach of just bouncing back is not viable, more so in complex adaptive systems like supply chains. This means that supply chain resilience needs to be viewed from a scale perspective, which Novak et al. (Citation2021) posit as a standard reference point of resilience in supply chains as complex networks. Novak et al. (Citation2021) further contend that SC resilience involves many actors beyond the firm level, such as non-governmental organizations and regulatory agencies. It is also notable that such different actors pose dynamic interactions on the scale from which supply chain resilience should be measured. For instance, risk disruptions and their propagative effects occur at different times and magnitudes, which poses a challenge in measuring and understanding SC resilience. Measuring SC resilience from multiple scales alone could be misleading. In the context of Novak et al. (Citation2021), multiple scales look into every SC facet with interactions with all social actors of the world ecosystem, such as Non-Governmental Organizations. While this notion provides a basis for scientific arguments towards the right trajectory for building SC resilience, the notion is disadvantaged by a lack of scope relevance and criticality of measuring complex systems such as SCs. Building resilience, looking into all social actors of society, calls for different systems from the home economy to the firm level and supply chain to economies, which might take much work to achieve by looking at SCs as an end rather than a means to achieving the end.
Hollings, the father of ecological resilience, where the concept borrows heavily, discusses resilience as the capacity of a system to persistently absorb change and disturbance and, at the same time, maintain its position to move forward to a better state (Holling, Citation1973). While this definition is still anchored on supply chains as static systems, it brings out an essential perspective of persistence, highlighting the significance of continuous development that responds to the ever-changing circumstances within the world’s ecosystem. Against the backdrop, supply chain resilience is the ability of SCs viewed from its central node to continuously and persistently respond, adapt and build beyond their original position by picking up lessons and learning from them towards the continual development of their systems with the primary goal of growing economies and societies. Under such debates, this study looks at SC resilience from an adaptive (ability to plan and act in response to risk disruptions), agile (ability to respond with speed to volatile disruptions), robustness (ability to be calculative and careful in selecting strategies to manage risk disruptions) and risk management culture (ability to deal with foreseeable occurrences) perspective as depicted in .
Table 1. Supply chain resilience measures and meanings.
Table 2. Measurement items.
2.1.2. The sustainability of supply chains
Sustainability of any system in definitive measure borrows from the definition of the Brundtland Commission of 1987, anchoring the triple bottom line of social, economic, and environmental well-being. According to Wang and Sarkis (Citation2017), sustainability dimensions encompass economic, social and environmental pillars. In the arguments of Labuschagne and Brent (Citation2005), sustainable social development can be viewed from the perspective of external populations, internal human resources, stakeholder participation, and macro-performance issues. Such social sustainability indicators bring out the perspective of being cognizant of all societal stakeholders’ health, safety, and well-being. This means that supply chains and business firms should consider the impact of their activities on planet Earth’s stakeholders, whether those that buy from them (customers), their regulators or the larger society. According to Friedman (1970), there is only one model to measure social sustainability. Friedman (Citation1970) argues that businesses’ sole purpose is to be profitable with fair competition and not engage in fraud or corruption.
Looking into Friedman’s (Citation1970) reasoning about the social responsibility of businesses, it is clear that before the advent of intense globalization and the belief in active campaigns on sustainability, social responsibility was viewed from a profit-making perspective. Considering such thinking, it is unsurprising that sustainability started gaining momentum after the discussions in the Brundtland Commission of 1987. While businesses need to be profitable, it is also significant to consider other facets of development beyond the economic facet.
In the writings of McGuire (1963), an essential perspective of social sustainability is seen through corporate citizenship. Mcguire (1963) argues that the responsibilities of businesses are not only based on economic and legal aspects but have extensions to societal responsibility. Businesses exist for society. This means that the customers of businesses are society’s actors, whether man, animals or vegetation. In other words, businesses exist to support and sustain life. In this context, it is selfish for businesses only to guard their benefits from society (economic) and ignore the well-being of society and, more so, the impact of business activities on society. The claims of Carroll (1979) bring forth a more pronounced measurement of social sustainability. Carroll (1979) argues that it is businesses’ responsibility to consider society’s economic, discretionary, legal and ethical expectations. This kind of responsibility calls businesses to be as human as possible and consider life sacred. This means that the notion of considering businesses as mechanical systems is outdated. According to Labuschagne and Brent (Citation2005), as cited in Sarkis et al. (Citation2010), social sustainable development that looks into internal human resources is very important. This is because the first line of business contact is the internal customers. The health and safety of these internal customers then is paramount for the success of businesses. Labuschagne and Brent (Citation2005) look at social sustainability indicators from a health, safety, capacity development, diversity, discrimination, and equity perspective for internal human resources.
Labuschagne and Brent (Citation2005) further look into other indicators of social sustainability (external populations (human capital, productive capital and community capital), stakeholder participation (information provision) and macrosocial issues (stakeholder influence and social-economic-environmental performance). This study then views social sustainability from fairness (no discrimination), the safety of employees and customers and the health of employees and customers as part of manufacturing businesses’ mandate to take care of society. According to Morelli (2011), environmental sustainability looks into meeting human needs without affecting the health status of the planet.
Morelli (2011) further contends that environmental sustainability encompasses keeping the earth safe by reducing emissions, reducing waste, enhancing climate resilience and embracing the culture of recycling and reuse. Morelli (2011) argues that economic sustainability is all about allocating resources to allow future generations access to such resources. Economic sustainability can be measured through resource utilization or efficiency. It is a world of scarce resources and, more importantly, one planet for humanity and other inhabitants for the continuity of life and such calls for efficiency in resource use.
Morelli (2011) also argues that achieving economic sustainability requires minimizing social costs. Unpacking the social costs could mirror all costs that support the flow of activities in a given societal system. For instance, within SCs, minimizing ownership costs becomes essential for achieving economic sustainability. Sustainability measures are further depicted in .
Table 3. PLS-SEM measurement model interpretation.
2.2. Closed-loop supply chain models considering circular economy
To understand the concept of CLSMs, it is essential to conceptualize supply chain management (SCM). SCM has its roots in the works of Oliver and Webber, who coined the word during an interview in the Financial Times in 1982 depicting the management of the flow of raw materials, information, finances, people and resources from one point to another, encompassing suppliers, producers and customers. CLSMs are pegged on a circular economy model that the McHellen Arthur Foundation proposed in an attempt to move away from the linear model of take-make-dispose to a more circular system that encourages zero waste through the 4 R strategy of reduce, reuse, recycle and remanufacture through closing the loop of supply chains (Lahti et al., Citation2018). The circular economy model looks into creating value through waste generation and resource use for the environment’s well-being well-being. According to Kumar and Chandrakar (Citation2012), green supply chain management (GSCM) involves the incorporation of ecological thinking into SCM, from the sourcing of raw materials all through to getting the product to the customer and up to the point of product returns serviceability. A closed-loop supply chain encompasses the phases of a forward and reverse supply chain to manage waste disposal for the well-being of the environment, society and the economy.
Masoumik et al. (Citation2015) argue that GSCM measures range from eco-product design to green production, downstream, upstream, and post-use SC greening. Srivastava (Citation2007) emphasizes green design, operations, and reverse logistics. Sarkar (2012) contends that these practices must be essential. Recognized SCs must include green purchasing and inbound logistics, green distribution and outbound logistics, and green marketing and reverse logistics. For this study, a CLSM encompasses the tenets of sustainability with more focus on circle economies under the umbrella of circular economy practices. Such practices depict a loop in the supply chain, depicting the cycle economy with a symbiotic relationship where waste is treated as value, and the design of supply chains depicts the longevity of materials within the system to close the loop and optimize the loops for the resilient sustainability of supply chains. This study has captured this under design for the environment, green procurement, cleaner production, green logistics, reverse logistics and internal environment management (IEM as a moderator) with unique and context-specific practices towards designing resilient, sustainable supply chains.
2.3. Closed-Loop Supply Chain Models Considering Circular Economy and resilient sustainability
According to Karimi and Rahim (Citation2015), stakeholder theory emphasizes that organizations will consider other enterprises’ activities and strategies in coming up with institutional practices. Furthermore, a firm has much to gain through integrating multiple stakeholders (both primary and secondary) in its decision-making (Awan et al., Citation2018). In that regard, Castillo et al. (Citation2018) assert that enterprises need to look into the input of a large percentage of their stakeholders for making decisions. In the case of promoting resilience and sustainability of supply chains through CLSMs, it is prudent for the different parties of a supply chain regarded as stakeholders to be included in the decision-making of adopting green initiatives in the different stages of a supply chain. This is vital because if one stage fails the system, then the performance of CLSMs will be in vain. In addition, it is also crucial for the different organizations of a supply chain to manage and mitigate risks at their point of occurrence for a resilient supply chain, resulting in a sustainable supply chain.
Holman et al. (Citation2018) argue that systems thinking theory is the new norm for sustainability supply chain and logistics management. Holman et al. (Citation2018) argue about the need to move from traditional systems thinking to modern reductionist systems thinking. Traditional reductionist systems look at a system as a contribution from individual parts. However, Holmann et al. argue that modern reductionism systems thinking looks at a system as the totality of its items and whose interactions result in a system objective whose extra features maximize performance beyond the contribution of individual components. With such comprehension, systems thinking captures the tenets of collaborative efforts in supply chains toward implementing CLSMs for a whole supply chain system to become resiliently sustainable. Ahlstrom et al. (Citation2020) assert that the interdependence between firms and the planet is significant towards sustainable management. To that effect, creating a symbiotic relationship between supply chain firms and the natural biosphere through the embedment of CLSMs enhances the road map toward resilient sustainability.
According to Spaargaren (Citation2000), ecological modernization theory rests on the tenet of an environmental problem being a real issue that needs solutions. This theory further examines equilibrium for a sustainable system’s ecological well-being and economic progression. In the context of this study, this theory underpins the study in the sense that building a sustainable, resilient system results from the rising cases of anthropogenic SC activities that have depressed the environment, leading to environmental degradation. To find a balance between social, environmental and economic sustainability for the reversal of harm caused to the environment, ecological modernization theory tends to look into issues of modern society through the provision of sustainable solutions such as CLSMs for sustainable communities. CLSMs are continually gaining traction as an essential practice to achieve resilience and sustainability of supply chains. Extant literature also continues to demonstrate the link between CLSMs and the resilient sustainability of supply chains.
For instance, Dubey et al. (Citation2015) argue that green procurement has massive benefits for supply chains and business operations. Dubey et al. (Citation2015) highlight cost reductions and environmental performance benefits. Also, before practising green procurement, supply chains need to embrace the culture of design for the environment towards achieving resiliently sustainable supply chains. According to Mitra and Datta (Citation2014), while green purchasing may reduce pollution at source, there is no evidence of it leading to enhanced economic performance. Susan et al. (Citation2013) highlight inconclusive findings on green supply chains and performance. Rasit et al. (Citation2019) highlight the importance of design for the environment and green procurement as practices that lead to improved sustainable performance. While both green procurement and design for the environment are argued to enhance sustainability performance, very few studies combine the two practices towards the achievement of sustainable performance and, by extension, resilience.
According to Rao and Holt (Citation2005), cleaner production catalyzes competitive advantage but has no apparent relationship to enhancing economic performance. Cankaya and Sezen (Citation2019) argue that adopting cleaner production processes can lower an organization’s costs. Zhu and Sarkis (Citation2004) also argue about the benefits of practising cleaner production towards both social and environmental performance. Previous studies have focused solely on adopting cleaner production for sustainable performance without incorporating resilience as a significant pre-condition to achieving sustainable performance. Also, prior studies include the lean concept of the green philosophy, such as the Japanese 5S approach and total productive maintenance that essentially contribute to social, environmental, economic and resilient sustainability. Besides, prior studies are seen to provide contrasting findings on this subject. Green logistics entailing (green transportation, packaging and warehousing) has been shown to improve the competitiveness of firms but with inconclusive findings on improving financial performance (Rao & Holt, Citation2005). Rao and Holt (Citation2005) further argue that several studies have presented positive relationships between green logistics and sustainable performance, while others have presented mixed findings, such as no relationship between green logistics and sustainable performance.
Vienažindiene et al. (Citation2021) posit that green logistics has a capacity for organizations and their supply chains to achieve sustainable performance from the triple bottom line. Looking into these past scholarly debates, it is notable that the findings have mixed results and thus need further investigation. Also, it is notable that prior literature has concentrated more on economic and environmental performance and minimal focus on achieving resilience. Binalla and Mate (Citation2022) stress the importance of reverse logistics in handling sustainability challenges. Alnoor et al. (Citation2019) discovered a positive relationship between reverse logistics and sustainable manufacturing. Sarkis et al. (Citation2010) posit that establishing return processes like reusable containers may give businesses many benefits, such as stapling elimination, pallet use, and cutting of boxes, which generally cause injuries to people.
Gligor & Holcomb (Citation2012) argue that integrated logistical capabilities can lead to agile resilience. In support, Mandal et al. (Citation2017) posit that integrated logistical capabilities are positively associated with SC resilience. Notably, very few studies look into reverse logistics and social sustainability, reverse logistics and SC resilience, and a mixture of findings on reverse logistics on environmental and economic performance.
According to Feng et al. (Citation2022), IEM, such as customer cooperation, positively moderates the relationship between GSCs and competitiveness. Also, Dubey et al. (Citation2021) argue that sustainable supply chains could enhance sustainable performance through environmental SC visibility. This could be through customers and suppliers. Extant literature shows minimal evidence of the role of collaboration as a capability from an IEM perspective towards sustainable performance. Besides, there is no trace of IEM in the relationship between CLSMs and resilience. Based on the above debates, it is notable that there is a contrast of findings between green and closed-loop supply chains and sustainability performance. Furthermore, a direct link between closed-loop supply models and the resilient sustainability of supply chains is minimally seen across extant literature. Under such circumstances, then, it is evident that there are still gaps in this area, which leads to the development of the following hypotheses:
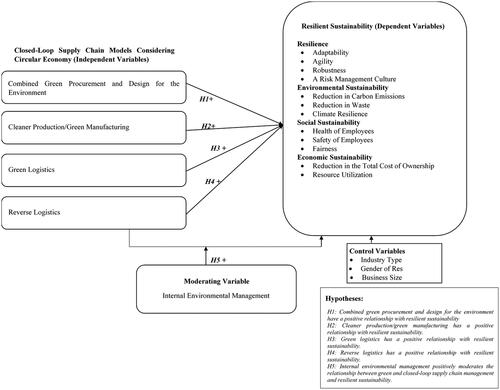
H1: Combined green procurement and design for the environment influences on resilient sustainability.
H2: Cleaner production influences resilient sustainability
H3: Green logistics influences resilient sustainability.
H4: Reverse logistics influences resilient sustainability.
H5: Internal environmental management influences the relationship between closed-loop supply models and resilient sustainability.
shows the conceptual model depicting the hypotheses guiding the study.
Figure 1. Conceptual model.
3. Methodology
The primary objective of this study was to investigate the influence of CLSMs on the resilience and sustainability of SCs for manufacturing businesses in a Sub-Saharan African context with a bias to Kenya. In response to this objective, this study adopted an explanatory research paradigm, quantitative in nature, utilizing the survey methodology. This approach was critical to get views from supply chain stakeholders informed by extant literature. Primary data was mined from supply chain line managers within the chemicals, construction, cosmetics, energy, food and beverage, and pharmaceutical businesses in Kenya’s Nairobi industrial zone. This section is organized into three parts. Section 3.1 provides discussions on the sample used and the data collection methodology. Section 3.2 discusses the measurement and variable definition delineating the survey instrument used in collecting data. Section 3.3 discusses how the collected data was analyzed, informing the results depicted in section four.
3.1. Sample and data collection
The data collection methodology followed multi-stage and judgmental sampling of the manufacturing businesses using the Kenya Association of Manufacturers directory. Out of the targeted 329 manufacturing businesses practicing any form of sustainability, were in pure production, existed during the study period and had at least operated for one year, 159 businesses were considered for this study having met the inclusion criteria depicted above. This study used primary data collected through online and physical questionnaires; and website exploration. Google Forms were particularly used to facilitate online data collection. The researcher and trained data enumerators distributed the physical questionnaires. This was particularly useful in areas where the researcher did not find registered businesses, necessitating deploying individuals knowledgeable about given jurisdictions. The questionnaires were distributed in eight months, denoting the sensitivity of sustainability studies in Sub-Saharan contexts. The data collected was evaluated for discrepancies and for a need to segment the data based on the collection periods. However, the evaluation showed consistent responses; thus, no time frame segment evaluation was conducted. The data collection was done during COVID-19, which could also explain the longer time to get data.
The Google forms were distributed through email, WhatsApp, LinkedIn and Facebook. Out of the 159 manufacturing businesses, 100 useful responses were obtained that were used for the analysis of this study and results presented in section 4.
The 100 useful responses used in this study align with Hair (Citation2014) who argue about a valid sample size for conducting structural equation modelling and also as depicted by the results of G power. A structural equation model was used under the partial least Squares utilizing SMART PLS version 4. According to Vinzi et al. (Citation2010), PLS-SEM aims to estimate relationships among research constructs. PLS-SEM is a second-generation multivariate analysis technique that handles relationships among constructs without data distribution assumption.
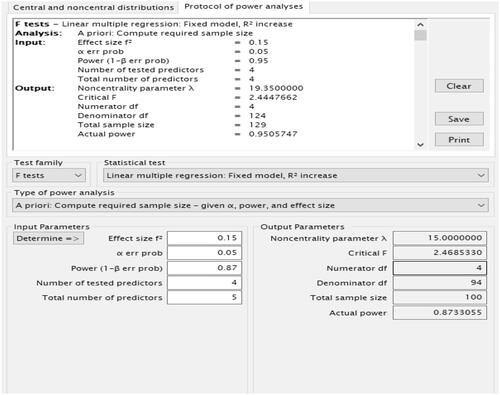
Wong (Citation2019) argues that PLS-SEM is an efficient statistical relationship technique that can be used when the sample sizes are small and the data is not normally distributed. Also, PLS-SEM is used when the research seeks to assess the predictive capability of research variables. PLS-SEM literature argues for a minimum sample size based on the number of arrows pointing to a latent variable and thus calls for proper estimation for significant statistical power. G* power 3.1.9.4 was used to determine the sample size given four main and five total predictors for the research model. The sample size estimation was calculated based on Cohen (Citation1988) and Hair (Citation2014) based on the effect size, statistical power, minimum coefficient determination (R2) used in the model and the maximum number of arrows pointing to a latent variable. Cohen (Citation1988) and Hair (Citation2014) argue that a good statistical power sits at 0.8 under the effect size of 0.15, an error of probability of 1-0.05 and a beta value (alpha less) of 0.95. For four predictors (4) and five total predictors (5), the sample size was estimated through an F-test under multiple linear regressions (of which PLS-SEM imitates) of fixed model R2 increase.
This was done through a three-level G-power test. First, a G-power test was conducted under statistical power of 0.95 as the highest possible statistical power which reflected an appropriate sample size of 129 observations. Second, a G-power test was conducted under the threshold statistical power of 0.8 which yielded a sample size of 85 observations. For robustness check, amid level G-power test was conducted under statistical power of 0.87 (0.95 + 0.80/2) which yielded a sample size of 100 observations which was used for this study. Hoyle (1995) argues that good sample estimations should range between 100 and 200 for statistical significance. shows the G power test results.
Figure 2. G power estimates.
3.2. Questionnaire development, measurement and variable definition
The survey instrument measured the respondent’s views regarding the study’s constructs. The indicators defining constructs were measured using a 6-point Likert scale (1 = strongly disagree, 2 = disagree, 3 = slightly disagree, 4 = slightly agree, 5 = agree, 6 = strongly agree). This particular Likert scale was employed to eliminate the error of central tendency. Green and Rao (Citation1970) state that a six-point and 7-point Likert scale increases information retrieval. This study utilized 83 measurement items: 17 for resilient sustainability, 63 for CLSMs, and three for IEM. The 17 factors relate to resilient sustainability, resilience with nine factors, environmental sustainability with three factors, economic sustainability with two factors and social sustainability with three factors. The 63 factors relate to CLSMs, green design (9), green procurement (7), green manufacturing (17), green logistics (22) and reverse logistics (8), and the three factors relating to IEM. shows the details of the measurement items.
3.3. Data analysis
3.3.1. PLS-SEM overview
Structural equation modelling under the partial least Squares was utilized to analyze the data. SMART-PLS version 4 was used. Covariance-based Structural Equation Modelling (CBSEM) has been a method of choice for a longer time in data analysis using second generation multi-variate analysis (Hair et al., Citation2021). However, PLS-SEM has also gained popularity in various disciplines, such as marketing and management information systems and larger business management (Hair, Citation2014). PLS-SEM looks into the prediction of research variables by constructing both measurement and structural models and, as such, can handle complex models (Hair, Citation2014). Compared to CBSEM, PLS-SEM has the advantage of conducting predictive capability better (Hair, Citation2014). Besides, PLS-SEM handles non-normal data better than CBSEM. From a softer modelling perspective, PLS-SEM has also been argued to manage smaller sample sizes better with better predictive power than CBSEM. For those reasons, this study utilizes PLS-SEM based on *Data records = 100 data points** predicting the effect of CLSMs on the resilience and sustainability of SCs*. In addition, PLS-SEM has a higher capability for testing the magnitude of moderation effects and effects between multi-group comparisons (Qureshi & Campeau, Citation2009). Based on this thorough justification for PLS-SEM usage coupled with the sample size estimation for PLS-SEM, it is then statistically authentic to conduct a PLS-SEM analysis. Before the PLS-SEM analysis report, it is right first to present the comparison model taxonomy to interpret PLS-SEM results. According to Hair (Citation2014; Ringle et al., Citation2015), PLS-SEM analysis and reporting is threefold; model specifications, measurement model (outer) and structural model (inner) analysis and reporting. shows the PLS-SEM measurement model interpretation.
On an outer (measurement) model thereof, of most importance (Hair, Citation2014) is the assessment of; the *Nature of the model (reflective or formative or a combination) = Model specification *. *Indicator reliability*. *Internal consistency reliability*.*Convergent validity*. *Discriminant validity*. The model’s nature (reflective or formative or a combination) is argued to inform the direction of analysis. A reflective measurement scale denotes a scenario where indicators are highly correlated and interchangeable (Hair et al., Citation2013) without change of meaning. Wong (Citation2019) argues that in a reflective model, each of the tetrads should be zero, and as such, if any of the tetrads deviate from zero, the model is formative. CTA-PLS looks into testing the hypothesis (Wong, Citation2019) of the nature: H0:t = 0 (Reflective); Ha:t ≠ 0 (Formative). presents diagrammatic representations when the model is either reflective or formative.
Figure 3. Confirmatory tetrad analysis interpretation (Wong, Citation2019).

3.3.2. PLS-SEM research model
According to Hair et al. (Citation2019), interpreting the measurement model calls for the assessment of (Loadings, Cronbach alpha, Composite Reliability, PA, AVE and HTMT). To check for robustness, Hair et al. (Citation2019) points out the need to conduct a CTA-PLS.
3.3.3. PLS-SEM measurement model, indicator loadings
Based on and , majority of constructs attained the threshold indicator reliability as per the outer loadings. Hair et al. (Citation2021) argues that indicators with lower loadings than 0.4 should be eliminated from the model. For this study, all indicators achieved internal reliability except for a few that were under 0.708 but still argued to be included to avoid model misrepresentation.
Figure 4. Research model- PLS-SEM graphical output (with moderator).
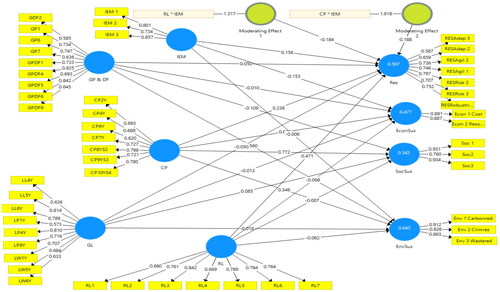
Table 4. PLS-SEM measurement model, indicator loadings.
3.3.4. PLS-SEM measurement model, internal consistency reliability (Cronbach alpha, rho-a & rho-c)
Hair et al. (Citation2011) state that composite reliability should be between 0.7 and 0.9. However, for exploratory research, values of 0.6 are acceptable as a minimum (Hair et al., Citation2019). Also, Hair et al. (Citation2019) argue that values above 0.90 may cause redundancy issues. However, values above 0.90 are acceptable for single indicator constructs since PLS-SEM does not have problems with single indicator constructs. However, researchers should carefully use single-construct items to avoid reliability issues. shows the internal consistency reliability for this study. In the arguments of Hair et al. (Citation2014, Citation2021), Cronbach’s alpha is not an effective measure in assessing internal consistency reliability. The model achieved internal consistency reliability by looking at the rho-A and composite reliability. For composite reliability, all values are within range and have not exceeded 0.95. For rho-A, all values are within the range of 0.8 and 0.9.
Table 5. PLS-SEM measurement model-internal consistency reliability.
3.3.5. PLS-SEM measurement model: convergent validity (AVE)
Hair et al. (Citation2019) argue that convergent validity is measured by average extracted variance (AVE) which is supposed to be equal to or greater than 0.5. shows the AVE with all values above 0.5 supported.
Table 6. PLS-SEM measurement model-convergent validity, AVE.
3.3.6. PLS-SEM measurement model, discriminant validity
Discriminant validity is normally assessed through fornell-larcker, cross-loadings and heterotrait-monotrait (HTMT) ratio. Radomir and Moisescu (Citation2019) argue that fornell-larcker criterion is not a reliable measure of discriminant validity due to its inability to detect discriminant validity when indicator loads only have a slight difference (0.65-0.85). As such, the HTMT has been proposed as the best measure for testing discriminant validity (Henseler et al., Citation2015). Hair et al. (Citation2019) posit that discriminant validity is best assessed through the HTMT values, which should be less than 0.90 for conceptually similar constructs and less than 0.85 for conceptually different constructs. HTMT values have been argued to range from 0 to 1, and while values close to zero are suspect, HTMT values should not be greater than 1. shows the HTMT values where all HTMT values are supported, below 1, indicating no discriminant validity issues.
Table 7. PLS-SEM measurement model, discriminant validity.
4. Results
4.1. Demographic characteristics
Demographic characteristics are presented in .
Table 8. Demographic characteristics.
4.2. PLS-SEM structural model
4.3. PLS-SEM structural model-collinearity assessment
Hair et al. (Citation2011) argue that collinearity assessment is measured using VIF values that should not exceed 5. Values greater than 5 indicate potential issues of collinearity. shows the outer VIF.
Table 9. PLS-SEM structural model, collinearity assessment using outer VIF.
4.4. PLS-SEM structural model-R square
Hair (Citation2014) argues about the threshold values of R-square to be 0.25,0.50 and 0.75 as weak, moderate and substantial respectively. For this study, an R- square values fall between the ranges of moderate and substantial. All R square values in are supported.
Table 10. PLS-SEM structural model, R square and adjusted R square values.
4.5. PLS-SEM structural model-F square
According to Hair et al. (Citation2019), f square values should be 0.02, 0.15 and 0.35 (considered weak, moderate and large respectively) ().
Table 11. PLS-SEM structural model, F square values.
4.6. PLS-SEM structural model-path coefficients (bootstrap, 10,000 samples)
According to Kock & Hadaya (Citation2018), estimating path coefficients is a very important element toward hypothesis testing for empirical investigations. Kock further argues that path coefficient estimation is the basis for hypothesis testing in PLS-SEM. Besides, path coefficient estimations look into two approaches (use of p-values and use of confidence intervals) for hypothesis testing. For P-values, the threshold is 0.05 where any value less that 0.05 is supported toward rejecting a null hypothesis. On the other hand, confidence interval values are interpreted on the basis that if zero does not fall within the intervals then the hypothesis is supported (Kock & Hadaya, Citation2018).
Both P-values and confidence interval results show similar results and either can be used. For this study, a bootstrap of 10,000 samples was run and the t-statistics show that significance effect of CLSMs on resilient sustainability. shows supported path coefficients through their t-statistics and p values which have been highlighted.
Table 12. PLS-SEM structural model, path coefficient values.
4.7. PLS-SEM structural model-Q square
According to Hair et al. (Citation2019), the Q square shows the models capability to predict. This is normally assessed through running a blind fold or conduct a PLS-predict and values below zero indicate that the model’s predictive power is weak. In recent literature, blind folding has been argued not to provide out of sample predictive power and as such, an alternative of PLS-predictive has been suggested (Hair et al., Citation2021). shows Q square values through PLS-predict. When the Q square value is greater than zero, the model has a higher predictive power even for out of sample assessments (PLS-predict).
Table 13. PLS-SEM structural model, Q square (PLS-Predict, 10 folds, 10 repetitions): LV prediction summary.
4.8. Robust checks: measurement model, confirmatory tetrad analysis
According to Wong (Citation2019), confirmatory tetrad analysis (CTA-PLS) is important to ensure model specification. For SMART PLS 3, Wong (Citation2019) argues that, the software has a capability to reflect a reflective model and calls for the researcher to change arrows in case of a formative model. CTA-PLS can be used to specify the nature of the model. Also, Wong (Citation2019) posit that researchers should be careful since the CTA-PLS can only accurately specify the model when variables have more than 3 or 4 indicators. On the other hand, Bollen and Ting (Citation2000) argue that CTA-PLS can also be used in more or less than four indicators.
In instances where the indicators are less than 3, Wong (Citation2019) recommends the use of theoretical reasoning for model specificity while Bollen and Ting (Citation2000) posit that there is no error in the model specificity with less than four or three indicators. According to Wong (Citation2013), model specifications is based on the nature of relationship among indicators feeding a variable. This means that if the indicators are highly related and interchangeable, then it’s a reflective model, otherwise a formative model (Wong, Citation2019). For this study, both theoretical reasoning and CTA-PLS have been used and the results run through 19,000 bootstrap samples. All values reflected a reflective model since the low adjusted values and up adjusted values fall between the ranges of 0 as tetrads.
4.9. Robust checks: structural model, non-linear effects
According to Sarstedt et al. (Citation2020), normally researchers assume a linear effect when testing the relationship among variables in PLS-SEM. However, it’s not always the case that the nature of the relationship is linear. In fact, PLS-Sem researchers have rarely looked into nonlinear effects (Sarstedt et al., Citation2020). Given then that relationships are not always linear, it is important to check for non-linearity to avoid reporting misleading results. Sarstedt et al. (Citation2020) argues that non-linear effects for PLS-SEM can be tested through RAMSEYS 1969 regression equation specification error test (RESET). According to Sarstedt et al. (Citation2020), the RAMSEY RESET test in PLS-SEM is conducted by first running the PLS-SEM model and using its construct model scores to run the RAMSEYS RESET test in standard software packages such as STATA and SPSS. The results of a RAMSEY RESET test indicate non-linearity if the specification of non-linearity is significant. On the other hand, researchers could test for quadratic effects where if the quadratic effect is significant then non-linearity is detected otherwise the nature of the relationship among constructs is linear in nature (Sarstedt et al., Citation2020; Ringle et al., Citation2019). This means that, researchers could check significance of the effect size. If it is significant, then non-linearity is detected, otherwise the robustness of linearity has been achieved. In addition, Wong (Citation2019) argues that, researchers should check for both significance and effect size to determine any presence of non-linearity in the model. For this study thereof non-linearity has been tested through quadratic effects conducted in SMART-PLS version 3.3.7.
It is notable that, all the F square and path coefficient results for quadratic effects is non-significant where all p values and T statistics for path coefficients are non-significant reflecting the robustness of the model as a linear model without any non-linear effects. The Quadratic effect was run through endogenous variables against the independent variables through 10,000 bootstrap samples. This leads to the rejection of the null hypothesis that CLSMs and resilient sustainability has significant non-linear, quadratic effect.
4.10. Robust checks: structural model, endogeneity
Bascle (Citation2008) argues that endogeneity is as a result of a predictor construct has a correlation with the error term of the dependent variable that its related with. Failure to test and control for endogeneity may lead to misleading results. Woodridge (2003) stresses that endogeneity is caused by three factors; omitted variables, simultaneity and sample selection bias. Simultaneity or reverse causality happens when the predictor variable influences the response variable and at the same time the response variable influences the predictor variable (Jean et al., Citation2016). Sample selection bias is as a result of not grouping samples randomly (Jean et al., Citation2016). Hair et al. (Citation2019) argues about three steps to test for endogeneity and address it. First, researchers should begin by first checking if it is necessary to test for endogeneity by assessing the purpose for their model (explanatory or predictive). For predictive models, Hair et al. (Citation2019) contends that there is no need to test for endogeneity. Second, Hair et al. (Citation2019) argues that researchers should check the possibility of adding control variables to address endogeneity and thirdly perform Gaussian copula test for endogeneity which if significant, researchers should proceed to treat endogeneity by first assessing the root cause of the endogeneity. For this study, the researcher first assessed the nature of the model which is both explanatory and predictive oriented and as such need to test and address endogeneity. Second, the researcher did a thorough investigation in literature to understand commonly considered control variables in this area such as industry type for mixed studies, business size and gender to control for any hidden endogeneity. Thirdly, the researcher performed Gaussian Copula test using Smart PLS 4. The Gaussian Copula results indicate no endogeneity issues both from the path coefficients and F Square.
4.11. Robust checks: structural model, unobserved heterogeneity
Sarstedt et al. (Citation2020) argue that unobserved heterogeneity is as a result of the existence of different data groups which yield different model estimates. In such circumstances, estimating the entire group without considering unobserved heterogeneity may lead to misleading results. In testing and controlling for unobserved heterogeneity, Sarstedt et al. (Citation2020) argue that researchers need to run finite mixture-PLS to test for unobserved heterogeneity. FIMIX-PLS normally shows absence of unobserved heterogeneity if results point to a one segment solution or divergent results (Sarstedt et al., Citation2020). On the other hand, if results show significant heterogeneity, then researchers are advised to control it by running PLS prediction oriented segmentation. As a first step, this study ran the FIMIX-PLS under the following steps:
Assess the minimum sample size through G-Power= 85
Determine the study’s actual sample size = 100
Divide the study’s actual sample size by the minimum sample size to obtain number of segments = 100/85 = 1.1764. Once the number of segments has been attained which in this case could range between one and two, then one runs the FIMIX-PLS a number of times depending with the segments then analyzes the results through the fit indices.
5. Discussion
To respond to the main research question (is it practical to uphold both resilience and sustainability of supply chains through closed-loop supply chain models considering circular economy for manufacturing businesses in Kenya), this study evaluates the R square results that seek to measure the predictive accuracy of a model through the thresholds of 0.75, 0.50 and 0.25 as substantial, moderate and weak respectively (Hair, Citation2014). For this study, the R squares of the four endogenous variables depicting dimensions of resilient sustainability sit between moderate and substantial (resilience, R square = 0.507; economic sustainability, R square = 0.477; environmental sustainability, R square = 0.645 and social sustainability, R square = 0.542). Environmental sustainability exhibits a higher predictive power, followed by social, resilience and economic sustainability.
In general, the model shows predictive accuracy with precision averaging at moderate. In addition, Hair et al. (Citation2019) posit that to understand the predictive relevance of the model, researchers need to conduct blindfolding and PLS prediction. In smart PLS version 3, researchers have provisions to conduct blindfolding. However, blindfolding cannot assess out-of-sample predictive relevance (Hair et al., Citation2019). For this reason, PLS-predict was added to smart PLS 4 to evaluate both predictive relevance in and out of the sample.
For both techniques, it is argued that a good model with better precision in predictive relevance has Q2 values greater than zero. For this study, all endogenous constructs exhibited a higher predictive relevance through PLS-predict (economic sustainability, Q2=0.405, environmental sustainability, Q2=0.572, resilience, Q2 =0.391 and social sustainability, Q2 =0.498). Also, the blindfolding test depicts higher predictive relevance since all constructs exhibited Q2 values greater than zero. Negri et al. (Citation2021) argue that the convergence of resilience and sustainability is still in its infancy, and the interactions are poorly addressed. Such reasoning opened up the investigation of the relationship between CLSMs and the resilient sustainability of supply chains. Hypothesizing CLSMs and resilient sustainability of supply chains into four hypotheses and 16 sub-hypotheses, it is notable that the four hypotheses are significant on path coefficients and 4 hypotheses significant on the effect size.
Green manufacturing/Cleaner production proves to be the strongest CLSM showing significance on economic (F = 0.496, T = 1.858, P = 0.032) and social sustainability (F = 0.547, T = 2.014, P = 0.022) on effect size and social (β = 0.772, T = 6.033, P = 0.000), economic (β = 0.822, T = 6.238, P = 0.000) and environmental (β = 0.346, T = 2.476, P = 0.000) sustainability on path coefficients. Reverse logistics (F = 0.257, T = 1.880, P = 0.030) and combined green procurement and design for the environment (F = 0.272, T = 1.777, P = 0.038) show significance on resilience and economic sustainability, respectively. Interestingly, none of the CLSMs showed significant results on environmental sustainability. This means that more needs to be done towards environmental sustainability. However, such results could be explained by the long-term effect of CLSMs that might influence environmental sustainability. It is encouraging that the supply chain focal point is the strongest practice showing higher chances of supply chains enhancing their sustainability and resilience.
According to the study of Cankaya and Sezen (Citation2019), green supply chain management showed significant effects on environmental sustainability with not-so-positive results on social and economic sustainability, which contradicts the findings of this present study where CLSMs showed significance on social sustainability, economic sustainability and resilience with no significance effect on environmental sustainability. Notably, debates on CLSMs and resilient sustainability based on the findings of this present study and those of prior scholars provide a link to theoretical underpinnings on ecological modernization theory that calls for sustainable solutions to revive an ecological crisis, the systems thinking theory on conceptualizing supply chains as systems rather than individual parts and the stakeholder theory in terms of harnessing the power of the different supply chain partners to enhance resilience and sustainability of supply chains through CLSMs.
5.1. Combined green procurement and design for the environment on resilient sustainability
The findings of this study show that combined green procurement and design for the environment only affect economic sustainability with no relationship to social sustainability, environmental sustainability and resilience. Cankaya and Sezen (Citation2019) report similar findings where they found green purchasing to affect corporate sustainability. Cankaya and Sezen (Citation2019) argue that such results could be influenced by the fact that green purchasing is an external practice and that no one stakeholder has full control of its practice. Nevertheless, through collaboration and stringent policies, manufacturing businesses can engage effectively with suppliers towards low-carbon procurement. In the study of Jermsittiparsert et al. (Citation2020), green procurement positively affected sustainable performance.
These findings agree with this study where combined green procurement and design for the environment affected economic sustainability and at the same time, disagree where green procurement and design for the environment did not influence environmental and social sustainability. Negri et al. (Citation2021) report that green purchasing improved environmental and social performance with reduced risk disruptions. This is contrary to the findings of this study, where green procurement combined with design for the environment only influenced economic sustainability without a trace of its effect on social, environmental, and resilience dimensions. From a different perspective, the study of Negri et al. (Citation2021) noted that green procurement, particularly on local sourcing, improved economic performance by reducing costs, which agrees with this study’s findings.
In disagreement, Green et al. (Citation2012) found no relationship between local sourcing as a measure of green procurement and sustainability. This points out contrasts in the literature on the true measure of green procurement and resilient sustainability. Also, the study of Negri et al. (Citation2021) posits that design for the environment enhances sustainability from the triple bottom line. This was realized in some firms and not in others. Design for the environment, which was combined with green procurement, proved beneficial for economic sustainability in this study from the perspective of reducing costs and utilizing resources. In agreement, Zhu and Sarkis (Citation2004) also found eco-design to be a good contributor to economic sustainability. In addition, the study of Namagembe et al. (Citation2019) found that green procurement had a positive effect on economic sustainability. Design for the environment was equally a good enabler for risk disruptions in the study of Negri et al. (Citation2021).
5.2. Cleaner production on resilient sustainability
In agreement with Cankaya and Sezen (Citation2019), this study found cleaner production not to be affecting environmental sustainability but to be affecting social sustainability. Also, cleaner production through lean practices was found to be influencing the sustainability of SME manufacturing as per the study by Dey et al. (Citation2019). In this current study, cleaner production had elements of lean manufacturing that anchored total productive maintenance. Notably, the Japanese 5S approach was influential in enhancing social and economic sustainability for this current study. What this means, then, is that there is a dire need to redefine cleaner production and inculcate aspects of lean manufacturing into cleaner production. Looking at the two, they are both pegged on waste reduction amid their other objectives. Cleaner production sits at the focal of supply chains. While it is encouraging to see cleaner production influence social and economic sustainability, there is reason to develop a cleaner production framework that comprehensively contributes to both resilience and sustainability. It is also worth noting the need to develop cleaner production centres in the Sub-Sahara and other world regions to encourage and promote cleaner production as the centrality of sustainable supply chains. It would be interesting to see synergies between the government and private sector in promoting and fostering responsible production. Looking at the Sub-Saharan African context used in this study, it is encouraging to see the industrial clusters and parks as a path to enhancing manufacturing.
However, aligning the industrial parks and clusters to different cleaner production centres to build cleaner manufacturing in the sub-Sahara would be important. Of importance to note is the heavy dependence of manufacturing firms in this region on the natural resource endowments evidenced by sectors with an orientation to agriculture as the ones with a bigger share of manufacturing. What is surprising is the heavy reliance on international sourcing, particularly in China and Asia, with no clear laws towards forensics on the scope of these regions’ responsibility to sustainability.
5.3. Green logistics on resilient sustainability
The results of green logistics as a CLSMs practice reveal transportation and its management, packaging and warehousing as important elements to achieving resilient sustainability in four dimensions (economic, environmental, social, and resilience). The results of this study indicate insignificant results on green logistics towards enhancing resilient sustainability in its four dimensions. Checking on the significance, green logistics did not show any significance based on the path coefficients and their p-values (GL-economic sustainability = 0.458, GL-environmental sustainability= 0.442, GL-resilience = 0.32 and GL-social sustainability = 0.183). In addition, green logistics exhibited a too-small effect size (its meaningful relationship with the endogenous variables through the F test (p values); GL-economic sustainability= 0.497, GL-environmental sustainability = 0.463, GL-resilience= 0.408 and GL- social sustainability = 0.360; against the threshold p-value of 0.05 at 95% confidence interval. From a predictive relevance perspective, green logistics exhibited a valid predictive relevance for the endogenous variables from a blindfolding and pls-predict perspective where the Q2 was above zero, indicating higher predictive relevance. The results of this study, then, from a green logistics perspective, disagree with the results of Trivellas et al. (Citation2020), which positively affected sustainability performance.
However, Trivellas et al.’s (Citation2020) study did not have a resilient component and had a different measurement model for green logistics, including the collaboration aspect. It can be argued that collaboration could have influenced the results of green logistics to enhance its positive effect on sustainable performance. This discovery calls for comparative studies on green logistics and sustainable performance and green logistics and collaboration and sustainability performance.
It is also notable that the findings of this study are different from those of Trivellas et al. (Citation2020) due to the novel path of treating resilience as a pre-cursor of sustainability in this study, which still calls for comparative studies to assess the efficacy of the models with and without resilience. Green logistics in this study entailed transportation and its management, green packaging and labelling, and green warehousing. According to Trivellas et al. (Citation2020), green packaging is a major arm of logistics, making it a critical determinant for achieving sustainability. Besides, transportation has a huge role in overall performance and hence, is a vital element in achieving logistical sustainability (Trivellas et al., Citation2020). Green warehousing is equally important through intelligent decisions for its locational choice that can inform the transportation distance towards lowering emissions.
The findings of this study disagree with those of Agyabeng-Mensah et al. (Citation2020) who argue that green logistics calls for newer practices such as logistics ecocentricity and supply chain traceability to enhance sustainable performance. This is because other prior studies have indicated negative and insignificant effects of green logistics and sustainability performance. Looking into this ideology, it is important to note the role of green logistics in building supply chain resilience. With the new quest of practices, it is vital to have resilience and sustainability in mind. What is surprising is the lack of established logistical systems for manufacturing businesses in a Sub-Saharan context hindering their full practice of green logistics towards resilient sustainability. It is also realized that the infrastructures in this context partially support enabling green logistics. Also, Jermsittiparsert et al. (Citation2020) present positive results on green logistics and sustainable performance. In support, the study of Negri et al. (Citation2022) realized a positive effect between green logistics and resilience and sustainability. It is evident then that prior literature has a contrasting effect with this study on the position of green logistics, which calls for more in-depth research to unfold areas of disparity.
5.4. Reverse logistics on resilient sustainability
According to Cankaya and Sezen (Citation2019) reverse logistics did not affect economic sustainability. This agrees with the findings of this study, where reverse logistics did not show any effect on sustainability dimensions. This concurs with the sentiments of Cankaya and Sezen (Citation2019) that emerging economies are less interested in reverse logistics. In addition, it could also be argued that the top and bottom line for businesses in developing economies is economic performance which could explain the lack of significance on reverse logistics and sustainability. Conversely, this study realized a positive result between reverse logistics and resilience.
5.5. IEM on the relationship between CLSMs and resilient sustainability of SCs
Notably, IEM from past studies influenced the relationship between green supply chains and sustainability. Such findings differ from the findings of this study, where IEM seems not to have a significant effect on the relationship between CLSMs and the resilient sustainability of supply chains. The change in R square for IEM was only exhibited in resilience by 0.038, which is negligible, indicating that IEM does not affect much the strength of the relationship between CLSMs and resilient sustainability. IEM on reverse logistics and resilience (F = 0.055, T = 1.162, P = .0.123) and IEM on cleaner production and resilience (F = 0.067, T = 0.976, P = 0.165) show no significant effect on the relationship between CLSMs and resilient sustainability. However, the significance of path coefficients was supported with p values on reverse logistics and resilience (P = 0.049) and cleaner production and resilience (P = 0.023). This showed that IEM can influence the relationship between CLSMs and resilient sustainability. In the findings of Arora et al. (Citation2020), an environmental collaboration that depicts IEM influences sustainable purchasing and performance for small firms but has a negative influence on bigger firms. These findings agree and disagree at the same time with the findings of this study.
The contrast in such results still call for more inquiry on IEM and its effect on the relationship between CLSMs and resilient sustainability. Accordingly, Chin et al. (Citation2015b) support that environmental collaboration influences the relationship between green supply chain and sustainability performance. The discussions on IEM and its effect on the relationship between CLSMs and resilient sustainability provide a connection to theoretical reasoning’s based on stakeholder, systems thinking and ecological modernization theories where the interconnections among supply chain partners are informed by perfect information sharing among these stakeholders leading to the building of strategic partnerships, confidence and trust on CLSMs uptake for the achievement of resilience and sustainability of supply chains.
5.6. An integrated resilient sustainability framework for this study
With a myriad of disruptive occurrences across the globe, a need for integrating resilience to sustainability becomes urgent now than ever. Sustainability conversations have always followed the traditional model anchored on the Brundtland report of 1987 toward people, planet and profits. However, achieving SD calls for efficient management of sustainability disruptions. Classical research has always presented resilience and sustainability as separate concepts. However, with modern challenges, combining resilience and sustainability presents an avenue of growing economies. Achour et al. (Citation2015) argue that resilient sustainability convergence has been delayed by a lack of motivation, awareness and resources by major decision makers. Achour et al. (Citation2015) further argue that, the available datasets and information across the globe can be utilized for seamless integration of resilience and sustainability. It is then noticed that the connection between the concepts of resilience and sustainability struggle is the most demanding issue confronting modern academicians, industry practitioners and researchers. It is notable that extant literature lacks established frameworks for such a convergent framework towards theory development. Marchese et al. (Citation2018) argue that resilience is a major pre-condition for sustainability. This means that when a system is more resilient it becomes more sustainable. However, increasing the sustainability of a system does not make it more resilient (Marchese et al., Citation2018). According to Ahern (2013), the comprehension of cities as dynamic and inherently fragile changes the understanding of sustainability and as such sustainability as a concept is confronted to develop resilience of cities.
Looking into the understanding of sustainability, Ahern (2013) asserts that such comprehension denies systems such as cities the capability to be adaptive to the changes that come. Ahern further documents disturbances that affect urban sustainability such as disease outbreaks, climate change and political revolution which then highlights that the sustainability of cities need to integrate resilience to deal with the dynamism that comes along in these systems. Blackmore and Plant (Citation2008) contend that the resilience of a system can massively impact on the sustainability of a system. This means that, all systems are inherently vulnerable to shocks and exposures propagated by risk disruptions. Then to build sustainability that is long lasting, the resilience integration to systems becomes important and urgent. Milman and Gianotti (Citation2008) present a resilient sustainability framework by incorporating resilience indicators to sustainability indicators. Looking into prior literature, much of the resilience and sustainability interconnections are founded on adding resilience indicators to sustainability indicators. Saidi et al. (Citation2021) posit that, studies on the integration of resilience and sustainability are minimal. This then points out the need to go way above conventional sustainable development frameworks to capture resilience as a major pre condition to sustainability. Besides, Saidi et al. (Citation2021) present a framework that combines resilience and sustainability through merging their building blocks.
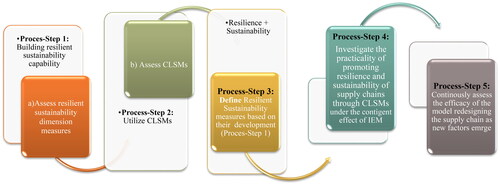
To that effect, borrowing from Colantonio (Citation2009), sustainable development has not grown fully in its conventional pillars of economic, social and environmental sustainability. The European Parliament (Citation2023) report posits that, there has been so much bias to the environmental and economic aspects of sustainability in the past. This has always brought about confusions on the integration of social sustainability to both economic and environmental pillars of sustainability. In this context then, SD in the Anthropocene epoch need to be looked at from a system perspective in which there is possibility of disturbances affecting the system and as such inculcate resilience as a major component of SD. This debate then opens up to the building of a resilient sustainable framework for this study taking the perspective of supply chains. Based on the above discussions, the building then of a resilient sustainable framework for this study is based on the preposition (resilience as a component or pre-cursor to achieving sustainability). Unpacking this preposition unfolds process steps for this study.
First, an investigation on the dimensions of resilient sustainability adopted by supply chains. Second, the investigation of CLSMs to build resilient sustainable economies is conducted. Third, defining of resilient sustainability from a measurement perspective informed by the building of resilient sustainability dimensions for adoption (revisiting process step 1). Fourth, the investigation of the relationship between CLSMs and resilient sustainability of supply chains under the contingent effect of internal environmental management. Fifth, continuously assess the efficacy of the model redesigning the supply chain as new factors emerge. depicts a pictorial representation on the integrated framework of resilient sustainability based CLSMs.
Figure 5. Integrated resilient sustainability framework based CLSMs (transitioning to the quadruple bottom line).
6. Conclusions
This study investigates the practicality of upholding resilience and sustainability of supply chains through CLSMs for manufacturing businesses in a Sub-Saharan African manufacturing context (Kenya), and presents an integrated framework of resilient sustainability. The results find that CLSMs on an overall scale strongly influences resilient sustainability and that trade offs seem more practical as economie work towards points of balance. Specifically, in the Kenyan context, cleaner production shows a double effect on economic and social sustainability, combined green procurement and design for the environment shows an effect on environmental sustainability and reverse logistics shows an effect on resilience. Green logistics shows no effect on resilient sustainability, CLSMs shows no effect on environmental sustainability and IEM shows no effect on the relationship between CLSMs and resilient sustainability. The findings of is study reveal that contexts such as Kenya which are emerging economies with few established supply chains may show low uptake of CLSMs in building their resilience and sustainability. However, Kenya being among agriculture dependent economies and having faced a myriad of disruptions, the the investigation of CLSMS becomes important as an avenue to boost the countrys sustainability and resilienceFor this present study, both contributions and implications from literature, practical and policy perspectives are provided.
6.1. Theoretical contributions
A research gap exists in prior scholarly literature with regards to the convergence of resilience and sustainability, and the direct link between CLSMs and resilient sustainability. Under such observations, this study provides theoretical contributions by extending from extant literature on the need for convergence between resilience and sustainability, and the need to directly measure the effect of CLSMs on resilient sustainability.
6.2. Implications for practice
Given the importance of CLSMs in upholding resilience and sustainability of supply chains, actors in the supply chain ecosystem must seriously consider using CLSMs. Some of the CLSMs are cleaner production based lean manufacturing models such as the Japanese 5S approach which are more promising in achieving resilient sustainability than conventional production models. Also, most businesses in Sub-Saharan African contexts like manufacturing businesses in Kenya lack the implementation strategy of CLSMs despite clear guidelines stipulated in ACTS of Parliament. Provision of a frame for resilient sustainability based CLSMs, especially for manufacturing businesses can aid such companies and other actors to promote resilience sustainability even with challenges that come with emerging economies. The government can provide support to such by making the guidelines stringent and through funding opportunities.
6.3. Implications for policy
The findings of this study open up loop holes for policy that there is need for laws and regulations to be stringent. It is also worth noting the regulators in this area in a Sub-Saharan African manufacturing context. To start with, the Ministry of Environment and Forestry, with affiliate laws such as the Sustainable Waste Management Act, Climate Change Act and Environmental Management Act, are provided with discussions that can inform policy. While the building of resilience has been captured in the Climate Change ACT of Kenya, 2016, the policies do not provide, for instance, clear guidelines on how to build resilience. Better still, this opens up the need for policymakers to consider careful sectoral mapping and assess priorities towards building resilient sustainability.
A first-line policy guideline to borrow from is the Kenya National Climate Change Action Plan of 2018-2022, which provides a clear road map on priority areas of climate change. Even though, manufacturing with regards to climate change adaptation and mitigation is seen at priority six. While it makes good societal sense, the proposed action plan is disadvantaged by the comprehension of the core role of manufacturing in nationalities. Looking into the big FOUR agenda put forth during presidents Kenyatta’s tenure, enhancing manufacturing takes priority and this is important to enable the Kenyan context not leap to pre-industrialization.
This study also provides insights to the government of Kenya and contexts in the Sub-Sahara through various ministries such as national treasury, environment and forestry, and trade and transportation to consider public-public and public-private partnerships towards comprehensive policies for resilient sustainability. It is also notable that concrete policies around this area call for multi-stakeholder collaborations and points of convergence for all affiliate ACTS of parliament, as well as stringent measures on their enactment. A major reason with bias to environmental occurrences is that Kenya and the larger Sub-Sahara continue to face massive climate-related disturbances such as the melting of glaciers such as those of Mt Kenya; Lake Victoria is in a highly deteriorating state, leading to a shortage of fish and depletion of the Mau forest to name a few. It is also worth noting that governments must support such actors through favorable policies like incentives to actors practising CLSMs.
6.4. Recommendations
This study recommends the following: (i) Conduct a hot spot analysis and mapping of priority CLSMs and their affiliate resilient dimensions. Truly, achieving points of balance seem unrealistic. However, economies can adopt trade-offs as they work towards points of balance. (ii) converging resilience and sustainability. (iii) for sustainability-related ACTS to be aligned with the agendas of national development. A more worthy recommendation would also touch on the need to establish cleaner production centres towards manufacturing and supply chain sustainability. Such centers would be initiated by the public and through partnerships with the private sector and knowledge centers. A clear line for such centers would be to take advantage of the Kenya’s model on special economic zones, more so the industrial park model.
This means that, every cluster of industrial park should be organized under a cleaner production center. As envisioned in the Kenya’s climate change ACT of 2016 about the integration of climate change to curricula, knowledge centers could be second line after the special economic zones and the government to provide cleaner production centers that are research based to offer advisory to those of the government and the private sector. Against the backdrop, this study is limited with a particular context in Sub-Saharan Africa necessitating further research on a wider scope of contexts in the Sub Sahara.
6.5. Study limitations and future directions
This study is not without limitations. First, the study is limited to manufacturing businesses registered by the Kenya Association of Manufacturers in the Nairobi industrial zone, which depicts that results could be different in other contexts. Second, the study is limited to collaboration as a moderator defining internal environmental management posing more inquiry for future studies to consider technology aspects, context specific variables as moderators. It will also be important to see the direct role that resilience capabilities play in achieving the sustainability of supply chains.
Disclosure statement
There is no potential interest among authors.
Data availability statement
The corresponding authors data supporting the findings of this study are available upon reasonable request.
Additional information
Funding
Notes on contributors
Mary Aming’a
Mary Amingá, MKISM, an advocate of the circular economy, a faculty member at the Strathmore University Business School, Nairobi. She is completing her Ph.D. in supply chain sustainability and resilience, focusing on green, closed-loop and circular economy supply approaches in a Sub-Saharan African Economy.
Reuben Marwanga
Prof. Reuben Marwanga is an Associate professor at the Strathmore University Business School, Nairobi, with expertise in industrial engineering. He holds a PhD in Industrial Engineering and is also involved in teaching, research, and consultancy in industrial engineering, technology, and supply chain.
Jonathan Annan
Prof. Jonathan Annan is an Associate Professor at Strathmore University Business School, Nairobi, with expertise in supply chain management and logistics. He holds a Ph.D. in Logistics and Supply Chain Management and has won awards for his research. Jonathan is also involved in teaching and consultancy in supply chain management.
References
- Achour, N., Pantzartzis, E., Pascale, F., & Price, A. D. F. (2015). Integration of resilience and sustainability: From theory to application. International Journal of Disaster Resilience in the Built Environment, 6(3), 1–31. https://doi.org/10.1108/IJDRBE-05-2013-0016
- Agyabeng-Mensah, Y., Afum, E., & Ahenkorah, E. (2020). Exploring financial performance and green logistics management practices: Examining the mediating influences of market, environmental and social performances. Journal of Cleaner Production, 258, 120613. https://doi.org/10.1016/j.jclepro.2020.120613
- Ahlström, H., Williams, A., & Vildåsen, S. S. (2020). Enhancing systems thinking in corporate sustainability through a transdisciplinary research process. Journal of Cleaner Production, 256, 120691. https://doi.org/10.1016/j.jclepro.2020.120691
- Alnoor, A., Eneizan, B., Makhamreh, H., & Rahoma, I. (2019). The effect of reverse logistics on sustainable manufacturing. 71–79.
- Arora, A., Arora, A. S., Sivakumar, K., & Burke, G. (2020). Strategic sustainable purchasing, environmental collaboration, and organizational sustainability performance: The moderating role of supply base size. Supply Chain Management, 25(6), 709–728. https://doi.org/10.1108/SCM-07-2019-0284
- Awan, U., Kraslawski, A., & Huiskonen, J. (2018). Governing interfirm relationships for social sustainability: The relationship between governance mechanisms, sustainable collaboration, and cultural intelligence. Sustainability, 10(12), 4473. https://doi.org/10.3390/su10124473
- Bascle, G. (2008). Controlling for endogeneity with instrumental variables in strategic management research. Strategic Organization, 6(3), 1–27. https://doi.org/10.1177/1476127008094339
- Beamon, B. (2005). Environmental and sustainability ethics in supply chain management. Science and Engineering Ethics, 11(2), 221–234. https://doi.org/10.1007/s11948-005-0043-y
- Binalla, A., & Mate, A. (2022). Reverse supply chain: A triple waste management approach. Journal of Positive School Psychology, 6(3), 2982–2991. http://journalppw.com2022
- Blackmore, J. M., & Plant, R. (2008). Risk and resilience to enhance sustainability with application to urban water systems. Journal of Water Resources Planning and Management, 134(3), 224–233. https://doi.org/10.1061/(ASCE)0733-9496(2008)134:3(224)
- Bollen, K. A., & Ting, K-f (2000). A tetrad test for causal indicators. Psychological Methods, 5(1), 3–22. https://doi.org/10.1037/1082-989X.5.1.3
- Çankaya, S. Y., & Sezen, B. (2019). Effects of green supply chain management practices on sustainability performance. Journal of Manufacturing Technology Management.
- Castillo, V. E., Mollenkopf, D. A., Bell, J. E., & Bozdogan, H. (2018). Supply chain integrity: A key to sustainable supply chain management. Journal of Business Logistics, 39(1), 38–56. https://doi.org/10.1111/jbl.12176
- Chen, J., Dimitrov, S., & Pun, H. (2019). The impact of government subsidy on supply chains’ sustainability innovation. Omega, 86, 42–58. https://doi.org/10.1016/j.omega.2018.06.012
- Chin, T. A., Tat, H. H., & Sulaiman, Z. (2015b). Green supply chain management, environmental collaboration and sustainability performance. Procedia CIRP, 26, 695–699. https://doi.org/10.1016/j.procir.2014.07.035
- Chin, T., Zuraidah, S., Tat, H., & Siti, Z. (2015a). Green supply chain management practices and sustainability performance. Advanced Science Letters, 21(5), 1359–1362. https://doi.org/10.1166/asl.2015.6029
- Christopher, M., & Peck, H. (2004). Building the resilient supply Chain. The International Journal of Logistics Management, 15(2), 1–14. https://doi.org/10.1108/09574090410700275
- Cohen, J. (1988). Statistical power analysis for the behavioral sciences (2nd ed.). Lawrence Erlbaum Associates, Publishers.
- Colantonio, A. (2009). Social sustainability: A review and critique of traditional versus emerging themes and assessment methods.
- De Backer, K., & Flaig, D. (2017). The future of global value chains: Business as usual or “a new normal”? In OECD Science, Technology and Industry Policy Papers, No. 41. Paris: OECD Publishing. https://doi.org/10.1787/d8da8760-en.
- Dey, P. K., Malesios, C., De, D., Chowdhury, S., & Abdelaziz, F. B. (2019). The impact of lean management practices and sustainably-oriented innovation on sustainability performance of small and medium-sized enterprises: Empirical evidence from the UK. British Journal of Management, 31(1), 141–161. https://doi.org/10.1111/1467-8551.12388
- Dubey, R., Bryde, D. J., Foropon, C., Tiwari, M., & Gunasekaran, A. (2021). How frugal innovation shape global sustainable supply chains during the pandemic crisis: Lessons from the COVID-19. Supply Chain Management, 27(2), 295–311. https://doi.org/10.1108/SCM-02-2021-0071
- Dubey, R., Gunasekaran, A., Wamba, S. F., & Bag, S. (2015). Building theory of green supply chain management using total interpretive structural modeling (TISM). IFAC-PapersOnLine, 48(3), 1688–1694. https://doi.org/10.1016/j.ifacol.2015.06.329
- Emas, R. (2015). The concept of sustainable development: Definition and defining principles. Florida International University. https://sustainabledevelopment.un.org/content/documents/5839GSDR%202015SDconcept definition rev.pdf.
- Erol, O., Sauser, B. J., & Mansouri, Mo. (2010). A framework for investigation into extended enterprise resilience. Enterprise Information Systems, 4(2), 111–136. https://doi.org/10.1080/17517570903474304
- European Parliament. (2023). Climate change and monetary policy: Risks, instruments, & chances. https://www.europarl.europa.eu/cmsdata/278232/2_DIW%20Nov%202023%20final.pdf.
- F. HairJr, J., Sarstedt, M., Hopkins, L., & G. Kuppelwieser, V. (2014). Partial least squares structural equation modeling (PLS-SEM): An emerging tool in business research. European Business Review, 26(2), 106–121. https://doi.org/10.1108/EBR-10-2013-0128
- Fahimnia, B., & Jabbarzadeh, A. (2016). Marrying supply chain sustainability and resilience: A match made in heaven. Transportation Research Part E: Logistics and Transportation Review, 91(C), 306–324. https://doi.org/10.1016/j.tre.2016.02.007
- Feng, y., Lai, K., & Zhu, Q. (2022). Green supply chain innovation: Emergence, adoption, and challenges. International Journal of Production Economics, 248, 108497. https://doi.org/10.1016/j.ijpe.2022.108497
- Fiksel, J. (2006). Sustainability and resilience: Toward a systems approach. Sustainability: Science, Practice and Policy, 2(2), 14–21. https://doi.org/10.1080/15487733.2006.11907980
- Friedman, M. (1970). The social responsibility of business is to increase its profits. New York Times Magazine, 13 September 1970, 122–126.
- Gligor, D. M., & Holcomb, M. C. (2012). Understanding the role of logistics capabilities in achieving supply chain agility: A systematic literature review. Supply Chain Management: An International Journal, 17(4), 438–453. https://doi.org/10.1108/13598541211246594
- Golicic, S. L., & Smith, C. D. (2013). A meta-analysis of environmentally sustainable supply chain management practices and firm performance. Journal of Supply Chain Management, 49(2), 78–95. https://doi.org/10.1111/jscm.12006
- Govindan, K., Soleimani, H., & Kannan, D. (2015). Reverse logistics and closed-loop supply chain: A comprehensive review to explore the future. European Journal of Operational Research, 240(3), 603–626. https://doi.org/10.1016/j.ejor.2014.07.012
- Govindan, K., Kaliyan, M., Kannan, D., & Haq, A. N. (2014). Barriers analysis for green supply chain management implementation in Indian industries using analytic hierarchy process. International Journal of Production Economics, 147(PB), 555–568. https://doi.org/10.1016/j.ijpe.2013.08.018
- Green, K. W., Jr, Zelbst, P. J., Meacham, J., & Bhadauria, V. S. (2012). Green supply chain management practices: Impact on performance. Supply Chain Management, 17(3), 290–305. https://doi.org/10.1108/13598541211227126
- Green, P. E., & Rao, V. R. (1970). Rating scales and information recovery—how many scales and response categories to use? Journal of Marketing, 34(3), 33–39. https://doi.org/10.1177/002224297003400307
- Guide, D. V., & Wassenhove, V. (2009). The evolution of closed-loop supply chain research. Research, 57(1), 10–18. https://doi.org/10.1287/opre.l080.0628
- Gunasekaran, A., Subramanian, N., & Rahman, S. (2015). Supply chain resilience: Role of complexities and strategies. International Journal of Production Research, 53(22), 6809–6819. https://doi.org/10.1080/00207543.2015.1093667
- Hair, J. F., Jr. (2014). Partial least squares structural equation modeling (PLS-SEM): An emerging tool in business research. European Business Review, 26, 106–121. https://doi.org/10.1108/EBR-10-2013-0128
- Hair, J. F., Hult, G. T. M., Ringle, C. M., Sarstedt, M., Danks, N. P., & Ray, S. (2021). Partial Least Squares Structural Equation Modeling (PLS-SEM) Using R. Springer International Publishing. https://doi.org/10.1007/978-3-030-80519-7
- Hair, J. F., Ringle, C. M., Gudergan, S. P., Fischer, A., Nitzl, C., & Menictas, C. (2019). Partial least squares structural equation modeling-based discrete choice modeling: an illustration in modeling retailer choice. Business Research, 12(1), 115–142. https://doi.org/10.1007/s40685-018-0072-4
- Hair, J. F., Ringle, C. M., & Sarstedt, M. (2013). Partial least squares structural equation modeling: Rigorous applications, better results and higher acceptance. Long Range Planning, 46(1–2), 1–12. https://doi.org/10.1016/j.lrp.2013.01.001
- Hair, J., Ringle, C., & Sarstedt, M. (2011). PLS-SEM: Indeed, a silver bullet. Journal of Marketing Theory and Practice, 19(2), 139–152. https://doi.org/10.2753/MTP1069-6679190202
- Henseler, J., Ringle, C. M., & Sarstedt, M. (2015). A new criterion for assessing discriminant validity in variance-based structural equation modeling. Journal of the Academy of Marketing Science, 43(1), 115–135. https://doi.org/10.1007/s11747-014-0403-8
- Holling, C. S. (1973). Resilience and stability of ecological systems. Annual Review of Ecology and Systematics, 4(1), 1–23. http://www.jstor.org/stable/2096802 https://doi.org/10.1146/annurev.es.04.110173.000245
- Hollnagel, E., Woods, D. D., & Leveson, N. (2006). Resilience engineering: Concepts and precepts (p. 397). Ashgate Publishing Ltd.
- Holman, D., Wicher, P., Lenort, R., Dolejšová, V., Staš, D., & Giurgiu, J. (2018). Sustainable logistics management in the 21st century requires wholeness systems thinking. Sustainability, 10(12), 4392., https://doi.org/10.1002/joe.21600 https://doi.org/10.3390/su10124392
- International Finance Corporation. (2021). Emerging market green bond report. https://www.ifc.org/content/dam/ifc/doc/mgrt/202206-emerging-market-green-bonds-report-2021-vf-2.pdf.
- International Monetary Fund. (2020). Sub-Saharan Africa: A difficult road to recovery. https://www.imf.org/en/News/Articles/2020/10/21/pr20319-sub-saharan-africa-a-difficult-road-to-recovery.
- Jain, V., Kumar, S., Soni, U., & Chandra, C. (2017). Supply chain resilience: Model development and empirical analysis. International Journal of Production Research, 55(22), 6779–6800. https://doi.org/10.1080/00207543.2017.1349947
- Jassim, S., Al-Mubarak, M., & Hamdan, A. M. (2020). The impact of green supply chain management on firm’s performance. Journal of Information & Knowledge Management, 19(01), 2040026–2040016. https://doi.org/10.1142/S0219649220400262
- Jean, R.-J., Deng, Z., Kim, D., & Yuan, X. (2016). Assessing endogeneity issues in international marketing research. International Marketing Review, 33(3), 483–512. https://doi.org/10.1108/IMR-02-2015-0020
- Jermsittiparsert, K., Haseeb, M., & Dawabsheh, M. (2020). Enhancing organic food identity through green marketing in Thailand: Mediating role of environmental, health, and social consciousness. https://doi.org/10.1002/wfp2.12009
- Karimi, A., & Rahim, K. (2015). Classification of external stakeholders pressures in green supply chain management. Procedia Environmental Sciences, 30, 27–32. https://doi.org/10.1016/j.proenv.2015.10.005.
- Khan, S., & Pasha, U. (2022). Green Supply chain management: Opportunities, challenges and changing strategies: A Literature review. iRASD Journal of Management, 4(2), 201–218. https://doi.org/10.52131/jom.2022.0402.0074
- Kock, N., & Hadaya, P. (2018). Minimum sample size estimation in PLS-SEM: The inverse square root and gamma-exponential methods. Information Systems Journal, 28(1), 227–261. https://doi.org/10.1111/isj.12131
- Kumar, R., & Chandrakar, R. (2012). Overview of green supply chain management: Operation and environmental impact at different stages of the supply chain.
- Labuschagne, C., & Brent, A. C. (2005). Sustainable project life cycle management: The need to integrate life cycles in the manufacturing sector. International Journal of Project Management, 23(2), 159–168. https://doi.org/10.1016/j.ijproman.2004.06.003
- Lahti, T., Wincent, J., & Parida, V. A. (2018). Definition and theoretical review of the circular economy, value creation, and sustainable business models. Where are we now and where should research move in the future? Sustainability, 10(8), 2799. https://doi.org/10.3390/su10082799
- Mafini, C., & Loury Okoumba, W. (2018). Extending green supply chain management activities to manufacturing small and medium enterprises in a developing economy. South African Journal of Economic and Management Sciences, 21(1). https://doi.org/10.4102/sajems.v21i1.1996
- Mandal, S., Bhattacharya, S., Korasiga, V., & Sarathy, R. (2017). The dominant influence of logistics capabilities on integration: Empirical evidence from supply chain resilience. International Journal of Disaster Resilience in the Built Environment, 8(4), 357–374. https://doi.org/10.1108/IJDRBE-05-2016-0019
- Manurung, H., Yudoko, G., & Okdinawati, L. (2023). A conceptual framework of supply chain resilience towards sustainability through a service-dominant logic perspective. Heliyon, 9(3), e13901. https://doi.org/10.1016/j.heliyon.2023.e13901
- Marchese, D., Reynolds, E., Bates, M. E., Morgan, H., Clark, S. S., & Linkov, I. (2018). Resilience and sustainability: Similarities and differences in environmental management applications. The Science of the Total Environment, 613-614, 1275–1283. https://doi.org/10.1016/j.scitotenv.2017.09.086
- Masoumik, S. M., Abdul-Rashid, S. H., Olugu, E. U., & Ghazilla, R. A. R. (2015). A strategic approach to develop green supply chains. Procedia CIRP, 26, 670–676. https://doi.org/10.1016/j.procir.2014.07.091
- Mc Arthur Foundation. (2015). How policymakers can pave the way to a low-carbon and prosperous future.
- Mc Arthur Foundation. (2015). Towards a circular economy: Business rationale for an accelerated transition.
- McManus, S., Seville, E., Brunsdon, D., & Vargo, J. (2007). Resilience management: A framework for assessing and improving the resilience of organisations, 78.
- Milman, A., & Short, A. (2008). Incorporating resilience into sustainability indicators: An example for the urban water sector. Global Environmental Change, 18(4), 758–767. https://doi.org/10.1016/j.gloenvcha.2008.08.002
- Mitra, S., & Datta, P. P. (2014). Adoption of green supply chain management practices and their impact on performance: An exploratory study of Indian manufacturing firms. International Journal of Production Research, 52(7), 2085–2107. https://doi.org/10.1080/00207543.2013.849014
- Namagembe, S., Ryan, S, & Sridharan, R. (2019). Green supply chain practice adoption and firm performance: manufacturing SMEs in Uganda. Management of Environmental Quality, 30(1), 5–35. https://doi.org/10.1108/MEQ-10-2017-0119
- Negri, M., Cagno, E., & Colicchia, C. (2024). Building sustainable and resilient supply chains: a framework and empirical evidence on trade-offs and synergies in implementation of practices. Production Planning & Control, 35(1), 90–113. https://doi.org/10.1080/09537287.2022.2053758
- Negri, M., Cagno, E., & Colicchia, C. (2022). Building sustainable and resilient supply chains: A framework and empirical evidence on trade-offs and synergies in implementation of practices. Production Planning & Control, 35(1), 90–113. https://doi.org/10.1080/09537287.2022.2053758
- Negri, M., Cagno, E., Colicchia, C., & Sarkis, J. (2021). Integrating sustainability and resilience in the supply chain: A systematic literature review and a research agenda. Business Strategy and the Environment, 30(7), 2858–2886. https://doi.org/10.1002/bse.2776
- Novak, D. C., Wu, Z., & Dooley, K. J. (2021). Whose resilience matters? Addressing issues of scale in supply chain resilience. Journal of Business Logistics, 42(3), 323–335. https://doi.org/10.1111/jbl.12270
- Pettit, T. J., Croxton, K. L., & Fiksel, J. (2013). Ensuring supply chain resilience: Development and implementation of an assessment tool. Journal of Business Logistics, 34(1), 46–76. https://doi.org/10.1111/jbl.12009
- Qalati, S. A., Kumari., & S., Soomro, I. A., Ali, R., & Hong, Y. (2022). Green supply chain management and corporate performance among manufacturing firms in Pakistan. Environmental Economics and Management, 10. https://doi.org/10.3389/fenvs.2022.873837
- Qureshi, I., & Compeau, D.R. (2009). Assessing between-group differences in information systems research: A comparision of covariance- and component-based SEM. MIS Quarterly, 33(1), 197–214. https://doi.org/10.2307/20650285
- Radomir, L., & Moisescu, O. I. (2019). Discriminant validity of the customer-based corporate reputation scale: Some causes for concern. Journal of Product & Brand Management, 29(4), 457–469. https://doi.org/10.1108/JPBM-11-2018-2115
- Ramanathan, U., He, Q., Subramanian, N., Gunasekaran, A., & Sarpong, D. (2023). Collaborative closed-loop supply chain framework for sustainable manufacturing: Evidence from the Indian packaging industry. Technological Forecasting and Social Change, 191, 122489. https://doi.org/10.1016/j.techfore.2023.122489
- Rao, P, Holt, D. & (2005). Do green supply chains lead to competitiveness and economic performance? International Journal of Operations & Production Management, 25(9), 898–916. https://doi.org/10.1108/01443570510613956
- Rasit, Z. A., Zakaria, M., Hashim, M., Ramli, A., & Mohamed, M. (2019). Green supply chain management (GSCM) practices for sustainability performance: An empirical evidence of Malaysian SMEs. International Journal of Financial Research, 10(3), 371–379. https://doi.org/10.5430/ijfr.v10n3p371
- Ringle, C. M., Sarstedt, M., Mitchell, R., & Gudergan, S. P. (2019). Partial least squares structural equation modeling in HRM research. The International Journal of Human Resource Management, 31(12), 1617–1643. https://doi.org/10.1080/09585192.2017.1416655
- Ringle, C., da Silva, D., & Bido, D. (2015). Structural equation modeling with the SmartPLS. Brazilian Journal of Marketing, 13(2). https://ssrn.com/abstract=2676422.
- Saeed, A., Jun, Y., Nubuor, S. A., Priyankara, H. P. R., & Jayasuriya, M. P. F. (2018). Institutional pressures, green supply chain management practices on environmental and economic performance: A two theory view. Sustainability, 10(5), 1517. https://doi.org/10.3390/su10051517
- Saidi, D., Alami, J. E., & Hlyal, M. (2021). Building sustainable resilient supply chains in emerging economies: Review of motivations and holistic framework. IOP Conference Series: Earth and Environmental Science, 690(1), 012057. https://doi.org/10.1088/1755-1315/690/1/012057
- Sangode, P. B. (2018). Impact of 5s methodology on the efficiency of the workplace: Study of manufacturing firms. International Journal of Research in Commerce and Management, 9(12). https://ssrn.com/abstract=3343453.
- Sarkis, J., Helms, M. M., & Hervani, A. A. (2010). Reverse logistics and social sustainability. Corporate Social Responsibility and Environmental Management, 17(6), 337–354. https://doi.org/10.1002/csr.220
- Sarstedt, M., Ringle, C. M., Cheah, J.-H., Ting, H., Moisescu, O. I., & Radomir, L. (2020). Structural model robustness checks in PLS-SEM. Tourism Economics, 26(4), 531–554. https://doi.org/10.1177/1354816618823921
- Seville, E., Van Opstal, D., & Vargo, J. (2015). A primer in resiliency: Seven principles for managing the unexpected. Global Business and Organizational Excellence, 34(3), 6–18. https://doi.org/10.1002/joe.21600
- Spaargaren, G. (2000). Ecological modernization theory and the changing discourse on environment and modernity. In G. Spaargaren, A. P. J. Mol, & F. H. Buttel (Eds.), Environment and global modernity (pp. 41–73). Sage.
- Srivastava, S. K. (2007). Green supply-chain management: A state-of-the-art literature review. International Journal of Management Reviews, 9(1), 53–80. https://doi.org/10.1111/j.1468-2370.2007.00202.x
- Susan L. Golicic, S.L., & Smith, C.D. (2013). A Meta-Analysis of Environmentally Sustainable Supply Chain Management Practices and Firm Performance. Journal of Supply Chain Management. Volume 49, Issue 2. https://doi.org/10.1111/jscm.12006
- Trivellas, P., Malindretos, G., & Reklitis, P. (2020). Implications of green logistics management on sustainable business and supply chain performance: Evidence from a survey in the Greek agri-food sector. Sustainability, 12(24), 10515. https://doi.org/10.3390/su122410515
- Tukamuhabwa, B. R., Stevenson, M., Busby, J., & Zorzini, M. (2015). Supply chain resilience: Definition, review and theoretical foundations for further study. International Journal of Production Research, 53(18), 5592–5623. https://doi.org/10.1080/00207543.2015.1037934
- van Opstal, D. (2007). The resilient economy: Integrating competitiveness and security. Council on Competitiveness.
- Vienažindienė, M., Tamulienė, V., & Zaleckienė, J. (2021). Green logistics practices seeking development of sustainability: Evidence from Lithuanian transportation and logistics companies. Energies, 14(22), 7500. https://doi.org/10.3390/en14227500
- Vinzi, E., Trinchera, L., & Amato, S. (2010). PLS path modeling: From foundations to recent developments and open issues for model assessment and improvement. https://doi.org/10.1007/978-3-540-32827-8_3
- Wang, Z., & Sarkis, J. (2017). Corporate social responsibility governance, outcomes, and financial performance. Journal of Cleaner Production, 162, 1607–1616. https://doi.org/10.1016/j.jclepro.2017.06.142
- Wieland, A., & Wallenburg, C. M. (2012). Dealing with supply chain risks: Linking risk management practices and strategies to performance. International Journal of Physical Distribution & Logistics Management, 42(10), 887–905. https://doi.org/10.1108/09600031211281411
- Wong, K. K. (2013). Partial least squares structural equation modeling (PLS-SEM) techniques using SmartPLS. Marketing Bulletin, 24, 1–32.
- Wong, K. (2019). Mastering partial least squares structural equation modeling (PLS-SEM) with SmartPLS in 38 hours. https://www.researchgate.net/publication/332031150
- World Commission on Environment and Development. (1987). Report of the world commission on environment and development: Our common future towards sustainable development 2. Part ii. Common challenges population and human resources 4.
- Zhu, Q., & Sarkis, J. (2004). Relationships between operational practices and performance among early adopters of green supply chain management practices in Chinese manufacturing enterprises. Journal of Operations Management, 22(3), 265–289. https://doi.org/10.1016/j.jom.2004.01.005