
 ?Mathematical formulae have been encoded as MathML and are displayed in this HTML version using MathJax in order to improve their display. Uncheck the box to turn MathJax off. This feature requires Javascript. Click on a formula to zoom.
Abstract
Workers require good working conditions to enhance their job performance, in this study, we conducted a survey of European working conditions in 2022 and compared the results with that of 2016 using an unsupervised learning approach for exploratory data analysis and determining the relationships. Hence, the Principal Component Analysis (PCA) was adopted. The analyses were in two parts for both the 2016 and 2022 surveys. Following the PCA, the first part shows that European workers are mostly characterized by cheerfulness and good spirits. The second part reveals that European workers are best characterized by enthusiasm in their work. Test statistics showed that the European working condition for the two periods does not differ significantly. The working conditions in Europe have not been altered in the space of six years. This study recommends that the working condition in Europe should be improved so that employers would continue to give their best.
REVIEWING EDITOR:
1. Introduction
Work is an important aspect of life and it is inevitable. It is work that provides opportunities for underdeveloped, developing, and developed nations to continue in development. However, work and developments do not occur of their own volition; rather, employees are the cause of all of these, which is dependent on the ideal working conditions. Providing good working conditions to employees is vital to individuals’ productivity, enhancing organizations’ performance and the nation’s economy. It is therefore incumbent on organizations to provide good working conditions for their employees to thrive.
Particularly in the industrialized world, such as European countries, immigration by people from all over the world into Europe has increased due to their need to have better working conditions and improved job satisfaction. When employees possess what it takes to achieve high performance, they are easily welcome into Europe, for example, the Highly Skilled Migrant program and related to attract professionals and skilled workers. Lisbona et al. (Citation2018) stated that for any employee to function in a modern society, a high level of adaptability, proper implementation, and the invention of new ideas and products are required.
This study focuses on EWCS ‘workforce’, and EWCS refers to employees and self-employed workers, minus unemployed workers (Eurofound, Citation2016). In Europe, between 2016 and 2022, it was recorded that there has been an increased workforce due to immigration from individuals seeking better working conditions and these workers are accepted because of their capacity to function. According to Batalova (Citation2022), the total number of international destinations in Europe and Northern America in 2000 was 145,414,863 (52%).
Although this result, showed the number of immigrants seeking to find the next best working condition for improved satisfaction, perhaps revealing the possible strength of European countries to absorb these immigrant workers. On the other hand, the study has an oversight concerning how the influx of immigrant workers affects the satisfaction and performance of European citizens that are workers.
Studies are yet to reveal the consequences of having a continuous influx of immigrant workers into European countries and how this activity affects the attitude and perception of the non-immigrants European workforce. This understanding is necessary considering that non-European workers seem to be over-represented in some specific sectors (construction, manufacturing, transport, agriculture, forestry, and fishery) than European citizens (European Commission, Citation2022). Hence, this could create cause concern. Considering the influx of immigrants into Europe experience in recent years, there is a need to determine if there is an improvement in favour of workers or otherwise in the space of six years between using the EWCS 2016, and the new survey for 2022. Therefore, this study aims to identify if there is a difference in the European working condition between 2016 and 2022. The analyses were based on descriptive statistics and exploratory data analyses using Principal Component Analyses (CPA). The remaining part of the study is sectionalized as follows; Section 2 is the material and methods. Section 3 is the results. And Section 4 is the summary and conclusion.
2. Literature review
2.1. Working condition
‘Working conditions refers to the working environment and aspects of an employee’s terms and conditions’ (Eurowork, Citation2011). Good working condition, amongst others, is embedded in the eighth United Nations Sustainable Development Growth movement tagged ‘Decent Work and Economic Growth’. It aims to sustain and have inclusive economic growth, create decent jobs and improve living standards (United Nations, Citation2022). If the working condition is favorable to employees, it will positively impact their performances, and if otherwise, it will affect them negatively. The presence of favorable working circumstances within organizations is one of the key elements influencing performance (Hsiao et al., 2018).
2.2. Job satisfaction
Job satisfaction is an important goal for any organization that desires to actualize its purpose. For this study, job satisfaction encompasses indicators such as cheerfulness, calm relaxed, active, vigorous, fresh-rested, and fulfilled days that employees experience on the job. People’s level of job satisfaction reflects how much they enjoy their work. Job satisfaction centers on all individuals’ thoughts and feelings about their work (Lu et al., Citation2019). The strength of a corporation is a satisfied workforce (Yalamarthi, Citation2020). Furthermore, Yalamarthi (Citation2020) added that the term satisfaction is descriptive and means different things to different individuals. According to Hsiao et al. (2018), job satisfaction refers to the attitudes and emotions of employees toward the workplace. It also involves how employees view their jobs and evaluate and rate their work. Job satisfaction involves employees’ assessments and perceptions of a job, and the perception encompasses feelings on many different levels (Hur et al., Citation2022). A positive emotional view of work is a definition of job satisfaction, which contributes to improving both worker performance and company results (Marin-Garcia et al., 2011).
2.3. Theoretical underpinning
2.3.1. Theory of motivation
This study applied a theory of motivation that is traced to the work of Maslow (Citation1943) to understand employees’ perceptions and attitudes toward their job. The theory helps to identify human needs as it relates to their jobs. It includes ‘physiological needs, safety needs, love, and belonging needs, esteem needs, and self-actualization needs’. A worker needs to feel safe and loved, have a sense of belonging, and have a good working environment to perform well on the job (Beynon, Citation1973). This implies that when a worker feels his or her job is unsafe it would negatively affect his or her level of motivation to work and ultimately the overall level of job satisfaction.
2.3.2 Working conditions and job satisfaction
Various studies have been conducted on the relationship between working conditions and job satisfaction, productivity level, and other variables. Raziqa and Maulabakhsha (Citation2015) study shows a positive relationship between working environment (working conditions) and employee satisfaction. Other authors whose studies showed a positive relationship between working conditions and job satisfaction include Castillo and Cano (Citation2004), Gazioglu and Tansel (Citation2006), Baah and Amoako (Citation2011), Chandrasekar (Citation2011), Bakotic and Babic (Citation2013) and Esther Olu-Owolabi et al. (Citation2020). Aleksynska et al. (Citation2019, pp. 4) stated that ‘workers have the right to a high level of protection of their health and safety at work’; while meeting their professional needs to prolong their days in the labor market. Gartenstein (Citation2018) emphasized two good working conditions for workers, which include ‘Health and Safety’ and ‘Freedom from Discrimination’. Salau et al. (Citation2018) conducted a study to determine the relationship between work environments and the productivity of academic staff of universities in selected Universities in Nigeria. The study showed that productivity would be maximized if the work environment is favorable and there are growth opportunities. Also, Sorensen et al. (Citation2016) highlighted the seven broad areas of the ‘Conceptual model for integrated approaches to the protection and promotion of worker health and safety’, one of which is ‘conditions of work’ includes (i) the Physical environment, (ii) organization of work, (iii) psychosocial factors, (iv) job task & demand.
2.4. Unsupervised learning
Machine learning is classified as supervised, unsupervised, and reinforcement learning. In supervised learning, there are dependent and independent variables, while for unsupervised learning, all variables are important, and they can be used to make predictions (Iyiola et al., Citation2023; Okagbue et al., Citation2020). On the other hand, reinforced learning combines the two methods. Reinforcement learning is sometimes called semi-supervised learning. The principal component analysis is mostly used for dimension reduction, as much as it is used to determine relationships among variables. Another type of unsupervised learning is the cluster analysis; the hierarchical, k-means, k-median, and k-mode. The most popularly used is k-means clustering.
The PCA is used for reducing the dimensionality of large datasets, yet minimizing information loss. It reduces the number of variables, hence decreasing the complexity in the data. This would help to avoid the model depending on the trained data, hence avoiding overfitting (Rogers & Girolami, Citation2012, p. 242). It is often used for explorative analysis and also determines the relationship among variables. Howley et al. (Citation2006) showed that the PCA helps in achieving predictive accuracy; Candès et al. (Citation2011) presents a robust approach to PCA, in a similar fashion, Zhao et al. (Citation2014) provided methods of obtaining principal components amid complex white noise, Jolliffe and Cadima (Citation2016) provided some variants in PCA and its applications. An application of PCA can be found in the study of Tsoulfidis and Athanasiadis (Citation2022).
3. Material and methods
3.1. Principal component analysis
Principal component analysis belongs to the class of unsupervised statistical learning techniques. Using PCA there are no dependent variables; all variables are taken as independent variables relative to the regression technique, therefore it does not involve variable but only
. PCA only computes the principal component. In a case where we have a large dataset with correlated variables, such a dataset can be summarized. The summary would explain the variability in the main datasets (James et al., Citation2013). The procedure for implementing the Principal Component Analysis is provided in (James et al., Citation2013, pp. 379–380).
3.2. General equation for PCA
‘The first principal component of a set of features is the normalized linear combination of the features’:
(1)
(1)
From (1) the normalized, and the elements of
are called the ‘loading’ of the first principal. The loadings make up the principal component loading vector.
The loading is constraints in such a way that their sum of squares is equal to one
.
Since variance is of interest, to compute the first principal component of a data set
we assume that each variable in
has been centered to have mean zero
, we then obtain the linear combination of the sample feature values of the form
(2)
(2)
The largest sample variance is subject to
‘The first principal component loading vector solves the optimization problem’:
(3)
(3)
Optimization problem in (3) can be solved by Eigen decomposition. From (2) the objective function in (3) can be written as
The average of (scores of principal component) will equally be zero.
After obtaining the first principal component of the dataset, the second principal component
which is linear combination
can be obtained. It has maximal variance out of all linear combinations that are uncorrelated with
.
The second principal component with scores is of the form
(4)
(4)
3.3. Data description
There are two datasets, the European Working Conditions 2016 and European Working Conditions 2022. Each data are divided into two parts. The detailed report of the European Working Conditions 2016 is presented in Eurofound (Citation2016).
At the time of the survey, 15% of the European workforce was self-employed, 12% were contract staff (temporary employees) and the remaining (73%) were in permanent contract or another form of employment. The majority of the EWCS workforce is made up of professionals (19%), while the remaining 89% are shared across Service and sales workers, Technicians, Craft workers, Clerks, Elementary occupations, Plant and machine operators, Managers, and Agricultural workers, in that order. contains weekly working hours, by country and sex.
Figure 1. Usual weekly working hours, by country and sex. Source: (Eurofound, Citation2016).
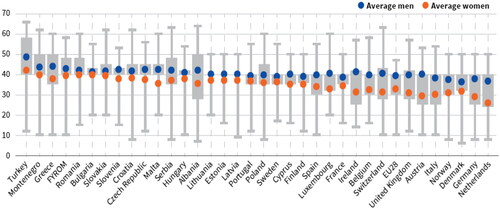
The dataset includes questions 87a–e had 6 scales and provided in and questions 90a–f had 5 scales, provided in , they were analyzed separately to draw valid inferences from the survey. A total number of 3,976 males (50.9%) and 3,837 females (49.1%) were involved in the study for 2016, and a total of 7813. The oldest was 87 and the youngest 15 years old, and the average age of participants was approximately 43 years old.
Table 1. Summary of response (Q87a–87e).
Table 4. Response for (Q90a–Q90c, Q90f).
The authors conducted a survey online from 29th May 2022 to 22nd July 2022. Purposeful sampling was used, and a mix of snowballing where new participants recruits other participants to participate in the survey. The 2022 survey comprised 178 females (44.9%) and 218 (55.1%) males, totaling 396. The respondents were predominantly from the United Kingdom, with a total of 240 participants (60.6%), while the remaining 154 (39.4%) respondents were from other countries, such as Ireland and Germany. So, not all European countries were covered in the 2022 survey relative to the 2016 EWCS.
3.5. Method of analysis
Software by R Core Team (Citation2022) was used to carry out the PCA based on the model in EquationEquations (1)–(4). The ‘Package devtools’ in R by Wickham et al. (Citation2020) was used, also ‘Package ggbiplot’ by Vu (Citation2011)-a ggplot2 based biplot was used for the visual plots.
4. Results
4.1. Analysis of response for 2016 survey
shows the response frequencies and the corresponding percentages of questions 87a-87e in the survey. Seven thousand eight hundred and thirteen workers (7813) were sampled and coded accordingly. In (Cheerful.GS), the second column stands for Q87a responses to ‘I have felt cheerful and in good spirits’. The third column in (Calm.relaxed) stands for responses to Q87b ‘I have felt calm and relaxed’. The fourth column in (Active.Vigorus) stands for answers to Q87c ‘I have felt active and vigorous’. The fifth column in (Fresh.rested) stands for responses to Q87d ‘I woke up feeling fresh and rested’, and lastly, the sixth column in (Fulfilled days) stands for answers to Q87e, ‘My daily life has been filled with things that interest me’. The principal component analysis for this part is based on and shown in and , and 3, respectively.
Figure 2. Scree plots for PCA analysis of Q 87 a–e.
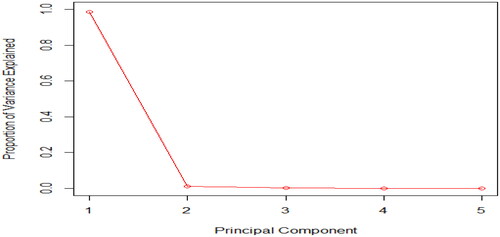
Table 2. Principal component analysis of European Working Conditions Survey conducted for Q87 a–e
Table 3. Principal component analysis for Q 87 a–e.
In .D. is the standard deviation, Prop. of Variance is the proportion of Variance, and Cum. Prop is the cumulative proportion. shows that five principal components were obtained, namely PC1-PC5. Each principal component explains the total variations in the European Working Conditions Survey 2016 dataset for 90a–f. The Principal Component 1 (PC1) explains 96% of the total Variance, almost 100%. Principal component 2 (PC2) explains 3.1% of the Variance. It is observed that proportion of variance of PC1 is 96.04%, PC1 and PC2 give a Cumulative Proportion of (99.2%). It means that PC1 and PC2 explain almost all of the variation in the European Working Conditions related to questions 90 a–f.
The plot shows that the PC1 and PC2 are sufficient to explain the variation in the data. There was a sharp deviation from the second component.
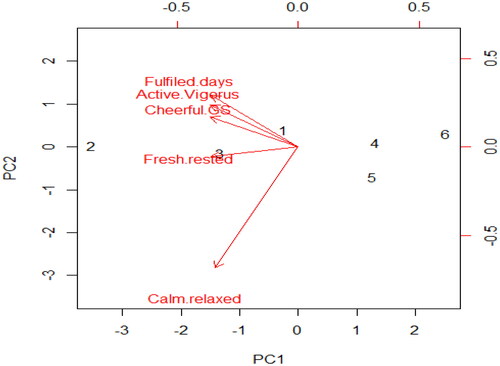
From , all the variables have a negative relationship. In PC1, the variable that mainly described the working of Europeans is Cheerful.GS (−0.44986). All the variables have a negative relationship. A worker who is not cheerful would not be calm/relaxed at work. Such a person will not be active and vigorous. Also, a person cannot wake up feeling fresh and rested due to a bad and unfilled day. In PC2, ‘Fulfiled.days’ mainly described the working condition. It has a negative relationship with ‘fresh.rested’, and ‘Calm.relaxed’. It can be interpreted that a worker who had a fulfilled day does not necessarily mean that they will be calm and relaxed or wake up feeling refreshed and rested the following day. shows the relationship among the variables.
Figure 3. PCA for European working conditions survey for Q87a–e. Source: Author.
4.1.1. Analysis of response of (Q90a–Q90f)
The questions Q90a–Q90f helps to determine how much energy they put into their work, how enthusiastic the participants are about their daily job schedules, how much the work gives them time to do other things they would normally want to do aside work, and lastly, how competent do they perceive themselves to be.
shows the European Working Conditions Survey 2016, questions 90a–90c and 90f. Seven thousand eight hundred and thirteen workers (7813) were included in the survey as mentioned earlier. The frequencies and percentages are provided in . The second column in (Energy) stands for Q90a responses to the question, ‘− At my work, I feel full of energy’. The third column in (Enthusiastic) stands for responses to Q90b ‘I am enthusiastic about my job’. The fourth column in (Time) stands for answers to Q90c ‘Time flies when I am working’. The fifth column in (Competence) stands for Q90f responses to’– In my opinion, I am good at my job’. The principal component analysis for this section was based on and recorded in and , and , respectively.
Figure 4. Scree plots for PCA analysis of Q90a–f.
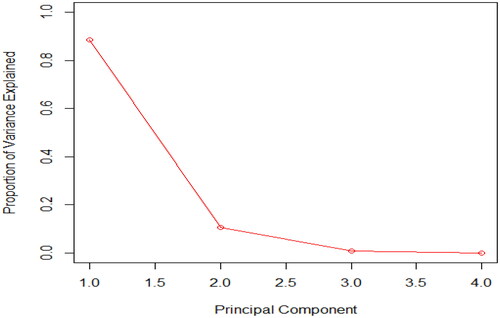
Figure 5. PCA for European working conditions survey for Q90a–f. Source: Author.
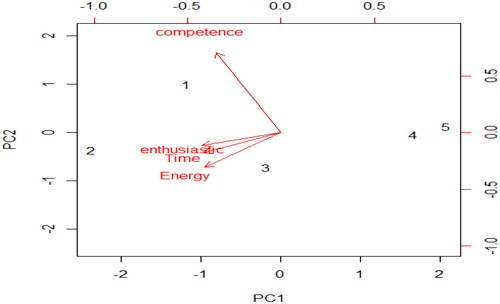
Figure 6. Plot showing relationship among the variables.
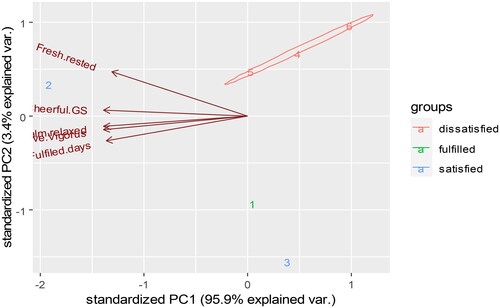
Table 5. Response (Q90a–Q90c, Q90f).
Table 6. Principal component analysis for Q90a–f.
In .D. is the standard deviation, Prop. of Variance is the proportion of Variance, and Cum.Prop is the cumulative proportion. From , four principal components were obtained, namely PC1–PC4. Principal Component 1 (PC1) explains 88.8% of the total variation. Principal component 2 (PC2) explains 10.5% of the Variance. It is observed that proportion of variance of PC1 is 88.6%; PC1 and PC2 give a Cumulative Proportion of (99.1%). It means that PC1 and PC2 explained almost all of the variations in the European Working Conditions and provided for Q90 a–f. The scree plot is given in .
further shows described what is represented in . PC1 and PC2 explain the variation in the data set.
From , all the variables have a negative relationship. In PC1, the variable that primarily describes the working of Europeans is the ‘enthusiastic” (−0.52845). It can be interpreted as a worker that is not enthusiastic will put less ‘energy’ to work and give less ‘time’ to work. Also, an incompetent worker cannot be ‘enthusiastic’. The relationship among the variables is further described in .
From , it was observed that those whose responses were ‘rarely’ (4) and ‘never’ (5) about having quality time at work clustered together.
4.2. Analysis of response for 2022 survey
contains the analysis for Q87 a–e, while contains the analysis for (Q90a–Q90c, Q90f).
Table 7. Principal component analysis for Q87 a–e.
Table 8. Principal component analysis for (Q90a–Q90c, Q90f).
From , all the variables have a negative relationship. In PC1, the variable that mainly described the working of Europeans is the Cheerful.GS (−0.45384). Similar to the analyses conducted for the 2016 survey, all the variables have a negative relationship. The interpretations follow alike. Plot 5 gives a visual exploration of .
Figure 7. Plot showing relationship among the variables for (Q90a–Q90c, Q90f).
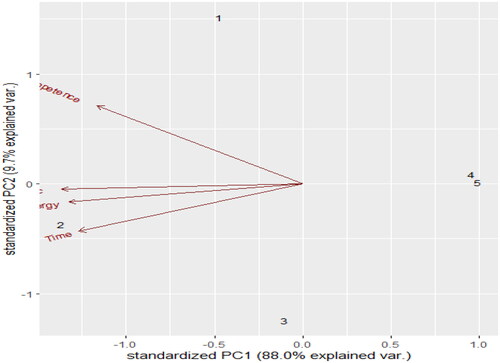
From , all the variables have a negative relationship. In PC1, the variable that primarily describes the working of Europeans is the ‘enthusiastic’ (−0.53218). Similar to the results obtained from the survey of 2016, it can be interpreted as a worker who is not enthusiastic will put less ‘energy’ to work and give less ‘time’ to work. Also, an incompetent worker cannot be ‘enthusiastic’. The relationship among the variables is further described in . The results showed that European Working Conditions have mostly stayed the same in 2022 as in 2016.
In and , the results of PC1 and PC2 are presented since the two components are sufficient to describe the relationship among the variables. We conduct a t-test statistics to determine if there is difference in the mean of PCs for 2106, and PCs for 2022 results. Null hypothesis versus
. Where
is for 2016 results and
is for 2022 results.
Table 9. PC1 and PC2 PCA for 2016 and 2022 Survey for Q87a–e.
Table 10. PC1 and PC2 PCA for 2016 and 2022 survey for Q90a–f.
T-test was conducted to determine the difference between PC1 for 2016 and PC1 for 2022, also the difference in PC2 for 2016 and PC2 for 2022 for Q87a–e shown in . T-Stat = 0.019874 for the difference the PC1s, P(T< =t)=0.985217; since the p-value is greater than 0.05. We fail to reject the null hypothesis for the difference in PC1 for the two periods. This shows that the relationship among the variables in PC1 in 2016 does not differ significantly from that of 2022. Also, the relationship among the variables in PC2 in 2016 does not differ significantly following a t-test for difference in means, t-Stat= −0.0235 P(T< =t)=0.98176 > 0.05.
T-test was conducted to determine the difference between PC1 for 2016 and PC1 for 2022, also the difference in PC2 for 2016 and PC2 for 2022 for Q90a–f shown in . Analyses showed that t-Stat = 0.018980, P(T< =t)=0.985471; since the p-value is greater than 0.05, we fail to reject the null hypothesis for the difference in PC1s for the two periods. This shows that the relationship among the variables in PC1 in 2016 does not differ significantly from that of 2022. Also, the relationship among the variables in PC2 in 2016 does not differ significantly following a test statistics, t-Stat = 0.03529 P(T< =t)=0.97298
0.05.
5. Summary and conclusion
The European Working Conditions Survey 2016 and 2022 were analyzed in this study. Summary statistics were carried out on the responses. There were two parts to the analysis, the first part measures how the workers perceive their jobs, and the second part measures the worker’s attitude toward their various positions. Principal Component Analysis was further used for explorative analysis and visualization. In the first part, the variable that mainly described the working condition of the Europeans was the ‘Cheerful.GS’, that is, cheerfulness and good spirit. The results show that, if a worker is cheerful and in good spirits, such a person will be active and vigorous, feel fresh and rested, and have a fulfilled day at work. That agrees with Raziqa and Maulabakhsha (Citation2015) and Gartenstein (Citation2018) study. In the second part, the variable that mainly describes the working of Europeans is enthusiasm. So, if workers are enthusiastic about their jobs, they will be productive following Maslow’s theory of motivation. These results are in line with Salau et al. (Citation2018) study.
The Principal component analysis which measures the relationship among the variables shows very close results for the European working condition 2016 survey, and that of European working conditions newly obtained in 2022. The result of the first part shows that most European workers are cheerful and in good spirits and the second part reveals that they are enthusiastic about their work. A t-test statistics was conducted on the results obtained for the periods and established that there is no significant difference in the results obtained in the two periods for both the first and second part of the analyses. This study shows that the working condition has not been altered in the space of six years, and the influx of immigrant into Europe notwithstanding, recommends that working condition may be improved so that workers will have a better experience at work.
Acknowledgement
The researchers hereby appreciate Covenant University Centre for Research, Innovation and Discovery (CUCRID), Covenant University, Ota, Nigeria for the sponsorship of this research.
Disclosure statement
No potential conflict of interest was reported by the author(s).
Additional information
Notes on contributors
Olumide S. Adesina
Olumide S. Adesina studied Data Science and Business Analytics at the University of London-LSE, United Kingdom. He also holds a BSc in Mathematics from the University of Ilorin, MBA (Ogbomoso), an M.Sc. Statistics (Lagos), and Ph.D. Statistics (Ogun), all in Nigeria. His areas of specialization are Mathematical Statistics, Computational Statistics, and Data Science.
Adedayo F. Adedotun
Adedayo F. Adedotun holds a B.Sc., PGDE, M.Sc., and Ph.D. in Statistics. He lectures at Covenant University, where he focuses on machine learning, computational statistics, time series, and stochastic analysis. He has read and reviewed more than 60 journal articles, and he has over 30 peer-reviewed academic papers to his credit. Funmi holds editorial positions with reputable, internationally recognized journal outlets and is a professional member of several professional associations.
Semiu A. Alayande
Semiu A. Alayande a trailblazer in applied statistics, transforms raw data into actionable insights. With precision and rigor, his research revolutionizes industries, from finance to healthcare. Through his expertise, he empowers decision-makers to navigate complexity and optimize outcomes in an ever-changing world.
Emmanuel O. Efe-Imafidon
Emmanuel O. Efe-Imafidon is a dedicated lecturer. Since 2021, he has embarked on a fulfilling career in the Business Management Department, specifically in the Industrial Relations and Human Resource Management Unit at Covenant University, Ota, Ogun State. He has positively influenced the academic journeys of over 3000 students through his roles in coordination, teaching, and research.
Tolulope F. Adesina
Tolulope F. Adesina is a lecturer in the Department of Banking & Finance, Covenant University, Nigeria she holds a B.Sc. Economics (Ife), an M.Sc Strategic Financial Management (Derby), UK, and a Ph.D Finance (Covenant). Her research interests are in development finance and financial economics.
Hillary I. Okagbue
Hillary I. Okagbue a Ph.D. graduate from Covenant University, Ota, Nigeria, focuses his research on mathematical statistics, public health informatics, biostatistics, and data science. He has additional publications in business statistics and estate management. Previously a lecturer at Covenant University, Dr. Okagbue now serves as a senior researcher at the Sydani Institute of Research and Innovation, Sydani Group, Abuja. Notably, he holds editorial positions with BMC Public Health, BMC Medical Informatics & Decision Making, BMC Digital Health, PloS One, Scientific African, Elsevier, and African Scientific Report.
Oluwakemi O. Onayemi
Oluwakemi O. Onayemi is a lecturer in the department of Business Management, Covenant University. Her areas of interest are but not limited to Strategic Management, Effective Strategies to Increase Organisational Perfomance, Organisational Efficiency and Effectiveness, Corporate Planning,. She holds BSc. Insurance, MSc. Business Administration, and PhD Business Administration. She has over 6 years’ industry experience and 2 years experience in teaching.
References
- Aleksynska, M., Janine Berg, J., Foden, D., Johnston, H., Parent-Thirion, A., & Vanderleyden, J. (2019). Working conditions in a global perspective. https://www.ilo.org/wcmsp5/groups/public/–-dgreports/–-dcomm/–-publ/documents/publication/wcms_696174.pdf.
- Baah, K., & Amoako, G. K. (2011). Application of Frederick Herzberg’s two-factor theory in assessing and understanding employee motivation at work: A Ghanaian perspective. European Journal of Business and Management, 3(9), 1–13.
- Bakotic, D., & Babic, T. B. (2013). Relationship between working conditions and job satisfaction: The case of Croatian Shipbuilding Company. International Journal of Business and Social Science, 4(2), 206–213.
- Batalova, J. (2022). Top statistics on global migration and migrants. Migration Policy Institute (accessed December 15, 2022). https://www.migrationpolicy.org/article/top-statistics-global-migration-migrants.
- Beynon, H. (1973). Working for Ford. Penguin.
- Candès, E. J., Li, X., Ma, Y., & Wright, J. (2011). Robust principal component analysis? Journal of the ACM, 58(3), 1–37. https://doi.org/10.1145/1970392.1970395
- Castillo, J. X., & Cano, J. (2004). Factors explaining job satisfaction among faculty. Journal of Agricultural Education, 45(3), 65–74. https://doi.org/10.5032/jae.2004.03065
- Chandrasekar, K. (2011). Workplace environment and its impact organizational performance in public sector organizations. International Journal of Enterprise Computing and Business Systems, 1(1), 1–19.
- Esther Olu-Owolabi, F., Amoo, E., Samuel, O., Oyeyemi, A., & Adejumo, G. | (2020). Female-dominated informal labour sector and family (in) stability: The interface between reproduction and production. Cogent Arts & Humanities, 7(1), 1788878. https://doi.org/10.1080/23311983.2020.1788878
- Eurofound. (2016). Sixth European working conditions survey – overview report. Publications Office of the European Union.
- European Commission. (2022). Statistics on migration to Europe (accessed December 28, 2022). https://commission.europa.eu/strategy-and-policy/priorities-2019-2024/promoting-our-european-way-life/statistics-migration-europe_en.
- Eurowork. (2011). Working condition (accessed December 15, 2021). https://www.eurofound.europa.eu/observatories/eurwork/industrial-relations-dictionary/working-conditions.
- Gartenstein, D. (2018). Good working conditions for workers. Chron (accessed December 14, 2021). https://work.chron.com/good-working-conditions-workers-8106.html.
- Gazioglu, S., & Tansel, A. (2006). Job satisfaction in Britain: Individual and job related factors. Applied Economics, 38(10), 1163–1171. https://doi.org/10.1080/00036840500392987
- Howley, T., Madden, M. G., O’Connell, M. L., & Ryder, A. G. (2006). The effect of principal component analysis on machine learning accuracy with high-dimensional spectral data. Knowledge-Based Systems, 19(5), 363–370. https://doi.org/10.1016/j.knosys.2005.11.014
- Hsiao, J., & Lin, D, Department of Applied Economics and Management, National I-Lan University, Taiwan. (2018). The impacts of working conditions and employee competences of fresh graduates on job expertise, salary and job satisfaction. Journal of Reviews on Global Economics, 7, 246–259. https://doi.org/10.6000/1929-7092.2018.07.22
- Hur, J., Kuhn, M., Grogans, S. E., Anderson, A. S., Islam, S., Kim, H. C., Tillman, R. M., Fox, A. S., Smith, J. F., DeYoung, K. A., & Shackman, A. J. (2022). Anxiety-Related Frontocortical Activity Is Associated With Dampened Stressor Reactivity in the Real World. Psychological Science, 33(6), 906–924.
- Iyiola, T. P., Okagbue, H. I., Adedotun, A. F., & Toluwalase, A. J. (2023). The effects of decomposition of the goals scored in classifying the outcomes of five English Premier League seasons using machine learning models. Advances and Applications in Statistics, 87(1), 13–27. https://doi.org/10.17654/0972361723026
- James, G., Witten, D., Hastie, T., & Tibshirani, R. (2013). An introduction to statistical learning with applications in R. Springer.
- Jolliffe, I. T., & Cadima, J. (2016). Principal component analysis: A review and recent developments. Philosophical Transactions. Series A, Mathematical, Physical, and Engineering Sciences, 374(2065), 20150202. https://doi.org/10.1098/rsta.2015.0202
- Lisbona, A., Palaci, F., Salanova, M., & Frese, M. (2018). The effects of work engagement and self-efficacy on personal initiative and performance. Psicothema, 30(1), 89–96. https://doi.org/10.7334/psicothema2016.245
- Lu, H., Zhao, Y., & While, A. (2019). Job satisfaction among hospital nurses: A literature review. International Journal of Nursing Studies, 94, 21–31. https://doi.org/10.1016/j.ijnurstu.2019.01.011
- Marin-García, J. A., Bonavia, T., & Losilla, J. M. (2011). Exploring working conditions as determinants of job satisfaction: an empirical test among Catalonia service workers. The Service Industries Journal, 31(12), 2051–2066. https://doi.org/10.1080/02642069.2011.559226
- Maslow, A. H. (1943). A theory of human motivation. Psychological Review, 50(4), 370–396. https://doi.org/10.1037/h0054346
- Okagbue, H. I., Peter, N. J., Akinola, A. O., Iroham, C. O., & Opoko, A. P. (2020). Smart review of the application of genetic algorithm in construction and housing. International Journal of Advanced Trends in Computer Science and Engineering, 9(1), 266–273. https://doi.org/10.30534/ijatcse/2020/40912020
- R Core Team. (2022). R: A language and environment for statistical computing. R Foundation for Statistical Computing, Vienna, Austria. https://www.R-project.org/.
- Raziq, A., & Maulabakhsha, R. (2015). Impact of Work Environment on Job Satisfaction. Procedia Economics and Finance, 23, 717–725. https://doi.org/10.1016/S2212-5671(15)00524-9
- Rogers, S., & Girolami, M. (2012). A first course in machine learning. Taylor & Francis Group, CRC press.
- Salau, O., Worlu, R., Osibanjo, A., Adeniji, A., Oludayo, O., & Falola, H. (. (2018). Survey data on work environments and productivity of academic staff of selected public universities in Nigeria. Data in Brief, 19, 1912–1917. https://doi.org/10.1016/j.dib.2018.06.074
- Sorensen, G., Sorensen, D. L., McLellan., & E. L., Sabbath. (2016). Integrating worksite health protection and health promotion: A conceptual model for intervention and research Prev. Medicine, 91, 188–196.
- Tsoulfidis, L., & Athanasiadis, I. (2022). A new method of identifying key industries: a principal component analysis. Journal of Economic Structures, 11(1), 1–22. https://doi.org/10.1186/s40008-022-00261-z
- United Nations. (2022). Decent work and economic growth. https://www.un.org/sustainabledevelopment/economic-growth/
- Vu, V. Q. (2011). ggbiplot: A ggplot2 based biplot. R package, version 0.55. http://github.com/vqv/ggbiplot.
- Wickham, H., Hester, J., & Chang, W. (2020). devtools: Tools to make developing R packages easier. R package version 2.3.2. https://CRAN.R-project.org/package=devtools.
- Yalamarthi, B. V. (2020). Employee job satisfaction: A comprehensive literature review. A Journal of Composition Theory, 13(11), 301–305.
- Zhao, Q., Meng, D., Xu, Z., Zuo, W., & Zhang, L. (2014). Robust principal component analysis with complex noise. Proceedings of the 31st International Conference on Machine Learning, Beijing, China, 21–26 June 2014. http://jmlr.org/proceedings/papers/v32/zhao14.pdf.