
 ?Mathematical formulae have been encoded as MathML and are displayed in this HTML version using MathJax in order to improve their display. Uncheck the box to turn MathJax off. This feature requires Javascript. Click on a formula to zoom.
Abstract
Since the onset of the COVID-19 pandemic, African currencies, cryptocurrencies, and commodity markets have undergone significant fluctuations, displaying fat-tail properties that lies at the outer ends of the normal probability curve. The recent Russia-Ukraine war has further disrupted these markets, generating considerable interest among academics and practitioners. Our study delves into tail-end returns and volatility connectedness between Bitcoin, crude oil, gold, and four African currencies amidst the COVID-19 and Russia-Ukraine war. Employing a quantile vector autoregressive (QVAR) approach, we analyze tail-end spillover effects between markets from 4 November 2019, to 7 September 2022. Our findings reveal heightened connectedness at the quantile ends of co-movements, with left-tail spillovers being more pronounced for returns, while right-tail spillovers dominate for volatility. Bitcoin, and to a lesser extent gold and oil, emerge as effective tail-ended hedges for the Egyptian Pound and Nigerian Naira but not for other African currencies like the Algerian Dinar and South African Rand. Consequently, users of Egyptian and Nigerian currencies in international financial markets can seek hedging opportunities in traditional cryptocurrencies and commodities during recent Black Swan events, unlike those using South African and Algerian currencies. Additionally, our results suggest limited diversification benefits associated with (i) currencies linked to oil-exporting or oil-importing countries, (ii) currencies linked to Shariah-compliant financial systems, but do indicate diversification benefits in high-inflation environments. These findings hold relevance for investors seeking improved hedging strategies against African currency risk and for African policymakers aiming to enhance intra-continental trade, foreign direct investment, and cross-border business expansions.
1. Introduction
‘Black Swans’ are extreme crisis events that are rare and unpredictable with catastrophic consequences that extend across commodity and financial markets (Taleb, Citation2007). Such extreme crisis events are exemplified by the recent COVID-19 pandemic and the ongoing Russia-Ukraine conflict which have resulted in unprecedented movements in the prices of financial assets around the globe. For instance, following the pandemic, gold and Bitcoin hit record high prices of $2,076 and $65,000 on August 2020 and November 2021, respectively, whereas Bitcoin more recently hit a 2-year low during the ongoing Russia-Ukraine conflict. Also, crude oil experienced historic low prices due to the pandemic and geopolitical tensions between Russia and Saudi Arabia in April 2020 (Arif et al., Citation2022) and it is currently experiencing a 14-year high amid the ongoing Russia-Ukraine war. Similarly, stock prices in more developed equity markets reached record low values during the early wave of the pandemic in March–April 2020 which triggered emergency ‘circuit breakers’ that prevented the total collapse of equity markets (Ozkan, Citation2021; Li et al., Citation2021), whereas several emerging and industrialized stock markets recorded historic high prices leading to the ‘market bubble’ of December 2021 and the subsequent ‘2022 stock market decline’ (Kuang & Douady, Citation2022).
Unlike developed equity markets, Africa equity markets were not affected much by the COVID-19 pandemic and ongoing Russia-Ukraine conflict due to their underdeveloped nature and discordance with global equity markets (Boako & Alagidede, Citation2016; Iyke & Ho, Citation2021). However, African currency markets have not been spared from the adverse effects of the most recent black swan events, with many African economies experiencing historic exchange rate lows against the US dollar (Elbany & Elhenawy, Citation2021). For instance, major African currencies such as the Nigerian Naira (₦), Egyptian Pound (E£), have sharply depreciated from ₦360/US$ to ₦915/US$; and E£15.72 to E£30.91, respectively, between March 2020 and December 2023. Some studies attribute the sharp fluctuations experienced in currency markets in emerging and developing countries to geopolitical risks associated with Ukraine-Russia war and monetary policy responses to resulting inflation pressures caused by rising energy and commodity prices (Hui, Citation2022; Aliu et al., Citation2023; Hossain et al., Citation2024). These volatile currency movements are of particular concern for African economies who are heavily dependent on commodity exports and foreign direct investment, and such currency movements affect these economies through their impact on the external balances, public finances, inflation, private consumption, and investment (Atenga & Mougoue, Citation2021). Moreover, African currencies are floated in international currency markets despite having limited liquidity and depth which amplifies the risks associated with currency exposure (Kumah & Odei-Mensah, Citation2022).
An important research question that our paper poses, is whether risks in African currency markets can be hedged by alternative assets such as cryptocurrencies and commodities. On one hand, there has been a surgency of interest in cryptocurrencies as hedging options by investors following their exponential price growth which surpassed that of other investment assets (Phiri, Citation2022). Nadarajah et al. (Citation2021) highlights that Bitcoin is increasing being embraced by African countries such as South Africa, Nigeria and Kenya, who have used these digital currencies to hedge against domestic liquidity problems and reduce cross-border transaction costs. Furthermore, investor interests in digital currencies have significantly risen in Africa over the past few years, with Kumah and Odei-Mensah (Citation2022) reporting a 130% rise in volume of cryptocurrency traded in the continent since 2018. On the other hand, the financialization of commodities has attracted attention from financial investors who view them as an alternative asset class that can be used for diversification purposes (Golub, Citation1983; Basak & Pavlova, Citation2016). Notably, some African countries like South Africa and Nigeria, who are producers and exports of primary commodities like gold and oil, face a devaluation risk of local currency during periods of unstable commodity rises (Wen et al., Citation2020).
Despite the increasing need to identify potential hedges for African countries, the recent literature examining the diversification properties of cryptocurrencies and commodities towards currencies during the pandemic and Ukraine-Russia war have mainly focused on non-African economies (Ji et al., Citation2020; Ding et al., Citation2021; Hsu et al., Citation2021; Adekoya et al., Citation2022; Chen et al., Citation2022; Maghyereh & Abdoh, Citation2022; Antonakakis et al., Citation2023; Hanif et al., Citation2023; Rehman et al., Citation2023; Thai Hung, Citation2023; Raza et al., Citation2024). The only related studies which have focused on African currencies have been conducted before the COVID-19 pandemic and most of these studies present conflicting results (Emenike, Citation2019; Nadarajah et al., Citation2021; Olstad et al., Citation2020; Atenga & Mougoué, Citation2021; Kumah & Odei-Mensah, Citation2022; Okonkwo et al., Citation2021; Opoku et al., Citation2023). Besides, these previous studies have relied on mean-based estimators, such as cross-correlation analysis and GARCH-type models, which cannot capture tail risk connectedness inherent to Black Swan events.
Since extreme movements have been mutually observed in African currencies, bitcoin, gold and oil during the COVID-19 pandemic and Ukraine-Russia war, it is important to examine spillovers and possible hedging opportunities at the tail-end distribution of these financial assets. We therefore use the quantile connectedness framework of Ando et al. (Citation2022) which extends the VAR based connectedness framework Diebold and Yilmaz (Citation2012, Diebold & Yılmaz, Citation2014) using the quantile autoregression (QAR) approach of Koenker and Xiao (Citation2006). A stand-out feature of the QVAR connectedness framework is its ability to capture the statistic and dynamic connectedness between investment assets at different quantiles of distribution. This differs from the traditional connectedness approach which examines spillovers and connectedness between financial assets exclusively on the mean of the conditional distribution. The QVAR allows the researcher to focus on both the median and tail ends of the distribution and thus capture location asymmetric spillovers between different assets under various market conditions corresponding to bull, normal and bear markets. We can therefore test the hypothesis that:
H00: Spillovers and connectedness between African currencies, bitcoin, gold and oil differ at various market states and thus offer asymmetric hedging opportunities.
Further note that we focus our attention on the hedging properties of cryptocurrencies and primary commodities on 4 African currencies, namely; the Algerian Dina, the Nigerian Naira, the South Africa Rand and the Egyptian Pound. Notably these currencies are amongst the most traded in Africa (https://finance.yahoo.com/news/africa-most-traded-currencies-2020-101659895.html) and belong to countries which are ‘leaders’ in Africa in terms of geographic size (Algeria), population size (Nigeria) and technological advancement (South Africa and Egypt). Moreover, Nigeria and Algeria are oil-exporting African countries whereas South Africa and Egypt are oil-importers. Also, Algerian and Egyptian currencies are linked to monetary policy and banking practices based on the Shariah law whilst South Africa and Nigeria have traditional monetary practices and financial systems. Lastly, Egypt and Nigeria (South Africa and Algeria) have mutually experienced high (moderately low) levels of inflation and currency depreciation in the post COVID-19 era. Together, these observations allow us to further test the hypotheses that:
H01: Currency hedging opportunities of bitcoin, gold and oil differ between the currencies of oil-producers and oil-importers in African countries at different states of the markets.
H02: Currency hedging opportunities of bitcoin, gold and oil differ between the currencies of Shariah-linked banking structure and non-Shariah banking structure at different states of the market.
H03: Currency hedging opportunities of bitcoin, gold and oil differ between the currencies in high-inflation and low-inflation environments at different states of the market.
The remainder of this paper is organized as follows. The next section presents the literature review. The third section presents the empirical framework of the study. The fourth section present data and results. The fifth section concludes the study in the form of policy implications and recommendations.
2. Literature review
Theoretically, currency spillovers arise from a clustering of information from news which creates a shock in excess of that caused by market fundamentals and subsequently these shocks spillover into other financial markets through ‘meteor-shower’ effects (Engle et al., Citation1990). The excess volatility spillover between currency and financial markets can be attributed to linkages between real economies through international news, cooperative or competitive monetary policy coordination, and portfolio balance effects (Ito et al., Citation1992). Since the financialization of commodities as trading instruments (Hamilton, Citation1996), other theoretical explanations of commodity-to-currency spillovers have emerged and include: (1) the sticky-price model, which holds that higher commodity prices lead to inflationary pressures on real wages, the price of nontraded goods, and the exchange rate of a commodity-exporting country; and (2) the terms-of-trade model, under which terms-of-trade shocks lead to a shift in the relative demand for an exporter’s currency and therefore in its exchange rate (Sokhanvar & Bouri, Citation2023). Notably, during ‘extreme’ and ‘unanticipated’ events, such as the COVID-19 and the Russian-Ukraine war, financial assets tend to evolve as fat-tail process whose effects are contagious and can spillover to other financial markets resulting in the co-movement of asset prices at their tail-distribution (Taleb, Citation2007). Because fat-tail behavior is non-Gaussian, traditional finance models and mean-based econometric estimation techniques are inefficient in capturing the dynamics of events occurring at the extreme ends of the probability distribution (Taleb, Citation2005).
Most previous studies that have examined spillovers between African currencies and other financial markets have relied on mean-based estimators for empirical purposes and ignored possible tail connectedness. For instance, Emenike (Citation2019) used the multivariate GARCH-BEKK model to examine volatility spillovers amongst three West African currencies (i.e. West African Franc, Gambian Dasi and Nigerian Naira) and find spillover effects amongst the different currency combinations except for the Naira and Dalasi where no spillover effects are observed. Olstad et al. (Citation2020) use the diagonal-BEKK model to examine the volatility spillovers and optimal portfolio weights between oil markets and currencies for top oil-exporting and oil-importing countries (inclusive of five African countries) and find that currency hedging using oil is more effective for oil-exporting countries. Atenga and Mougoué, (Citation2021) investigate the currency spillover between 16 African countries, five emerging markets, and six advanced markets using the Diebold and Yılmaz (Citation2014) VAR-based connectedness approach and find that most African currencies are net receivers of returns and volatility shocks. Okonkwo et al. (Citation2021) presented a wavelet coherence of Bitcoin and five African currencies in time-frequency space and revealed significant hedging properties of Bitcoin for all currencies in the presence of noise.
To the best of our knowledge, only two studies have examined the tail-ended connectedness between African currencies and other financial markets. First, Nadarajah et al. (Citation2021) examine the extreme connectedness between bitcoin and eight African currencies using extreme correlation analysis and a bivariate extreme value model and document evidence in favor of negative co-exceedances or diversification benefits of bitcoin and find little hedging effect (or lack of extreme co-movements). Second, Kumah and Odei-Mensah (Citation2022) examine the spillovers between altcoins and six African fiat currencies using quantile regressions and a quantile-on-quantile approach and find that cryptocurrencies (particularly Ethereum) are suitable diversifiers and hedges of African currencies in the middle and upper quantiles, but not at lower quantiles. Nevertheless, these two studies use techniques that analyze a single point on the tail-end distribution and assume that the rankings of net transmitters and receivers only vary across quantiles but remain static over time (Cappiello et al., Citation2014). Therefore, these studies cannot account for contagion build-up effects, in which connectedness sharply increases over time and is significantly distinct from ‘normal connectedness’ (Forbes & Rigobon, Citation2002; Baur, Citation2003; Rigobón, Citation2019). Moreover, previous African related studies have not examined the spillovers between exchange rates and commodities/cryptocurrencies during the most recent Black Swan events.
Our study thus becomes the first in the literature to examine connectedness between African currencies-bitcoin-gold-oil during the COVID-19 pandemic and the Russia-Ukraine war and builds upon the host of literature which have examined the hedging properties of cryptocurrencies and commodities towards international currencies using data covering the most recent Black Swan episodes. Notably, these studies use more advanced econometric techniques capturing different forms of asymmetries compared to those of previous African literature such as the BEKK-DCC-GARCH model (Hsu et al., Citation2021; Chen et al., Citation2022); cross-quantilogram method (Ji et al., Citation2020); wavelet coherence methods (Maghyereh & Abdoh, Citation2022), conditional Value-at-Risk (CoVarR) copulas (Hanif et al., Citation2023; Rehman et al., Citation2023); the frequency connectedness approach of Baruník and Křehlík (Citation2018) (Ding et al., Citation2021); the TVP connectedness approach of Antonakakis et al. (Citation2020) (Adekoya et al., Citation2022; Antonakakis et al., Citation2023; Thai Hung, Citation2023; Raza et al., Citation2024) and VARX-based connectedness model (Bigerna, Citation2024).
Notably most previous studies come to different conclusions on the hedging benefits of commodities and cryptocurrencies against exchange rates during the Black Swan periods. For instance, Ji et al. (Citation2020; Adekoya et al. (Citation2022); Maghyereh and Abdoh (Citation2022) all find that gold is safe haven during the COVID-19 pandemic for most international currencies, others such as Ding et al. (Citation2021), Hanif et al. (Citation2023) and Raza et al. (Citation2024) find otherwise. Moreover, Hsu et al. (Citation2021) find cryptocurrencies are not diversifiers of exchange rates whilst Rehman et al. (Citation2023) find that Bitcoin is an appropriate hedge for Chinese and Russian currencies. For the case of primary commodities, Thai Hung (Citation2023) finds oil to be a suitable hedge for currencies, Adekoya et al. (Citation2022) finds hedging properties of oil to only exist after the Ukraine-Russia war whilst Chen et al. (Citation2022) and Antonakakis et al. (Citation2023) and Bigerna (Citation2024) more recently find that oil cannot diversify currency risk.
Our study contributes to the literature by examining the tail connectedness between African currencies, bitcoin, gold, and oil using the quantile connectedness approach of Ando et al. (Citation2022). The framework modifies the network connectedness framework of Diebold and Yılmaz (Citation2014) by estimating the VAR model using the quantile autoregressions of Koenker and Xiao (Citation2006) and evaluating dynamic connectedness via forecast error variance decompositions (FEVD) obtained at different quantiles of distribution. Several recent studies have applied the QVAR-based connectedness model to examine returns spillover dynamics within single markets such as currency markets (Bouri et al., Citation2020), equity markets (Shahzad et al., Citation2021), bond markets (Naeem et al., Citation2022a), cryptocurrency markets (Bouri et al., Citation2021; Naeem et al., Citation2022b), energy markets (Chen et al., Citation2022; Jena et al., Citation2022; Su et al., Citation2022) as well as across several markets such as the oil-stock markets (Liu et al., Citation2021; Mensi et al., Citation2021); precious metals-oil-energy markets (Mensi et al., Citation2021), oil-stock markets; Agriculture-energy markets (Tiwari et al., Citation2022), equities-bond-commodities-cryptocurrency markets (Xia et al., Citation2022), commodities, cryptocurrency-energy-stock markets (Yousaf et al., Citation2022). These previous studies focus on the 95th, 50th and 5th quantiles as a measure of connectedness during bulls, normal, and bear markets, respectively. The consensus from these studies is that connectedness is concentrated at the end tails of distribution and the rankings of net transmitters and receivers of tail-end shocks within the system vary across time as well as across different markets. However, with the exception of Su et al. (Citation2022) and Xia et al. (Citation2022), no previous studies have examined tail-connectedness in financial and commodity markets during the Ukraine-Russia war as the most recent ‘extreme event’. Moreover, with the exception of Billah et al. (Citation2022) and Tiwari et al. (Citation2022), previous studies strictly focus on tail connectedness among returns series and ignore volatility spillovers, which are more accurate measures of investor sentiment and crisis build-up (Diebold & Yılmaz, Citation2014). Our study considers these gaps literature and presents a case study for African currencies-bitcoin-gold-oil using both returns and volatility series, focusing on periods covering the ongoing COVID-19 pandemic and the Russia-Ukraine war.
3. Data and methodology
3.1. Data sources and formation
We use daily time series data consisting of the US dollar exchange rates of four major African currencies (Algeria, Egypt, Nigeria, and South Africa), as well as Bitcoin, gold, and crude oil. The data spans from 4 November 2019, to 7 September 2022, covering significant events such as the COVID-19 pandemic and the ongoing Russian-Ukraine conflict, both considered recent black swan events. All data used in this study were sourced from Investing.com and transformed into natural logarithms to calculate the logarithmic differences in asset prices (P) between time t-1 and t, defined as
(1)
(1)
Furthermore, we applied a GARCH (1,1) model to estimate the conditional volatility for each variable. The return process for each variable is assumed to follow an autoregressive process as shown below:
(2)
(2)
Where, εt represents a vector of white noise, conditional on the information available at time t-1, denoted as εt |It-1 and assumed to have a normal distribution with a mean of zero. The conditional variance, ht, follows a univariate GARCH (1,1) process as described by:
(3)
(3)
The parameters α and β are non-negative, representing the ARCH and GARCH terms, respectively. Subsequently, the conditional volatility, ht, is utilized as a proxy for the volatility series in our analysis.
3.2. Summary statistics
The preliminary analysis first explores the descriptive statistical properties of the financial assets considered in this study. reports both the descriptive statistics and unit root test for return (Panel A) and volatility (Panel B) results. Panel A shows that the average daily returns of African currencies are positive during this period. This finding suggests that African currencies depreciated against the US dollar. Among these currencies, Nigeria (0.084%) and South Africa (0.076%) experience the highest average daily depreciation. Simultaneously, the returns for Bitcoin, gold, and crude oil grew by an average of 0.067, 0.039, and 0.198%, respectively. The level of volatility, as measured by the standard deviation, shows that Bitcoin, gold, and crude oil are more volatile than African currencies. Among African currencies, the highest volatility is found in South Africa (0.988%) and Nigeria (0.698%).
Table 1. Summary statistics.
Skewness and kurtosis coefficients indicate that the distribution of asset returns is far from normal. It is also observed that Bitcoin, gold and crude oil returns exhibit negative skewness while African currency returns are positively skewed as well as leptokurtic distribution. Furthermore, the Augmented Dickey-Fuller (ADF) and Phillips-Perron (PP) tests show that the asset return series are stationary, implying that the null hypothesis of the unit root is rejected for all the series. We also reported the ARCH and Ljung-Box tests, which show the presence of heteroscedasticity and autocorrelation, respectively. Heteroscedasticity and autocorrelation justified the use of the GARCH model to evaluate the volatility of asset returns.
Panel B shows an analysis of the volatility properties of each asset. Similar to the results in panel A, it is observed that, on average, Bitcoin (16.631) and crude oil (12.876) are more volatile than African currencies. Among African currencies, the highest daily volatility is recorded in South Africa (0.877), followed by Nigeria (0.496), while the lowest volatility is found in Algeria (0.055). Again, the unit root test shows that all the volatility series are stationary. In addition, the ARCH and Ljung-Box tests show that the volatility series does not exhibit heteroscedasticity and autocorrelation, which confirms the robustness of GARCH model in capturing the volatility behaviour of the series.
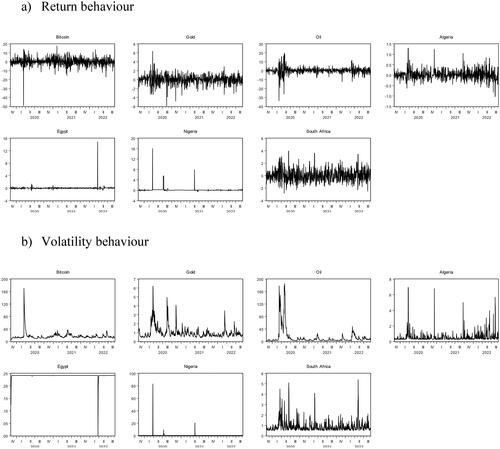
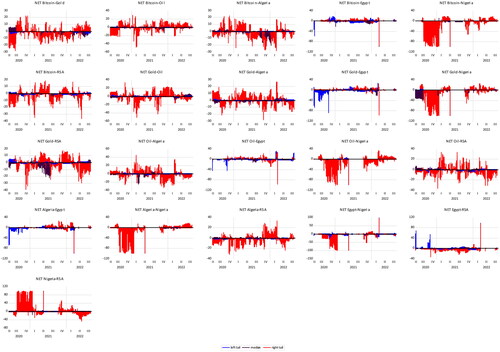
To further explore the behaviour of the return and volatility series over the sample period, plots their evolution. One key piece of evidence from this figure is that both the return and volatility series exhibit clustering behaviour. This behaviour is particularly visible given the number of spikes at the beginning of the COVID-19 as well as the Russian-Ukraine war. This finding is consistent with the results of the ARCH and Ljung-Box tests, and also supports the need to consider extreme events, which is the goal of this study. In addition, it confirms the fit of the estimated GARCH model for the data series. Following this finding, we outline the quantile connectedness approach to study the spillover and connectedness effects between Bitcoin, gold, crude oil, and African currencies.
Figure 1. Evolution of return and volatility of each asset. (a) Return behaviour. (b) Volatility behaviour.
3.3. Methodology
We use the QVAR model to estimate both the connectedness in returns and volatility, as well as their directional spillage. To compute connectedness matrices, we express the QVAR(p) as an infinite-order Vector Moving Average (MA) representation, defined as follows:
(4)
(4)
where
and
are n × 1 dimensional vectors representing returns and conditional volatility from EquationEquations (1)
(1)
(1) and Equation(2)
(2)
(2) . The parameter τ denotes the quantile of interest, varying between [0,1]. Specifically, we examine the 5th, 50th, and 95th quantiles, corresponding to lower (bearish), median (normal), and upper (bullish) market conditions. The variable p represents the lag length of the QVAR model, μ(τ) stands for the n × 1 dimensional conditional mean vector, and Φj (τ) is an n × n dimensional coefficient matrix.
Following Koop et al. (Citation1996) and Pesaran and Shin (Citation1998), we specify the Generalized Forecast Error Variance Decomposition (GFEVD) framework with an H-step-ahead forecast horizon as:
(5)
(5)
where
is a zero vector with unity at the i^th position. We normalize each element in the decomposition matrix as:
(6)
(6)
We employ the framework introduced by Diebold and Yilmaz (Citation2012, Citation2014) to assess connectedness and risk spillovers based on GFEVD. The Total Connectedness Index (TCI) at quantile (τ) is calculated as:
(7)
(7)
This measures the level of connectedness among variables, with a higher TCI indicating greater connectedness. The spillover direction from asset (j) to asset (i) at a given quantile is expressed as:
(8)
(8)
Similarly, we determine the spillover direction from asset (j) to asset (i) as:
(9)
(9)
The net spillover at each quantile is obtained by the difference between the total directional connectedness ‘To’ and ‘From’ others:
(10)
(10)
In accordance with EquationEquation (9)(9)
(9) , a positive net value signifies that the asset in question is a net transmitter, whereas a negative value indicates a net receiver.
4. Empirical analysis
Our empirical analysis is conducted in two steps. First, we estimate the QVAR model at an optimal lag of 1, as determined by the AIC and BIC for both the return and volatility series at the 5th, 50th and 95th quantiles. We extract the forecast error variance decomposition (FEVD) of the estimated QVARs at a forecast horizon of 10 days and create a connectedness table that summarizes (i) pairwise directional connectedness, (ii) total directional connectedness to and from others, and (iii) total network connectedness (Diebold & Yilmaz, Citation2009). These connectedness measures have different uses for market participants and regulators. For instance, investors and fund managers would be more interested in pairwise directional spillover effects for risk management and asset portfolio allocation, whereas market regulators are more concerned with monitoring system-wide connectedness and identifying which markets contribute the most to systemic risks (Diebold & Yılmaz, Citation2014).
Second, we applied rolling regression analysis to each of the estimated QVARs using a window size of 150 days. Note that we have collected our dataset in foresight, so that our rolling window begins at the declaration of COVID-19 as a pandemic by the World Health Organization (WHO) in 11 March, 2020, and ends in September 2022, which is seven months into the Russia-Ukraine conflict. We consider the rolling regression analysis important because there were several events that could have impacted market-specific spillovers and total connectedness in the ‘new era’, ranging from the announcement of various variants of the COVID-19 pandemic, the stock and oil market crashes between March and April 2020, the approval of COVID-19 vaccination in December 2020, the US presidential elections of November 2021, and the ensuing US capitol hills attacks of January 2022, as well as the more recent invasion of Russia into Ukraine in February 2022 (Ozkan, Citation2021; Li et al., Citation2021; Arif et al., Citation2022; Kuang & Douady, Citation2022). These events could have altered the structure of returns and volatility connectedness between markets, as well as the ranking of net transmitter receivers and transmitters within the systems.
Our use of the quantile-connectedness approach allows us to examine market spillover effects in different states of the market. Whilst the 5th and 95th quantiles measure connectedness at extreme ends of market co-movement, it is important to note that the interpretation of ‘market state’ for the returns and volatility series differ. For the returns series, which consists of extreme negative and positive values, the left-tail (right-tail) connectedness measures spillover effects during bear (bull) markets, while the median quantile measures tranquil markets. Conversely, for the volatility series, which consists of non-negative values, the left-tail (right-tail) connectedness measures the spillover effects during periods of zero or extremely low (extremely high) volatility levels, while the median quantile measures moderate volatility. Most previous studies using similar methodology only focus on returns connectedness (Bouri et al., Citation2021; Shahzad et al., Citation2021; Naeem et al., Citation2022a; Naeem et al., Citation2022b, Chen et al., Citation2022; Jena et al., Citation2022; Liu et al., Citation2021; Mensi et al., Citation2021; Su et al., Citation2022; Tiwari et al., Citation2022; Xia et al., Citation2022; Yousaf et al., Citation2022) Extending the analysis for volatility connectedness is important because this measure directly reflects investors sentiments and is more sensitive to crisis build-up (Diebold & Yılmaz, Citation2014).
4.1. Static connectedness
We first present the findings of our static analysis and report the connectedness tables for the returns () and volatility () series at the 5th, 50th and 95th quantiles of the distribution. The connectedness plots ( and ) summarize the strength of the directional spillover effects between markets and further segregate the net transmitters from the receivers within the network at different states of the market.
Figure 2. Connectedness plot for returns at 0.05, 0.50 and 0.95 quantiles.
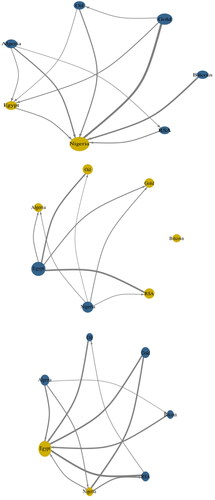
Figure 3. Connectedness plot for volatility at 0.05, 0.50 and 0.95 quantiles.
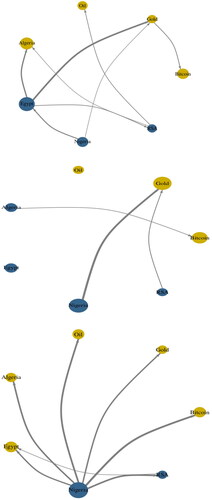
Table 2. Quantile connectedness table for returns series.
Table 3. Quantile connectedness table for volatility series.
For the returns series, the total connectedness index (TCI) is higher at the lower (80.39) and upper (76.91) tail ends while being lowest at the middle (24.45) quantile, suggesting that connectedness is higher during bulls and bear markets than during tranquil markets (Bouri et al., Citation2020; Jena et al., Citation2022; Yousaf et al., Citation2022 for similar findings albeit for various financial and commodity markets). We further observe switching dynamics between net transmitters and receivers at different quantiles within the system, with Bitcoin, Gold, Oil, Algerian Dinar, and South African Rand (Egyptian Pound and Nigerian Naira) being net transmitters (receivers) of shocks at the tail end of the distribution while changing to net receivers (transmitters) at the median quantile.
The spillover and connectedness effects of volatility series differ from those of return series. First, the TCI is more than twice as high in the upper quantile (82.34) compared to the lower (33.25) and median (14.95) quantiles, which is a finding similar to that observed by Billah et al. (Citation2022) and Tiwari et al. (Citation2022), albeit for volatility connectedness in NFT’s and stock markets, respectively. Second, currencies (cryptocurrency and commodities) are the main transmitters (recipients) of systemic shocks at all quantiles of the distribution. In particular, the Egyptian Pound (Algerian Dinar, Gold, and Oil) is (are) the main transmitter (receiver) of volatility shocks during bear markets, while the Nigerian Naira (Algerian Dinar, Gold, and Oil) is (are) the main transmitter (receiver) in the normal and bull markets.
These findings obtained so far have several important implications. For instance, the connectedness dynamics observed at the median quantiles for both the returns and volatility series are contrary to those at the tail extremities. Therefore, investors who make risk management and portfolio selection decisions based on median-based estimates will provide incorrect inferences if markets enter extreme states. For example, Mensi et al. (Citation2017) and Adi et al. (Citation2022) used mean-based estimators to find that Egypt and Nigeria are net receivers of volatility shocks from oil (i.e. oil can be used to hedge these currencies), whereas our study shows that at the extreme ends, these currencies are net transmitters of shocks (i.e. oil is not a hedge for African currencies). Similarly, Rehman et al. (Citation2023) show high oil and gold returns and volatility spillover effects to the South African Rand (i.e. commodities are a good hedge for the Rand), whereas our findings highlight the opposite during extreme periods.
Further based on country groupings, we fail to find evidence that supports the hypothesis that Sariah-based currencies (Egyptian pound and Algerian Lira) offer any hedging advantages over currencies linked to traditional ‘financial systems’ (Nigeria and South Africa). Similar findings are presented by Bigerna (Citation2024) who find that MENA currencies cannot be hedged by oil and gold in the post-COVID-19 era. Moreover, we also fail to find that the currencies of oil-producing countries offer better hedges against financial assets compared to those of non-oil-producing countries, and this goes against the findings of Olstad et al. (Citation2020) which reveal that oil-producing countries can hedge their currencies in commodities, however, in the pre-COVID period. Lastly, we note that currencies linked to high-inflation countries (Egypt and Nigeria) are those which derive diversification benefits from hedging in commodities and cryptocurrencies whilst such benefits are absent for currencies in low-inflation environments i.e. Algeria and South Africa. Raza et al. (Citation2024) similarly note that higher inflation environments associated with the heightened geopolitical risk can magnify the diversification benefits of precious metals to industrialised countries.
While these results presented so far are intuitive, the analysis presented thus far has been static and does not provide information on time-varying spillovers among the markets within the system network.
4.2. Dynamic total connectedness analysis
We now present the time-varying TCI for returns and volatility series which are plotted in and , respectively, and mutually show stronger connectedness at the tail end of the distribution throughout the sample period. For the returns series, connectedness is more dominant at the left-tail (Bouri et al., Citation2020; Jena et al., Citation2022;) although we observe some periods of stronger connectedness at the right-tail mainly corresponding to the ‘bulls market’ experienced in financial and commodity sectors between (i) January 2021 – March 2021 period (i.e. vaccination approval and initial distribution period) (ii) oil market boom of June 2021 (iii) November 2021–December 2022 period (US elections and presidential announcement) and (iv) February–March 2022 (start of the Ukraine-Russia war). Conversely, for the volatility series, connectedness is much stronger at the 95th quantile over the entire sample period except during the market ‘boom-bust’ episodes in June 2021 and January 2022, periods where connectedness at the 5th and 95th quantiles increase sharply and are of similar strength.
Figure 4. Total connectedness returns.
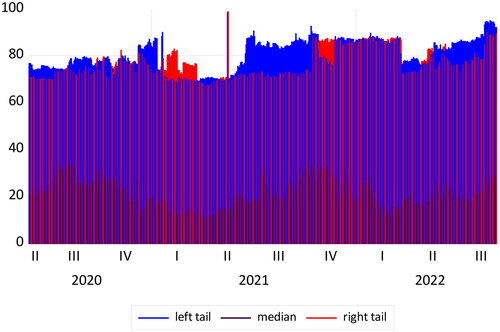
Figure 5. Total connectedness volatility.
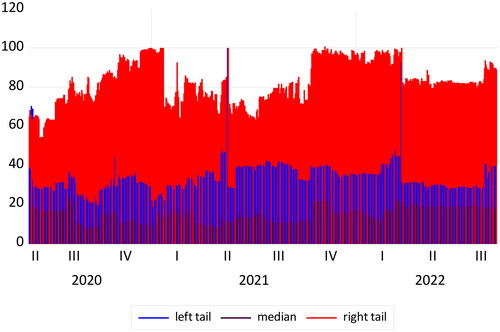
To measure systemic market fragility further, we follow Ando et al. (Citation2022) and compute the time-varying 5% relative tail dependence (RTD) index for both returns and volatility series (i.e. TCIτ=0.95 – TCIτ=0.05). From the results plotted in , we observe increasing RTD levels in both returns and volatility series during market boom periods corresponding to the vaccination approval period, US presidential elections, and Russia’s invasion of Ukraine. We interpret these results to indicate higher financial fragility during these episodes. To gain further insights on tail connectedness among the markets, reports the correlation coefficients between the TCI at the 5th, 50th and 95th quantiles for the returns and volatility across five sub-periods corresponding to (i) oil and stock market crash period of March – May 2020; (ii) gradual ease of lockdowns as well as vaccination announcement and initiation/induction period of December 2020 – March 2021; (iii) commodity market boom period of June 2021 following the rebound from the global shutdown, and (iv) US presidential elections of November 2021 – January 2022 (v) Ukraine-Russia conflict of February 2022 onwards. While the full sample correlations indicate positive pairwise co-movements between the TCI’s, the sub-sample periods provide evidence of negative pairwise correlations, particularly during (i) the vaccination induction period for volatility and ii) the US presidential elections and insurrection periods, and in both these episodes, the TCI’s at the 5th and 95th moved in opposite directions. This suggests that, during ‘major events’, market participants disproportionately focus on the events occurring at the tail end while ignoring information emulating from the opposite end of the tail. This has important implications for market regulators, as it suggests that the market herding behaviour experienced during periods of financial panic can be more effectively measured by tracking the co-movement of the left and right tails of systemic market connectedness.
Figure 6. (a) RTD_returns. (b) RTD_volatility.
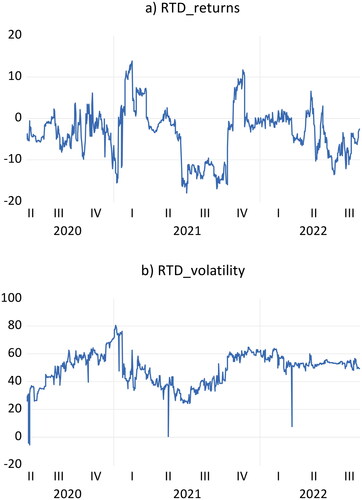
Table 4. Correlation coefficients between TCI at different quantiles and sub-periods.
4.3. Dynamic net spillover effects for individual markets
We now present the time-varying total net spillover effects of each individual market for the returns and volatility series in and for the 5th (blue contour), 50th (black contour), and 95th (red contours) quantiles, respectively. Judging by color contours, markets can be either net receivers or transmitters, depending on the phase of the market cycle. For instance, we observe that most markets are net transmitters (receivers) of return shocks during bear markets (normal periods), that is, Bitcoin, gold, oil, the Algerian Dinar, and the South African Rand, while the opposite occurs for the Egyptian Pound and Nigerian Naira, which are net transmitters (receivers) of return shocks during normal markets (bear periods). In other words, Bitcoin, gold, and oil are significant hedges against most African currencies during bear markets (and not during tranquil periods), and therefore offer tail-risk hedging opportunities on currency returns during sharp market slumps.
Figure 7. Net returns connectedness.
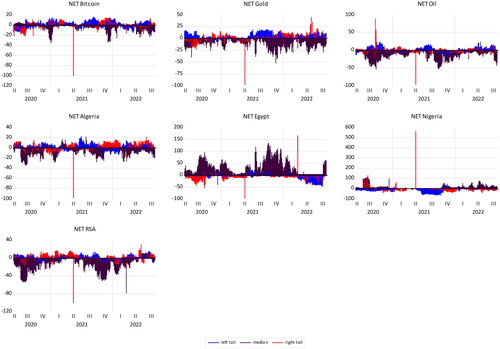
Figure 8. Net volatility connectedness.
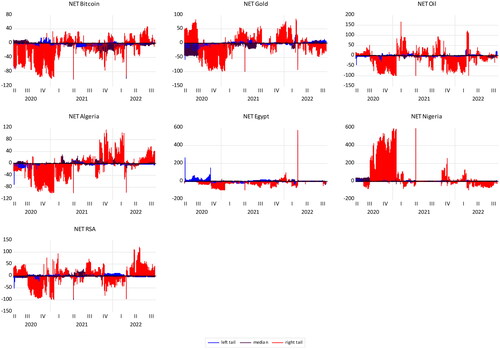
Conversely, for the volatility series, net spillover effects dominantly exist at the right tails, although the dynamics for various markets differ over time and events. For instance, during the stock and oil market crash period of early March – April 2020, most markets were net receivers of tail-end volatility shocks, except for gold, oil, and the Egyptian Pound and South African Rand. However, during the vaccination induction period of December 2020 – March 2021, the naira is the dominant transmitter of volatility shocks with other markets being net receivers, whereas during the US election period of November 2021 – January 2022, Gold, the Dinar, the Naira, and to a lesser extent Bitcoin are net transmitters, while the remaining markets are net receivers. Lastly, we observe switching dynamics in net spillover effects after the start of the Ukraine-Russia war, in which Bitcoin, Egypt, Algeria, and South Africa (Nigeria) switch from net receivers (transmitters) to net transmitters (receivers) of volatility shocks. Altogether, these findings highlight the fact that the net volatility spillover effects of individual markets do not only vary across market states but also across time/events, while cryptocurrencies and commodities could have provided sufficient hedging benefits against tail-risk currency volatility before the Ukraine-Russia war. Such hedging benefits are only observable for Bitcoin after the start of the war.
Finally, we present time-varying pairwise net spillover effects markets to evaluate the possible hedging properties of cryptocurrency and commodities against currency risk at the microlevel. While the pairwise spillover between most markets for both return and volatility series is prominent throughout the entire sample period at different quantiles, we observe exceptionally little net return spillover effects between the Naira and (i) Bitcoin, (ii) Oil (iii) Dinar (iv) South African Rand (), on the one hand, and little net volatility spillover effects between the Naira and (i) Gold (ii) Dinar as well as between the Egyptian Pound and (i) Bitcoin (ii) Gold (iii) Oil Dinar the Naira ().
Figure 9. Country-specific connectedness (returns).
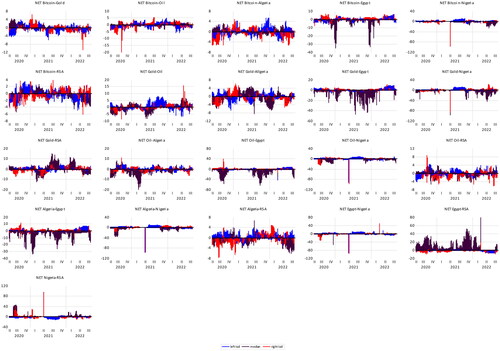
Figure 10. Country-specific connectedness (volatility).
Note that our time-varying spillovers do not differ much from those obtained by the static connectedness analysis as they both imply that here are exploitable tail-risk hedging benefits of cryptocurrency and commodities against the Naira and the Egyptian pounds during extreme events. For the South African Rand and the Dinar, there are only tail-hedge benefits against the Naira and the Egyptian Pound, but not against Bitcoin, gold, and oil. Collectively, these results imply that during the recent Black Swan episodes (i) Sariah-based currencies (Egyptian pound and Algerian Lira) do not offer any hedging advantages over currencies linked to traditional ‘financial systems’ (Nigeria and South Africa) (ii) currencies of oil-producing countries do not offer better hedges against financial assets compared to those of non-oil-producing countries and vice versa (iii) currencies linked to high-inflation (low-inflation) countries can (cannot) derive diversification benefits from hedging in commodities and cryptocurrencies.
5. Conclusions
Following the COVID-19 outbreak, African currencies, bitcoin, gold and oil markets have exhibited tail-end behavior reflected in periodic ‘bull and bear’ cycles which are distinguishable from tranquil market dynamics. Whilst tail-end behavior in individual markets is evident, it is yet to be determined whether there exist systemic tail-end co-movements between African currencies and cryptocurrencies/commodities markets in a network structure. To this end, our study uses a QVAR based approach to modelling tail-end spillovers and connectedness effects amongst African currencies and cryptocurrencies/commodities markets with the purpose of identifying system-wide and pairwise spillovers amongst these markets across a series of ‘extreme events’ experienced between 4 November 2019 and 7 September 2022.
Our study identifies three ‘boom-bust’ periods in which tail-connectedness is more pronounced amongst the markets. First, the stock and oil market crashes in April 2020 were attributed to the abrupt shutdown of the world economy in response to the outbreak of the disease, which was followed by a sharp boom in markets following the approval of the COVID-19 vaccination in December 2020, stretching to March 2020. Second, the ‘great market boom’ experienced during the presidential race and elections between November 2020 and January 2021, with markets experiencing a bust following the January 6th capitol hill attacks. Lastly, at the start of the ongoing Russia-Ukraine war, when many commodities experienced boom markets, African currencies sharply deteriorated against the US dollar. At each of these extreme co-movements, left-tail and right-tail connectedness are found to be negatively correlated, thus reflecting the momentum herding type of behavior by market participants towards information emulating from one tail end while ignoring information associated with the opposite tail event.
The study further distinguished the net transmitters from the net receivers of systemic tail-end shocks to evaluate whether there exist any hedging benefits of cryptocurrency and commodity assets against African currency tail risk along the series of extreme events. From a system-wide perspective, we find the Egyptian Pound and the Naira (cryptocurrencies and commodities) to be net transmitters (receivers) of returns shocks during both bull and bear markets. However, the findings of the pairwise net spillover effects further show weak connectedness or strong hedging capabilities at all quantiles of distribution for the Egyptian Pound and Nigerian Naira against Bitcoin, gold, and oil (gold) for episodes prior (subsequent) to the Russian-Ukraine conflict. Moreover, we observe the tail-end hedging benefits of the Egyptian Pound and Nigerian Naira against the Rand and Dinar, but not for the latter currencies against cryptocurrency and commodities.
Four main economic institutions emerge from our findings. Firstly, tail-end connectedness has been prominent in the post COVID-19 era and further magnified during the Ukraine-Russia war. Secondly, currencies based on Shariah-compliant financial and banking systems do not offer more hedging benefits from Bitcoin, oil and gold compared to currencies based on traditional financial and banking systems. Thirdly, currencies in either oil-exporting or oil-importing countries do no influence the diversification benefits gained from commodities and cryptocurrencies. Lastly, hedging properties of commodities and cryptocurrencies are more prominent in countries with high-inflation environments and are absent in countries with low-inflation rates.
Overall, our findings are relevant to market participants and policymakers, who have become increasingly interested in exploring tail-risk hedge strategies to capitalize on sharp downside market swings and increase investment payoffs during extreme market movements. Our results show that traders of currencies in high-inflation environments such as Naira and the Egyptian Pound can benefit from tail-risk hedging opportunities in Bitcoin, gold and oil,. These findings are also important for policymakers since several member states linked to the AfCFTA are currently experiencing high, double-digit inflation rates and hence the diversification benefits from cryptocurrencies and commodities can pay a role in reducing currency risk in cross-border trading and investment activities.
The main shortcoming of our study is the small number of markets included in the network analysis. Therefore, a natural avenue for future research would be to apply high-dimensional network models, such as the recently introduced quantile network autoregressive (QNAR) model, to examine tail-risk spillovers for a larger sample of African currencies. Also considering that low-inflation countries cannot derive any hedging benefits from commodities and cryptocurrencies, then future research can be conducted against a wider range of possible hedging instruments such as green assets and high-tech stocks.
Author contributions
Thobekile Qabhobho: Conceptualization; validation; writing-original draft;. Cwayita Mpuku: Data curation; investigation. Izunna Anyikwa: Formal analysis, investigation, methodology, validation, writing-original draft. Andrew Phiri: Conectualization, Formal analysis, writing-review, and editing; Investigation, Methodology, Project Administration, Supervision, Writing-original draft.
Acknowledgment
No funding was received for the research.
Disclosure statement
No potential conflict of interest was reported by the author(s).
Data availability statement
The data is available from the authors upon reasonable request.
Additional information
Notes on contributors
Thobekile Qabhobho
Thobekile Qabhobho is a senior lecturer with the Department of Economics at the Nelson Mandela University, South Africa who has research interests in Applied Econometrics, Monetary Economics, International Finance and Macroeconomics.
Cwayita Mpuku
Cwayita Mpuku is a lecturer with the Department of Economics at the Nelson Mandela University, South Africa who has research interests in Monetary Economics, Financial Economics and Macroeconomics.
Izunna Anyikwa
Izunna Anyikwa is a research fellow with the Department of Economics at the Nelson Mandela University, South Africa and is an expert with years of research experience in the field of financial market, investment, international trade, development economics, applied econometrics and macroeconomics.
Andrew Phiri
Andrew Phiri, who is the corresponding author to this manuscript, is an associate professor with the Department of Economics at the Nelson Mandela University, South Africa who enjoys a wide range of publications in international journals with research interests mainly in macroeconomics, applied econometrics and financial economics.
References
- Adekoya, O., Oliyide, J., Yaya, A., & Al-Faryan, M. (2022). Does oil connect differently with prominent assets during war? Analysis of intra-day data using Russia-Ukraine saga. Resources Policy, 77, 1. https://doi.org/10.1016/j.resourpol.2022.102728
- Adi, A., Adda, S., & Wobilor, A. (2022). Shocks and volatility transmission between oil price and Nigeria’s exchange rate. SN Business & Economics, 2(6), e47. https://doi.org/10.1007/s43546-022-00228-z
- Aliu, F., Hašková, S., & Bajra, U. Q. (2023). Consequences of Russian invasion on Ukraine: evidence from foreign exchange rates. The Journal of Risk Finance, 24(1), 40–22. https://doi.org/10.1108/JRF-05-2022-0127
- Ando, T., Greenwood-Nimmo, M., & Shin, Y. (2022). Quantile connectedness: Modelling tail behaviour in the topology of financial markets. Management Science, 68(4), 2401–2431. https://doi.org/10.1287/mnsc.2021.3984
- Antonakakis, N., Chatziantoniou, I., & Gabauer, D. (2020). Refined measures of dynamic connectedness based on time-varying parameter vector autoregressions. Journal of Risk and Financial Management, 13(4), 84. https://doi.org/10.3390/jrfm13040084
- Antonakakis, N., Cunado, J., Filis, G., Gabauer, D., & de Gracia, F. (2023). Dynamic connectedness among the implied volatilities of oil prices and financial assets: New evidence of the COVID-19 pandemic. International Review of Economics & Finance, 83, 114–123. https://doi.org/10.1016/j.iref.2022.08.009
- Arif, M., Naeem, M., Farid, S., Nepal, R., & Jamasb, T. (2022). Diversifier or more? Hedge and safe haven properties of green bonds during COVID-19. Energy Policy, 168, e113102. https://doi.org/10.1016/j.enpol.2022.113102
- Atenga, E. M. E., & Mougoué, M. (2021). Return and volatility spillovers to African currencies markets. Journal of International Financial Markets, Institutions and Money, 73, 101348. https://doi.org/10.1016/j.intfin.2021.101348
- Baruník, J., & Křehlík, T. (2018). Measuring the frequency dynamics of financial connectedness and systemic risk. Journal of Financial Econometrics, 16(2), 271–296. https://doi.org/10.1093/jjfinec/nby001
- Baur, D. (2003). Testing for contagion - mean and volatility contagion. Journal of Multinational Financial Management, 13(4–5), 405–422. https://doi.org/10.1016/S1042-444X(03)00018-5
- Basak, S., & Pavlova, A. (2016). A model of financialization of commodities. The Journal of Finance, 71(4), 1511–1556. https://doi.org/10.1111/jofi.12408
- Bigerna, S. (2024). Connectedness analysis of oil price shocks, inflation, and exchange rate for the MENA region countries. Resources Policy, 88, 104344. https://doi.org/10.1016/j.resourpol.2023.104344
- Billah, M., Karim, S., Naeem, M and., & Vigne, S. (2022). Return and volatility spillovers between energy and BRIC markets: Evidence from quantile connectedness. Research in International Business and Finance, 62, e101680. https://doi.org/10.1016/j.ribaf.2022.101680
- Boako, G., & Alagidede, P. (2016). African stock markets convergence: Regional and global analysis. Finance Research Letters, 18, 317–321. https://doi.org/10.1016/j.frl.2016.05.007
- Bouri, E., Lucey, B., Saeed, T., & Vo, X. (2020). Extreme spillovers across Asian-pacific currencies: A quantile-based analysis. International Review of Financial Analysis, 72, e101605. https://doi.org/10.1016/j.irfa.2020.101605
- Bouri, E., Saeed, T., Vo, X., & Roubaud, D. (2021). Quantile connectedness in the cryptocurrency market. Journal of International Financial Markets, Institutions and Money, 71, e101302. https://doi.org/10.1016/j.intfin.2021.101302
- Cappiello, L., Gerard, B., Kadareja, A., & Manganelli, S. (2014). Measuring comovements by regression quantiles. Journal of Financial Econometrics, 12(4), 645–678. https://doi.org/10.1093/jjfinec/nbu009
- Chen, J., Liang, Z., Ding, Q., & Liu, Z. (2022). Quantile connectedness between energy, metal and carbon markets. International Review of Financial Analysis, 83, e102282. https://doi.org/10.1016/j.irfa.2022.102282
- Diebold, F., & Yilmaz, K. (2009). Measuring financial asset return and volatility spillovers, with application to global equity markets. The Economic Journal, 119(534), 158–171. https://doi.org/10.1111/j.1468-0297.2008.02208.x
- Diebold, F. X., & Yılmaz, K. (2012). Better to give than to receive: Predictive directional measurement of volatility spillovers. International Journal of forecasting, 28(1), 57–66. https://doi.org/10.1016/j.ijforecast.2011.02.006
- Diebold, F. X., & Yılmaz, K. (2014). On the network topology of variance decompositions: Measuring the connectedness of financial firms. Journal of Econometrics, 182(1), 119–134. https://doi.org/10.1016/j.jeconom.2014.04.012
- Ding, Q., Huang, J., & Chen, J. (2021). Dynamic and frequency-domain risk spillovers among oil, gold, and foreign exchange markets: Evidence from implied volatility. Energy Economics, 102, 105514. https://doi.org/10.1016/j.eneco.2021.105514
- Elbany, M., & Elhenawy, Y. (2021). Analyzing the ultimate impact of COVID-19 in Africa. Case Studies on Transport Policy, 9(2), 796–804. https://doi.org/10.1016/j.cstp.2021.03.016
- Emenike, K. (2019). Exchange rate volatility in West African countries: Is there a shred of spillover? International Journal of Emerging Markets, 13(6), 1457–1474. https://doi.org/10.1108/IJoEM-08-2017-0312
- Engle, R. (2002). Dynamic conditional correlation: A simple class of multivariate generalized autoregressive conditional heteroscedasticity models. Journal of Business & Economic Statistics, 20(3), 339–350. https://doi.org/10.1198/073500102288618487
- Engle, R., Ito, T., & Lin, W. L. (1990). Meteor showers or heat waves? Heteroskedastic intra-daily volatility in the foreign exchange market. Econometrica, 58(3), 525–542. https://doi.org/10.2307/2938189
- Forbes, K., & Rigobon, R. (2002). No contagion, only interdependence: Measuring stock market comovements. The Journal of Finance, 57(5), 2223–2261. https://doi.org/10.1111/0022-1082.00494
- Golub, S. (1983). Oil prices and exchange rates. The Economic Journal, 93(371), 576–593. https://doi.org/10.2307/2232396
- Hamilton, J. (1996). This is what happened to the oil price-macroeconomy relationship. Journal of Monetary Economics, 38(2), 215–220. https://doi.org/10.1016/S0304-3932(96)01282-2
- Hanif, W., Mensi, W., Alomari, M., & Andraz, J. (2023). Downside and upside risk spillovers between precious metals and currency markets: Evidence from before and during the COVID-19 crisis. Resources Policy, 81, 103350. https://doi.org/10.1016/j.resourpol.2023.103350
- Hossain, A. T., Masum, A. A., & Saadi, S. (2024). The impact of geopolitical risks on foreign exchange markets: Evidence from the Russia–Ukraine war. Finance Research Letters, 59, 104750. https://doi.org/10.1016/j.frl.2023.104750
- Hsu, S. H., Sheu, C., & Yoon, J. (2021). Risk spillovers between cryptocurrencies and traditional currencies and gold under different global economic conditions. The North American Journal of Economics and Finance, 57, 101443. https://doi.org/10.1016/j.najef.2021.101443
- Hui, H. C. (2022). The long-run effects of geopolitical risk on foreign exchange markets: Evidence from some ASEAN countries. International Journal of Emerging Markets, 17(6), 1543–1564. https://doi.org/10.1108/IJOEM-08-2020-1001
- Ito, T., Engle, R. F., & Lin, W. L. (1992). Where does the meteor shower come from?: The role of stochastic policy coordination. Journal of International Economics, 32(3–4), 221–240. https://doi.org/10.1016/0022-1996(92)90018-F
- Iyke, B., & Ho, S. (2021). Investor attention on COVID-19 and African stock returns. MethodsX, 8, e101195. https://doi.org/10.1016/j.mex.2020.101195
- Jena, S., Tiwari, A., Abakah, E., & Hammoudeh, S. (2022). The connectedness in the world petroleum futures markets using a Quantile VAR approach. Journal of Commodity Markets, 27, e100222. https://doi.org/10.1016/j.jcomm.2021.100222
- Ji, Q., Zhang, D., & Zhao, Y. (2020). Searching for safe-haven assets during the COVID-19 pandemic. International Review of Financial Analysis, 71, 101526. https://doi.org/10.1016/j.irfa.2020.101526
- Koenker, R., & Xiao, Z. (2006). Quantile autoregression. Journal of the American Statistical Association, 101(475), 980–990. https://doi.org/10.1198/016214506000000672
- Koop, G., Pesaran, M. H., & Potter, S. M. (1996). Impulse response analysis in nonlinear multivariate models. Journal of Econometrics, 74(1), 119–147. https://doi.org/10.1016/0304-4076(95)01753-4
- Kuang, Y., & Douady, R. (2022). Has the market started to collapse or will it resist? Stats, 5(2), 401–407. https://doi.org/10.3390/stats5020023
- Kumah, S., & Odei-Mensah, J. (2022). Can altcoins become viable alternatives to African fiat currencies? International Journal of Development Issues, 21(1), 24–53. https://doi.org/10.1108/IJDI-04-2021-0088
- Li, Y., Zhuang, X., Wang, J., & Dong, Z. (2021). Analysis of the impact of COVID-19 pandemic on G20 stock markets. The North American Journal of Economics and Finance, 58, e101530. https://doi.org/10.1016/j.najef.2021.101530
- Liu, Z., Shi, X., Zhai, P., Wu, S., Ding, Z., & Zhou, Y. (2021). Tail risk connectedness in the oil-stock nexus: Evidence from a novel quantile spillover approach. Resources Policy, 74, 102381. https://doi.org/10.1016/j.resourpol.2021.102381
- Maghyereh, A., & Abdoh, H. (2022). COVID-19 pandemic and volatility interdependence between gold and financial assets. Applied Economics, 54(13), 1473–1486. https://doi.org/10.1080/00036846.2021.1977774
- Mensi, W., Hammoudeh, S., Shahzad, S., Al-Yahyaee, K., & Shahbaz, M. (2017). Oil and foreign exchange market tail dependence and risk spillovers from MENA. Emerging and developed countries: VMD decomposition based copulas. Energy Economics, 67, 476–495. https://doi.org/10.1016/j.eneco.2017.08.036
- Mensi, W., Lee, Y., Vo, X., & Yoon, S. (2021). Quantile connectedness among gold, gold mining, silver, oil and energy sector uncertainty indexes. Resources Policy, 74, e102450. https://doi.org/10.1016/j.resourpol.2021.102450
- Mensi, W., Ali, S., Vo, X., & Kang, S. (2022). Multiscale dependence, spillovers, and connectedness between precious metals and currency markets: A hedge and safe-haven analysis. Resources Policy, 77, 102752. https://doi.org/10.1016/j.resourpol.2022.102752
- Nadarajah, S., Afuecheta, E., & Chan, S. (2021). Dependence between bitcoin and African currencies. Quality & Quantity, 55(4), 1203–1218. https://doi.org/10.1007/s11135-020-01051-0
- Naeem, M., Billah, M., Marei, M., & Balli, F. (2022a). Quantile connectedness between Sukuk bonds and the impact of COVID-19. Applied Economics Letters, 29(15), 1378–1387. https://doi.org/10.1080/13504851.2021.1934384
- Naeem, M. A., Qureshi, S., Rehman, M. U., & Balli, F. (2022b). COVID-19 and cryptocurrencies market: Evidence from quantile connectedness. Applied Economics, 54(3), 280–306. https://doi.org/10.1080/00036846.2021.1950908
- Okonkwo, C., Osu, B., Chighoub, F., & Oruh, B. (2021). The co-movement of bitcoin and some African currencies – a wavelet analysis. Journal of Research in Emerging Markets, 3(3), 81–93. https://doi.org/10.30585/jrems.v3i3.687
- Olstad, A., Filis, G., & Degiannakis, S. (2020). Oil and currency volatilities: Co-movements and hedging opportunities. International Journal of Finance & Economics, 26(2), 2351–2374. https://doi.org/10.1002/ijfe.1911
- Opoku, R., Adam, A., Isshaq, Z., & Owusu Junior, P. (2023). Time-varying connectedness and contagion between commodity prices and exchange rate in Sub-Saharan Africa. Cogent Economics & Finance, 11(2), 2237714. https://doi.org/10.1080/23322039.2023.2237714
- Ozkan, O. (2021). Impact of COVID-19 on stock market efficiency: Evidence from developed countries. Research in International Business and Finance, 58, e101445. https://doi.org/10.1016/j.ribaf.2021.101445
- Pesaran, H. H., & Shin, Y. (1998). Generalized impulse response analysis in linear multivariate models. Economics Letters, 58(1), 17–29. https://doi.org/10.1016/S0165-1765(97)00214-0
- Phiri, A. (2022). Can wavelets produce a clearer picture of weak-form market efficiency in Bitcoin? Eurasian Economic Review, 12(3), 373–386. https://doi.org/10.1007/s40822-022-00214-8
- Raza, S. A., Guesmi, K., Benkraiem, R., & Anwar, R. (2024). Precious metals and currency markets during the Russia-Ukraine conflict’s inflationary periods. Research in International Business and Finance, 67, 102138. https://doi.org/10.1016/j.ribaf.2023.102138
- Rehman, M., Katsiampa, P., Zeitun, R., & Vo, X. (2023). Conditional dependence structure and risk spillovers between bitcoin and fiat currencies. Emerging Markets Review, 55, 100966. https://doi.org/10.1016/j.ememar.2022.100966
- Rigobón, R. (2019). Contagion, spillover, and interdependence. Economía, 19(2), 69–99. https://doi.org/10.1353/eco.2019.0002
- Shahzad, S., Bouri, E., Kristoufek, L., & Saeed, T. (2021). Impact of the COVID-19 outbreak on the US equity sectors: Evidence from quantile return spillovers. Financial Innovation, 7(1), 14. https://doi.org/10.1186/s40854-021-00228-2
- Shahzad, S., & Naifar, N. (2022). Dependence dynamics of Islamic and conventional equity sectors: What do we learn from the decoupling hypothesis and COVID-19 pandemic? The North American Journal of Economics and Finance, 59, 101635. https://doi.org/10.1016/j.najef.2021.101635
- Sokhanvar, A., & Bouri, E. (2023). Commodity price shocks related to the war in Ukraine and exchange rates of commodity exporters and importers. Borsa Istanbul Review, 23(1), 44–54. https://doi.org/10.1016/j.bir.2022.09.001
- Su, C., Yuan, X., Umar, M., & Chang, T. (2022). Dynamic price linkage of energies in transformation: Evidence from quantile connectedness. Resources Policy, 78, e102886. https://doi.org/10.1016/j.resourpol.2022.102886
- Taleb, N. N. (2005). The roots of unfairness: The black swan in arts and literature. Literary Research/Recherche Litteraire, 21(41–42), 241–254.
- Taleb, N. N. (2007). Black swans and the domains of statistics. The American Statistician, 61(3), 198–200. https://doi.org/10.1198/000313007X219996
- Thai Hung, N. (2023). Time-varying connectedness and causality between oil prices and G7 economies exchange rates. Evidence from the COVID-19 and Russia-Ukraine crises. Studies in Economics and Finance, 40(5), 814–838. https://doi.org/10.1108/SEF-04-2023-0184
- Tiwari, A., Abakah, E., Adewuyi, A., & Lee, C. (2022). Quantile apillovers between energy and agriculture commodity markets: Evidence from pre and during COVID-19 outbreak. Energy Economics, 113, e106235. https://doi.org/10.1016/j.eneco.2022.106235
- Trabelsi, N., Umar, Z., Dogah, K., & Vo, X. (2024). Are investment grade Sukuks decoupled from the conventional yield curve? International Review of Financial Analysis, 91, 102981. https://doi.org/10.1016/j.irfa.2023.102981
- Wen, D., Liu, L., Ma, C., & Wang, Y. (2020). Extreme risk spillovers between crude oil prices and the US exchange rate: Evidence from oil-exporting and oil-importing countries. Energy, 212, 118740. https://doi.org/10.1016/j.energy.2020.118740
- Xia, Y., Li, J., & Fu, Y. (2022). Mare non-fungible tokens (NFTs) different asset classes? Evidence from quantile connectedness approach. Finance Research Letters, 49, e103156. https://doi.org/10.1016/j.frl.2022.103156
- Yousaf, I., Youssef, M., & Goodell, J. (2022). Quantile connectedness between sentiment and financial markets: Evidence form the S&P 500 twitter sentiment index. International Review of Financial Analysis, 83, e102322. https://doi.org/10.1016/j.irfa.2022.102322