
 ?Mathematical formulae have been encoded as MathML and are displayed in this HTML version using MathJax in order to improve their display. Uncheck the box to turn MathJax off. This feature requires Javascript. Click on a formula to zoom.
Abstract
South Africa’s heavy reliance on fossil fuels has posed significant challenges to environmental sustainability, primarily due to the associated climate change concerns. To combat these issues, the South African government has turned to technological innovation. However, research examining the combined impact of technology and energy use on environmental quality in the country remains scarce. This study aims to fill this gap by utilizing a novel dynamic autoregressive distributed lag (DARDL) simulation framework to analyze the influence of various factors on CO2 emissions from 1960 to 2020. Key findings include that technological innovation contributes to CO2 emission reduction over both short and long terms. The "scale effect" exacerbates emissions, while the "technique effect" mitigates them, aligning with the environmental Kuznets curve (EKC) hypothesis. Additionally, energy consumption, foreign direct investment, and industrial value-added have adverse impacts on environmental quality. Surprisingly, increased trade openness, despite short-term benefits, proves detrimental to the environment over the long term, supporting the pollution haven hypothesis (PHH). In light of these findings, the study emphasizes the vital role of technological innovation in achieving energy security and ecological integrity. South Africa’s government and policymakers should consider this as a clean technology source to address climate change and bolster environmental sustainability.
Reviewing Editor:
1. Introduction
The ideas of climate change and global warming are widely accepted as the biggest risks to the existence of all species on Earth (Asif et al., Citation2023a, Citation2023b, Citation2023c; Irfan et al., Citation2021a). Since the dawn of history, economic and environmental enterprises have coexisted; yet, as human development has advanced, it has significantly aggravated the environment by increasing carbon dioxide emissions (CO2 emissions) (Ali et al., Citation2022; Udeagha & Ngepah, Citation2022a). The world is presently struggling with the negative effects of ecological exposures and deterioration, which cause despair for the majority of people, wildlife, and ecosystems everywhere due to the absence of suitable governmental initiatives (Ali et al., Citation2022). Therefore, by considering a variety of important contributors like renewable energy, technological advancement, export performance, and productivity growth, reducing CO2 emissions as a means of creating a sustainable and environmentally friendly world has emerged as a worthwhile pursuit for contemporary researchers (Islam et al., Citation2022; Ali et al., Citation2022; Khalid et al., Citation2021). The Sustainable Development Goals (SDGs) that the UN has proposed to be achieved by 2030 also emphasize the need for affordable and renewable technologies, broad-based and environmentally friendly productivity expansion, and technical innovation as ways to immediately address global warming (Udeagha & Ngepah, Citation2022b). The 2021 United Nations (UN) Climate Change Conference (COP26), held in Glasgow, United Kingdom, brought together a number of high-ranking decision-makers from all over the world to discuss the major problems brought on by global warming. In order to guarantee cooperation for sustained progress toward the Paris Agreement and UN Framework Convention on Climate Change, the conference’s declared aim is to limit the increase in global temperatures to 1.5 degrees Celsius over pre-industrial levels (United Nations Climate Change, Citation2021). According to the Intergovernmental Panel on Climate Change (IPCC), global emissions must reach net zero by at least 2050 for there to continue to be "high confidence" that temperature increases would be maintained to tolerable levels. Therefore, minimizing CO2 emissions as an approach to achieving a green and sustainable world has become a desirable target for modern researchers by taking into account a range of contributing factors including technological innovation and renewable energy sources (Khalid & Jalil, Citation2019; Khalid & Ozdeser, Citation2021; Zheng et al., Citation2022).
The World Health Organization (WHO) declared a Public Health Emergency of Global Significance for the pneumonia epidemic triggered by the newly discovered coronavirus (2019- nCoV) on January 30, 2020. As an encapsulated single-stranded RNA virus, it can cause everything from modest (cold-like) symptoms to serious respiratory, digestive, hepatic, and neurological problems (Irfan et al., Citation2022a). The existing evidence indicates that the COVID-19 virus is primarily transmitted by respiratory droplets and direct contact. COVID-19 can cause a variety of symptoms, including fever, breathing difficulties, a dry cough, and lung infections that spread to both lungs. Globally, COVID-19 is becoming more prevalent, which has major effects on macroeconomics as well as social protection for certain people, particularly in low-income nations. The COVID-19 epidemic has been causing uproar and fear since 2020. When pandemics flare up, there are typically many fatalities and significant economic losses on a worldwide scale (Yang et al., Citation2021a). Many nations, including South Africa, used "lockdown" strategies to prevent its fast spread in 2020. Global patterns of energy consumption have been significantly affected by government actions during the COVID-19 pandemic, including the closure of international borders, the confinement of individuals to their homes, and limits on movement and gathering. The International Energy Agency (IEA) details how economic unrest, travel restrictions, and lockdowns have an impact on the world’s energy consumption in its latest Global Energy Review 2020 publication (International Energy Agency, Citation2020). Despite the fact that the coronavirus (COVID-19) pandemic reduced CO2 emissions by 5.4% in 2020 as a result of travel restrictions, emissions are expected to increase in the near future as a result of escalating globalization, rising foreign direct investment (FDI), and the resulting rise in energy consumption in numerous formerly energy-poor geographic areas (Udeagha & Muchapondwa, Citation2022a).
Carbon emissions caused by extensive fossil fuel use since the industrial revolution have severely damaged environmental quality and worsened the world’s climate. Advancements in technology are thought to play a key role in improving energy efficiency, lowering energy use, and minimizing CO2 emissions (Tang et al., Citation2022). As Udeagha and Ngepah (Citation2022c) have demonstrated, it offers the nation significant possibilities to meet the energy obligation by enabling the nation to change from fossil-fuelled based energy resources to renewables; enables the nation to reach higher productivity levels with a reasonable level of energy; and stimulates better overall innovative thinking promoting more entrepreneurial ventures through enhanced market access and growing competition. By expanding access to global commodity markets, technological progress can attract new capital, increase production, and boost employment and real wages (Obobisa et al., Citation2022). Additionally, it promotes wise resource management, which leads to greater productivity growth. The massive accumulation of resource factors, knowledge spillovers, and the spread of technological breakthrough may be the eventual consequences (Udeagha & Ngepah, Citation2022d). Enhancing the use of technology is essential for promoting a green economy and helping to reduce emissions of growing CO2. Pollution and the consumption of fossil fuels are reduced by the use of electric vehicles, hybrid technologies, and renewable energy sources (Irfan et al., Citation2020; Citation2021c; Lin & Ma, Citation2022). As shown by Irfan et al. (Citation2022b), efficient use of inclusive green financing is essential for promoting sustainable economic development, stimulating green initiatives, and combating global warming. The mediating effects show that the main transmission mechanisms through which green finance affects green innovation are economic growth, investment in R&D, and industrial structure.
In recent years, academics from all around the world have been increasingly interested in how technological progress affects the environment. Innovative initiatives might include developing cutting-edge and superior items (goods and services) or processes, a novel marketing plan, or a modern organizational approach to corporate governance, workplace design, or close connections. To qualify as innovative, the manufacturing process should be novel or technologically sophisticated. This is because innovative technologies have been shown in several empirical works to improve ecological integrity. However, according to some studies, technological development has sped up the rate of environmental deterioration (Atsu et al., Citation2021; Udeagha & Muchapondwa, Citation2023a). According to research by the Intergovernmental Panel on Climate Change (IPCC, Citation2018), initiatives to advance environmental standards and technological advancement might reduce the quantity of anthropogenic emissions released into the atmosphere. However, the most common and improved measures are research and development (R&D) engagements and patent solutions (Kuang et al., Citation2022). This dynamic integration, which may assist shift energy supplies from non-renewable sources to ones that are more effective and ecologically responsible, heavily depends on technological improvements (Rahman et al., Citation2022).
On the one hand, on October 29, 2010, the Technological Innovation Agency (TIA) of South Africa was founded to help the country in championing and speeding up technological progress so that it could be advanced and deployed to improve the economy and the high quality of life for all South Africans (Van Zyl, Citation2011). The goal of the organization is to spur innovation in order to address the varying demands of South Africa and the entire African continent, as the generation of new, context-specific knowledge is an essential element of technology adoption. A significant factor in this uncommon situation is South Africa’s young population, with a median age of about 20 years. The intriguing prospect for transformation in the structure and content of postsecondary education and training is offered by this particular generation. It also underlines the value of a combined technical education system that is led by the government and industry. The notable appeal for South Africa to take part the BRIC countries confirmed the growing relations between that country and Brazil, China, Russia, and India. This move signals another step for the nation’s advancement of technology innovation and change. Additional considerations where home-grown technological advance might have a consequence include healthcare reform, how societal change influences livelihood opportunities, and how the financial meltdown in the "advanced economies" disrupts the world market and aid. These problems have been addressed in various ways by South Africa. The Department of Science and Technology first developed the "Ten-Year Innovation Plan of South Africa" in 2008 to "impact the overall South Africa’s progression towards a knowledge-based workforce, in which the manufacturing and diffusion of information leads to economic benefits and enriches all fields of human endeavour." The 2007 National Industrial Policy Framework Industrial Policy Action Plan, which also set the objective of halving unemployment and poverty by 2014 with rapid growth of at least 6% starting in 2010, also outlines the government’s comprehensive industrialization strategy. South Africa’s Accelerated and Shared Growth Initiative includes this strategy. Last but not least, one of the ten strategic priorities stipulated in the Presidency’s Medium-Term Strategic Framework, which was unveiled in July 2009, is the requirement to boost economic growth and restructure the economy to produce respectable employment and higher quality of life." The TIA could be viewed as a group that helps the key knowledge providers and the social and corporate entrepreneurs communicate with one another. To bridge this gap, the agency will employ a range of techniques, as indicated in its founding document. The modification of human ingenuity, the exploitation of local and international partnerships, and the development of the country’s dynamic capacities are some of these instruments. Meanwhile, technological advancements and progress in South Africa have substantially reduced CO2 emissions in the following ways: (i) the creation of carbon-emission-reducing end-to-end pipeline architectures, (ii) the utilization of energy-efficient processing methods, and (iii) modifications to fuel mixing and oil combination modernization. Through each of these avenues, innovative technology improves energy efficiency, which significantly lowers the nation’s carbon pollution. More crucially, South Africa’s sizeable investments in R&D and pace of innovation are among the factors that have contributed significantly to the improvement of the nation’s environmental stewardship. Additionally, the nation has established a number of policies to create strong technologies that are essential to reducing the intensity of emissions from industrial activities and other commercial sectors that entail high emissions as part of a significant strategy to combat environmental damage. These characteristics make South Africa an excellent choice for our study, which looks at how technological innovation and energy use jointly affect ecological quality.
South Africa, on the other hand, is a part of the BRICS (Brazil, Russia, India, and China) alliance and one of the largest emerging markets. Even though its tertiary service sectors (including financial services, rental properties, and professional services) have grown in prominence, the country’s primary and secondary industries include mineral extraction, industrial production, and transportation—continue to make a major contribution to the GDP (Statistics South Africa, Citation2019). In contrast to other BRICS countries, South Africa’s economy has given a lot of weight on coal as an energy source. Moreover 80% of South Africa’s electricity comes from coal, while only 7% comes from renewable sources (African Development Bank Group, Citation2019; Udeagha & Ngepah, Citation2019). Despite international organizations mandating the use of renewable energy and a reduction in coal mining, replacing all of South Africa’s coal-fired power stations is incredibly challenging. Reviewing energy policy in light of the present political, social, economic, and environmental conditions is another step in the evaluation of an alternate power source (Udeagha & Ngepah, Citation2020). However, a global comparison of South Africa’s greenhouse gas (GHG) emissions suggests that it has one of the most carbon-intensive economies globally. In actuality, South Africa is the most carbon-intensive developing country that does not produce any oil, excluding island countries, based on per capita CO2 equivalent emissions in 2010 (EIA, Citation2010). Furthermore, South Africa is the largest emitter on the African continent, producing 42% of total GHG emissions. South Africa produces more CO2 than the whole Sub-Saharan African (SSA) continent (EIA, Citation2010). In 2000, South Africa was reported to have produced 461 million tons CO2 equivalent of greenhouse gas emissions, 83% of which were connected to energy supply and consumption, 7% to industrial operations, 8% to agricultural, and 2% to waste. Since fuel combustion accounts for 81 percent of the industry’s emissions and fugitive emissions from fuel account for the remaining 19%, the energy sector is by far the largest contributor to emissions in the nation with 380,988Gg CO2. One factor that significantly contributed to South Africa’s extremely high energy-related emission levels was the pre-democratic government’s deliberate promotion of investment in energy-intensive sectors of the economy, such as aluminium and other non-ferrous metal beneficiation (the so-called "mineral-energy complex," identified by Fine & Rustomjee, Citation1996), prior to 1994. Another reason for South Africa’s high emissions is the carbon intensity of its heavily coal-based electrical generation base, which accounts for 90% of all emissions (Udeagha & Ngepah, Citation2021a). South Africa is the world’s 14th largest emitter of GHGs, and a heavy reliance on coal is to blame for the majority of her CO2 emissions. Unveiling a draft power plan, however, indicates a significant shift away from the fuel and toward gas and renewable energy sources. Despite the fact that coal will continue to play a role for decades, the plan calls for no new plants to be built after 2030 and the shutdown of four-fifths of the capacity by 2050. The country has also agreed to peak its emissions between 2020 and 2025, allowing them to stabilize for around ten years before starting to drop. During the Conference of the Parties (COP26) in Glasgow, the US, UK, France, Germany, and the EU proposed to provide South Africa $8.5 billion to help the country reduce its reliance on coal. (https://www.bbc.com/news/world-africa-59135169). This paradigm-shifting event has the potential to aid the country in gradually shutting down its coal-fired power facilities and converting to renewable energy sources, which would reduce greenhouse gas emissions. In light of the evidence provided above, South Africa makes a strong case for consideration in separate research that investigates the combined influence of technological innovation and energy use on pollutant emissions.
The present study distinguishes itself from earlier research by addressing several critical limitations in the existing body of knowledge regarding the interactions between technological innovation, energy usage, and their impacts on environmental quality in the South African context. This research concentrates specifically on South Africa. First, prior studies often generalize findings to a global or regional level, potentially overlooking the unique challenges and dynamics of individual countries. By exploring this relationship within a South African context, the study provides insights that are more tailored to the nation’s specific environmental and economic circumstances. Second, unlike prior research that predominantly employed conventional ARDL frameworks and other cointegration techniques, this study adopts Jordan and Philips (Citation2018) dynamic ARDL simulations approach. This advanced technique enables researchers to model and forecast positive and negative changes in the data while assessing both short-term and long-term relationships between variables. This methodological innovation enhances the robustness of the analysis. The study introduces a novel aspect by applying the frequency domain causality (FDC) approach, as suggested by Breitung and Candelon (Citation2006). FDC is a more sophisticated and comprehensive method for assessing causality between variables over various time scales, including long, short, and medium terms. It provides a more complete understanding of how technological innovation and energy consumption influence environmental quality in different temporal dimensions. Also, unlike earlier works, this study accounts for structural breaks that can influence the relationships between technological advancement, energy usage, and CO2 emissions. Structural breaks are chronic in economic and environmental data, and ignoring them can lead to unreliable and inconsistent results. By addressing this issue, the research contributes to more accurate and reliable findings. This study delves into multiple factors, including technological innovation, trade openness, industrial growth, foreign direct investment, technique effect, and scale effect, to thoroughly understand their effects on CO2 emissions in South Africa. The comprehensive approach offers a nuanced perspective on the complexities of transitioning to a green economy in the region. In summary, the study offers an innovative perspective on how technological innovation and energy consumption influence environmental quality in the South African context. Its unique geographical focus, advanced methodology, consideration of structural breaks, and comprehensive analysis of key factors contribute to a richer understanding of this complex relationship, setting it apart from earlier research in the field.
Furthermore, previous studies that have explored the link between technological innovation and CO2 emissions, while considering trade openness, often relied on a simplified trade proxy, which has been criticized for its limited representation of the complex environmental impact of trade openness. Typically, these studies used trade intensity (TI), which is calculated as the ratio of a country’s total trade (exports plus imports) to its GDP, to measure trade openness. However, this measure of trade openness has significant limitations. It primarily reflects a nation’s relative trade performance within its own economy but fails to capture the true extent of a nation’s engagement in international trade or its ecological consequences. This results in an inaccurate representation of the environmental effects of trade openness. One notable issue with the TI-based measure is its tendency to classify larger and more prosperous economies as "closed" simply because they have higher GDPs. For example, emerging countries like South Africa, Japan, China, France, the United States, Germany, and others are unfairly labeled as closed economies. Meanwhile, less developed nations with lower GDPs, such as Togo, Nigeria, Ghana, Uganda, Venezuela, Zambia, and Zimbabwe, are inaccurately categorized as open economies. This misclassification obscures the real environmental impact of trade openness, as it penalizes economically successful countries for their higher GDPs while falsely labeling economically challenged nations as open. Consequently, relying solely on TI to represent trade openness not only oversimplifies the concept but also introduces significant distortions in classifying countries, particularly in the context of environmental analysis. It is evident that the limitations of the TI-based measure warrant a more comprehensive and accurate approach to assessing trade openness and its environmental implications.
Taking into consideration the aforementioned gaps in the literature, this research seeks to address significant gaps in the existing literature by systematically examining the combined effects of technological innovation and energy consumption on environmental quality in South Africa from 1960 to 2020 within the framework of the Environmental Kuznets Curve (EKC). The study makes several notable contributions: first, the research contributes theoretically by exploring the existence of the EKC theory when considering the joint influence of technological innovation and energy usage within the South African context. This is a novel and essential addition to the literature, as earlier studies often focused on individual components or neglected this specific combination. Second, the study introduces a unique approach by employing the dynamic autoregressive distributed lag (DARDL) simulations framework. This methodology allows for a comprehensive investigation of the relationships between key variables such as technological innovation, energy consumption, and CO2 emissions in South Africa. This is a notable departure from conventional approaches and opens the door for a more nuanced understanding of the dynamics involved. This approach also offers the advantage of visualizing and predicting positive and negative data variations instantly. It also allows for an in-depth examination of both short- and long-term connections among the variables being studied. This is a significant improvement over the conventional ARDL technique, addressing its limitations and providing more reliable and objective results. Third, while environmental and economic studies often encompass a global or regional scope, this research concentrates specifically on South Africa. This in-depth, localized analysis is crucial because different countries may have distinct challenges, priorities, and policy implications when transitioning to a green economy. The study explores a range of significant variables, including technological innovation, trade openness, industrial growth, foreign direct investment, and the technique and scale effects. This comprehensive approach can offer a more complete understanding of the factors influencing CO2 emissions in South Africa. Fourth, the study enhances methodological scholarship by employing the FDC strategy. This approach, recommended by Breitung and Candelon (Citation2006), is particularly effective in assessing sustained causality between variables over various timeframes, including short, medium, and long terms. By considering both short and long-term effects, the research takes into account the time dimension of environmental policies and technological transitions. This provides more realistic and nuanced insights into the impacts of these factors. The research employs second-generation econometric methodologies to accurately consider and capture the effects of structural breaks. Previous studies often ignored this aspect. Recognizing these structural breaks is crucial, as they are known to have a lasting impact on various macroeconomic indicators. The study conducts structural break unit root tests, following Narayan and Popp’s method, to ensure the reliability of results. Finally, this research introduces a novel and innovative measure of trade openness based on the work of Squalli and Wilson (Citation2011) to investigate the relationship between technological innovation and environmental quality while accounting for trade openness. Unlike previous studies that relied on the conventional trade intensity measure, this approach considers two dimensions of trade openness: the contribution of trade to GDP and trade size relative to foreign markets. This more comprehensive measure offers a unique perspective on the impact of trade openness. In summary, this research presents a comprehensive and innovative approach to understanding the complex interplay between technological innovation, energy consumption, and environmental quality. Its contributions encompass theoretical advancements, methodological innovations, structural break considerations, and a novel trade openness measure, collectively enhancing the scholarly landscape in this field. Thus, the research’s novelty lies in its localized, comprehensive, and forward-looking approach to understanding the green transition in South Africa. It considers various key factors, examines both short and long-term impacts, and provides actionable policy recommendations, setting it apart from other studies in the field.
The remaining sections of the article are arranged as follows. The literature on the relationship between technological advancement and CO2 emissions is reviewed in Section 2. The material and methodology are presented in Section 3; the findings are covered in Section 4. Section 5 concludes with policy implications.
2. Literature review and summarizing knowledge gap
This part is broken up into two subsections in this investigation. In the first subsection, we explore and provide scientific investigations on the connection between technological advancement and environmental quality, and in the second subsection, we summarize the gaps in the literature.
2.1. Review of previous literature
The influence that technical innovation plays in improving ecological integrity has only been the subject of a few studies globally. However, the findings of these studies are frequently inconsistent and contradictory across a range of analytic settings and regions under investigation. While some studies revealed that technological innovation may enhance the environment in a number of ways, other authors have made the case that advancing technology worsens the status of the environment.
For an example, Rafique et al. (Citation2022) looked into empirical interrelations between the use of renewable energy, foreign direct investment, medium- and high-tech industries, economic complexity, human capital, power distance, uncertainty avoidance, and masculinity versus femininity in the sample of 76 Belt and Road economies. Using series spanning the years 1996 through 2019, a complete framework for econometric testing was developed that made use of both the generalized method of moments and the moments quantile regression methodology. The authors’ initial predictions that medium and high-tech industries, as opposed to FDI, influenced the diffusion of low-carbon energy across sectors were corroborated by related data. The use of renewable energy is negatively impacted by changes in human capital. To integrate those results into future energy planning, the authors provided a number of policy recommendations as well as a methodological note. Similarly, Lin and Ma (Citation2022) used information on 264 prefecture-level Chinese cities from 2006 to 2017 to examine the impact of the urban innovation environment on the effect of technical advancements on CO2 emissions. The empirical results demonstrated that various city types are impacted by technological improvements in different ways. Prior to 2010, the effect on Chinese cities was negligible, however after 2010, technological developments may contribute to a decrease in CO2 emissions. Second, technical developments can indirectly reduce CO2 emissions by enhancing economic processes. Thirdly, when the environment for urban innovation is taken into consideration, government expenditure cannot significantly change the marginal impact of technological advancements. Similar to this, Obobisa et al. (Citation2022), who identified institutional excellence and technological innovation as effective approaches to reduce carbon emissions and achieve sustainable development, looked at how each contributed to emissions reductions in 25 African countries between 2000 and 2018. The authors claim that the usage of renewable energy and technological advancement significantly cut CO2 emissions. On the other hand, the effectiveness of institutions, the growth of the economy, and the reliance on fossil fuels as a source of energy have a negative impact on CO2 emissions. The authors recommended that in order for African countries to achieve their objectives for sustainable development, they increase their investment in technical innovation and renewable energy projects. Additionally, Kuang et al. (Citation2022) used panel data to analyze the link between technical development, renewable energy, and CO2 emissions in China from 1990 to 2018 and found that these factors had a long-term, significant negative impact on CO2 emissions. Furthermore, there is little proof that technical innovation and economic progress are related in the near run. The application of technical innovation has advantageous externalities, according to the authors. Rahman et al. (Citation2022) examined the importance of contributing variables for CO2 emissions decrease in the 22 most industrialized nations globally throughout the 1990–2018 data period. The researchers discovered that both export-quality and renewable energy help to lower CO2 emissions. Contrary to the negative shocks or counterincentives of these variables, which lead to an increase in CO2 emissions, the positive stimuli of technological innovation as measured by research and development investment and export quality index reduce these emissions. Additionally, using data from 1991 to 2018, Habiba et al. (Citation2022) investigated the impacts of financial advancement, technological advancement, and the use of renewable energy on carbon emissions for the top twelve emitters. Future technical advancements and the use of renewable energy sources will play a major role in reducing CO2 emissions, with the use of non-renewable energy sources steadily declining. The authors recommended efforts to minimize CO2 emissions in order to achieve sustainable development based on their findings. Using second-generation time-series panel data methodologies, Vitenu-Sackey and Acheampong (Citation2022) investigated the effects of economic policy uncertainty (EPU) and technological advancement on CO2 emissions in a panel of 18 industrialized nations from 2005 to 2018. To manage heterogeneity, endogeneity, and simultaneity in the panels, the authors utilized three reliable long-run estimators: two-stage least squares (2SLS), panel generalized method of moments (GMM), and generalized least squares (GLS). They found that economic expansion significantly and favourably affected CO2 emissions, but that this effect peaked at a certain rate of growth and then dropped, indicating that the sample had an inverted U-shaped environmental Kuznets curve (EKC) connection. Second, different countries have different effects of EPU on CO2 emissions. For instance, whereas high levels of EPU have a significant impact in high-pollution countries, they have less effect in low-pollution nations. Third, several factors, including urbanization, the use of renewable energy sources, and research and development (R&D), all have an impact on CO2 emissions. The authors emphasized that even in industrialized nations, there is a varied link between carbon emissions and economic indicators. The pollution halo effect holds true for low-pollution countries whereas the pollution haven hypothesis (PHH) holds true in high-pollution ones. A one-size-fits-all strategy for reducing emissions, according to the study’s authors, is not the best course of action because, in the face of erratic economic policies, not every country’s rate of urbanization, FDI inflows, R&D expenditures, and use of renewable energy directly affect CO2 emissions.
Furthermore, Adebayo et al. (Citation2022) employed cutting-edge Morlet wavelet analysis to offer a fresh perspective on the dynamic connection between CO2 emissions and economic growth, the use of renewable energy, trade openness, and technological innovation in the Portuguese economy. The study applied continuous wavelet transform, wavelet correlation, multiple and partial wavelet coherence, and frequency domain causality analysis to the variables under inquiry using a dataset between 1980 and 2019. With time, the markers’ links get stronger. In the frequency domain, they also found significant lead and lag linkages and wavelet coherence, while conflicting interactions between the variables were seen in the time domain. The economic argument that using renewable energy decreases CO2 emissions while trade openness, technological innovation, and economic expansion raise CO2 emissions is supported by the wavelet analysis. The results showed that long-term CO2 reduction in Portugal will result from the use of renewable energy. The government of Portugal should support energy innovation, stimulate investment in renewable energy sources, and pass limiting laws. Chhabra et al. (Citation2022) examined how trade openness and technological development assisted middle-income countries in lowering their CO2 emissions to enhance the environment. The generalized method of moments (GMM) technique and the Dumitrescu-Hurlin causality test were employed, respectively, to estimate the long-run relationship between variables and explore causality for a sample of 23 middle-income countries from 1994 to 2018. Their study refuted the inverted u-shape relationship between innovation and CO2 emissions. According to research on business, lower middle-income countries saw environmental deterioration more quickly than upper middle-income ones. The environment Kuznets curve (EKC) theory, on the other hand, was also supported by the data for both nation groups; however, the fall in the EKC curve is minimal for low- and middle-income nations arguing that low-income and middle-income countries should put more of an emphasis than they have in the past on green innovation in order to reduce the rapidly increasing CO2 emissions. The authors suggested establishing pollution standards for the commercial and industrial sectors, which generate the most waste that is contaminated, as well as promoting economic expansion through knowledge spillovers. Additionally, Li et al. (Citation2022) assert that technology innovation undoubtedly makes a substantial contribution to expanding employment opportunities, fostering green economic activity, and promoting environmental sustainability. The authors looked at the effect of technological development and energy efficiency on CO2 emissions for China from 1991 to 2019 using nonlinear autoregressive distributed lag (NARDL). Their research showed how technological advancement and energy efficiency may reduce China’s CO2 emissions. Energy efficiency and technological innovation are important nonlinear contributors to CO2 emissions. Technology developments and energy efficiency improvements aid in the reduction of CO2 emissions, but their decrease has a long-term detrimental effect on CO2 emissions in China.
According to Wang et al. (Citation2022), China’s high technology (high-tech) industry has developed to occupy a crucial strategic place in the country’s economic goals. Because of this stance, FDI and technological innovation have become strong pillars of the high-tech industry. Although it is still debatable, concerns regarding the carbon emissions of the sector are growing. In this context, the authors looked at how FDI and technological development affected carbon emissions in the high-tech industry from 28 Chinese regions. The study used information on Chinese provinces from 2000 to 2018. The authors also examined unit root properties, structural breaks, and cointegration in addition to using quantile regression to assess long-run correlations across study variables. The findings demonstrated that FDI had a detrimental impact on carbon emissions. While the next six quantiles of technological innovation suffer badly, the first three are positively affected. The authors claim that FDI and technological development have changed the energy intensity in the high-tech industry, which has an effect on the amount of carbon dioxide emitted over time. After controlling the impacts of urbanization, energy intensity, and economic development, their study revealed that policymakers should concentrate on the varied effects of FDI and technology-led emissions at different quantiles during the process of reducing CO2 emissions. Abid et al. (Citation2022) examined the impacts of technological development, economic growth, foreign direct investment, energy use, and urbanization on carbon emission in G8 member countries using data from 1990 to 2019. Their results indicated a significant cross-sectional dependency among the panel nations. The FMLOS estimator identified a statistically significant long run and negative association between foreign direct investment, financial development, and technical innovation in G8 countries. Long-term bidirectional causal linkages have been discovered to exist between economic growth, financial development, urbanization, trade openness, CO2 emissions, and energy consumption; however, there is only a one-way causal relationship between carbon emissions and foreign direct investment. The authors opined that high-quality foreign direct investment is now necessary for the G8 countries to experience economic expansion, industry growth, and technological advancement. Stronger controls are required in these countries due to urbanization’s considerable contribution to environmental degradation.
In addition, Anser et al. (Citation2021) discovered that innovation has made a significant contribution to lowering CO2 emissions. They examined the impact of innovation on environmental quality in EU nations using the Panel Fixed Effect and Panel Quantile Regression for the period 2000–2017. In the case of the BRICS economies, this finding is backed up by Yang et al. (Citation2021b) and Erdogan (Citation2021). Additionally, Shan et al. (Citation2021) used the ARDL framework for Turkey and came to a similar conclusion for the years 1990–2018. Similar findings were made by Guo et al. (Citation2021), who investigated how technological innovation can improve environmental quality in Asian countries. They discovered that innovation is beneficial to the environment and has made a significant contribution to lowering CO2 emissions in the countries under consideration.
Contrarily, Dauda et al. (Citation2021), who examined how technological advancements affected environmental quality in sub-Saharan African nations between 1990 and 2018, came to the conclusion that innovation raises CO2 emissions. Usman and Hammar (Citation2021) provided evidence that innovation exacerbates environmental deterioration for Asia Pacific Economic Cooperation (APEC) nations using the Feasible Generalized Least Square (FGLS) and Augmented Mean Group (AMG) frameworks for the period 1990–2017. Arshad et al. (Citation2020) for the South and Southeast Asian (SSEA) have also noted this empirical evidence. Additionally, Villanthenkodath and Mahalik (Citation2022), who examined how technological advancements affected India’s environmental quality from 1980 to 2018, discovered that innovation raises CO2 emissions.
Therefore, in order to reflect greater comparison across various countries, provides an overview of some of the research on the relationship between technological innovation and CO2 emissions.
Table 1. A summary of the selected articles on the innovation-CO2 emissions nexus based on different regions.
2.2. Summarizing literature gaps
Previous research has enhanced our understanding of how energy use and technology advancement impact environmental quality, but it has also left a number of crucial concerns unresolved. To substantially contribute to the growing body of knowledge, these elements are incorporated in the current study. First, there is currently no research done in South Africa to assess the joint effects of technological innovation and energy use on environmental quality in the context of EKC setting and provide details on the precise processes by which this connection may work. Second, none of the preceding studies used a sophisticated estimating method like the dynamic ARDL simulations methodology used by Jordan and Philips (Citation2018) to examine the connection between technological advancement, energy consumption, and environmental quality. The traditional ARDL framework proposed by Pesaran et al. (Citation2001) as well as a number of cointegration techniques that could only examine the short- and long-run correlations between the variables under study were extensively used in earlier works. We can address the shortcomings and inadequacies in the application of the simple ARDL procedure by spontaneously modelling, plotting, and predicting plots of (positive and negative) adjustments in the data, as well as investigating the attendant short-run and long-run linkage between the variables under review. Third, it seems that none of the earlier studies linking energy use and technological development to environmental quality have used the frequency domain causality (FDC) technique, which Breitung and Candelon (Citation2006) designate as the most productive and significant experimental strategy. In order to adequately account for persistent causation between variables, the FDC technique is employed in this study. Persistent causation between variables can occur across long, short, and medium periods. Fourth, the repercussions of numerous structural breaks, which have previously gone unnoticed, have not been sufficiently examined and captured by earlier research tying technological development and energy use to environmental quality. According to empirical analysis, structural breaks are persistent and have an effect on a number of macroeconomic variables, including the development of technology, the use of energy, and CO2 emissions. The findings might be inaccurate and inconsistent if these aspects are not taken into consideration. Lastly, the definition and measurement of trade openness have been criticized in a limited number of empirical studies that examine the impact of technical innovation on CO2 emissions while controlling for trade openness. This study makes a further contribution by using a novel trade openness metric suggested by Squalli and Wilson (Citation2011) that accounts for both the GDP share of trade and the amount of trade in relation to global trade. As a result, our study significantly differs from prior ones that mostly employed TI-based measures of trade openness by using the Squalli and Wilson proxy of trade openness.
3. Material and methods
The novel dynamic ARDL simulations model, capable of simulating and plotting to automatically predict graphs of (positive and negative) changes in the variables, is used in this study to revisit the relationship between technological innovation and CO2 emissions for South Africa over the period 1960–2020. It also estimates their relationships for the long run and short run. It is crucial to do a stationarity test on the variables to determine their order of integration prior to putting the novel dynamic ARDL simulations model into practice. As a result, we use the standard Dickey-Fuller GLS (DF-GLS), Phillips-Perron (PP), Augmented Dickey-Fuller (ADF), and Kwiatkowski-Phillips-Schmidt-Shin unit root tests (KPSS). Since structural breaks are persistent and have an impact on many macroeconomic variables, including CO2 emissions and technological innovation, the Narayan and Popp’s structural break unit root test is utilized. In order to calculate the short- and long-run coefficients of the variables under consideration, a brand-new dynamic ARDL simulations model is used. The robust testing procedure proposed by Breitung and Candelon (Citation2006), the frequency domain causality (FDC) approach, is further employed to capture permanent causality for medium-, short-, and long-term among variables under examination. The robustness of our results is also checked using this test.
3.1. Functional form
The EKC hypothesis discusses the effects of economic development on environmental quality as well as how the structure of economic growth affects environmental quality. Grossman and Krueger (Citation1995) suggest that the three routes via which this influence is occurring are scale, composition, and technique effect. First, there is a scale effect of economic expansion on environmental quality. As economic activity rises, there is a corresponding growth in consumption for natural resources. Natural resource consumption rises as a result of the rise in output. Industrial wastes are produced as a result of rising production and economic expansion, both of which have a deleterious impact on the atmosphere. Therefore, a rise in economic expansion leads to an increase in environmental deterioration. With an increase in income, industrial arrangements change, which alters the architecture of the economic system. The impact of economic expansion on the state of the environment changes from negative to positive during this period. The composition effect is what is used to describe this. Secondary structures mature, and the industrial sector adopts more environmentally friendly technologies. The need for a cleaner environment grows with time. As a result, industry adopt greener technology, increasing total energy efficiency. The technique effect refers to the stage of technological innovation advancement that is occurring. During this phase, the service sector expands, and the economy progressively shifts from being capital-intensive to becoming knowledge-intensive. In the economy, there is a rise in investment in R&D projects, and the secondary sector sees the replacement of harmful technology. As a result, throughout this period of increased economic growth, environmental quality rises. The relationship between environmental deterioration and economic growth described above appears as a reversed U-shaped curve when shown graphically. Following Udeagha and Breitenbach (Citation2021), and Udeagha and Ngepah (Citation2019), the following EKC equation is estimated in this study based on the discussions given above:
(1)
(1)
where CO2 represents CO2 emissions, an environmental quality measure; SE denotes scale effect, a proxy for economic growth; and TE represents technique effect, which captures the square of economic growth. Log-linearizing EquationEquation (1)
(1)
(1) brings about the following:
(2)
(2)
Scale effect (economic growth) deteriorates environmental quality as income increases; however, technique effect improves environmental quality following the implementation of environmental laws and people’s predisposition for a clean environment (Cole & Elliott, Citation2003; Ling et al., Citation2015). Given this background, for EKC hypothesis to be present, the theoretical expectations require that: and
Following literature, as control variables in the equation connecting technological innovation and CO2 emissions equation, we use foreign direct investment, energy consumption, trade openness and industrial value-added. Accounting for these variables as well as technological innovation, EquationEquation (2)
(2)
(2) is thus augmented as follows:
(3)
(3)
where
is technological innovation;
denotes energy consumption;
captures foreign direct investment;
represents trade openness, and
denotes industrial value-added. All variables are in natural log.
are the estimable coefficients capturing different elasticities whereas
captures the stochastic error term with standard properties.
3.2. Measuring trade openness
Following Squalli and Wilson (Citation2011), the composite trade intensity (CTI) is employed in this study as a measure of trade openness to adequately account for trade’s contribution in GDP and its magnitude in relation to global trade. We can successfully overcome the drawbacks of the conventional trade intensity (TI) extensively employed in past studies by using this method of measuring trade openness. More crucially, the novel CTI contains more significant data about a nation’s trade contribution to the world economy. Additionally, because it includes both aspects of a nation’s relationships with the rest of the world, it reflects the reality of trade outcomes. The CTI is shown as follows:
(4)
(4)
where: i reflects South Africa; j captures her trading partners. In EquationEquation (4)
(4)
(4) , the first portion represents global trade share, whereas the second segment denotes trade share of South Africa.
3.3. Variables and data sources
Data from yearly time series covering the years 1960–2020 are used in this paper. The dependent variable is the CO2 emissions, which act as a stand-in for environmental quality. To confirm the existence of the EKC hypothesis, economic growth as measured by scale effect and the square of economic growth as measured by technique effect are utilized. Gross domestic spending on R&D is used as a proxy for technological innovation. Following literature, the other variables that were taken into account were as follows: trade openness (OPEN) proxied as a composite trade intensity derived as above, energy consumption (EC), foreign direct investment (FDI), and industrial value-added to GDP (IGDP). Thus, the variable definition and data sources are summarized in .
Table 2. Definition of variables and data sources.
3.4. Narayan and Popp’s structural break unit root test
Prior to applying the innovative dynamic ARDL simulations model, it is crucial to perform a stationarity test on the variables under consideration to determine the order of integration. These unit root tests are used in this work: Dickey-Fuller GLS (DF-GLS), Phillips-Perron (PP), Augmented Dickey-Fuller (ADF), and Kwiatkowski-Phillips-Schmidt-Shin (KPSS). The Narayan and Popp’s structural break unit root test is additionally employed because empirical data demonstrates that structural breaks are persistent in the sense that they have an impact on numerous macroeconomic variables, including CO2 emissions and technological innovation.
3.5. ARDL bounds testing approach
This study uses the bounds test to look at the relationship between the variables being investigated over the long term. The ARDL bounds testing strategy is provided as follows, in accordance with Pesaran et al. (Citation2001):
(5)
(5)
where
represents the first difference of InCO2, InSE, InTE, InTECH, InEC, InFDI, InOPEN, InIGDP and
is the white noise. Meanwhile, t-i denotes the optimal lags selected by Schwarz’s Bayesian Information Criterion (SBIC),
and
are the estimated coefficients for short run and long run, respectively. The ARDL model for the long- and short-run will be approximated if variables are cointegrated. The null hypothesis, which tests for long-run relationship is as follows:
) against the alternative hypothesis
Whether the null hypothesis is accepted or rejected relies on the estimated F-value. statistic’s The null hypothesis is rejected and cointegration or a long-term link between the variables is inferred if the estimated F-statistic value exceeds the upper threshold. If the estimated F-statistic value is smaller than the lower bound, cointegration does not exist. Additionally, the limits test is unconvincing if the estimated F-statistic value is between the lower and upper boundaries. If there is a long-term link between the variables, the following is the long-term ARDL model that needs to be estimated:
(6)
(6)
denotes the long-run variance of variables in EquationEquation (6)
(6)
(6) . In choosing the correct lags, the paper uses the SBIC. For short-run ARDL model, the error correction model used is as follows:
(7)
(7)
In EquationEquation (7)(7)
(7) , the variable’s short-run variability is represented by
while the error-correction term, abbreviated by ECT, shows the disequilibrium’s rate of adjustment. From -1 to 0, according to estimates, lies the ECT coefficient. Additional diagnostic techniques for model stability are used in this work. The Breusch-Pagan-Godfrey test, the ARCH test, the Ramsey RESET test, the Jarque-Bera test, and the test for heteroscedasticity are all used to determine if the estimated residuals are normally distributed, serial correlations, heteroscedasticity, and heteroscedasticity, respectively. This study utilizes the cumulative sum of recursive residuals (CUSUM) and cumulative sum of squares of recursive residuals to test for structural stability (CUSUMSQ).
3.6. Dynamic autoregressive distributed lag simulations
Previous research that looked into how technological innovation affected CO2 emissions frequently used the simple ARDL approach put forth by Pesaran et al. (Citation2001) and other cointegration frameworks that can only estimate and explore the short- and long-run relationships between the variables. A novel dynamic ARDL simulations model has recently been developed by Jordan and Philips (Citation2018) to address the flaws that are inherent in the simple ARDL model. This model can effectively and efficiently resolve the obstacles and result interpretations connected with the simple ARDL approach. This recently created framework has the ability to stimulate and plot to automatically forecast graphs of (positive and negative) changes in the variables and estimate the linkages for both the short run and long run. The main benefit of this framework is its capacity to anticipate, simulate, and quickly depict probabilistic change forecasts on the dependent variable in one explanatory variable while maintaining the constants of other regressors. The dynamic ARDL error correction technique is used in this work, which bases it on the multivariate normal distribution for the parameter vector. We use the graphs to investigate both the explanatory variable’s actual change and its impact on the dependent variable. Following is a presentation of the unique dynamic ARDL simulations model:
(8)
(8)
3.7. Frequency domain causality test
The frequency domain causality (FDC) technique, a reliable testing tool proposed by Breitung and Candelon (Citation2006), is also used in this work to investigate the causal connections between the variables being studied. FDC makes it possible to predict the response variable at a given time frequency, in contrast to the traditional Granger causality approach, which makes it nearly impossible to do so. It also makes it possible to capture permanent causality for the medium-, short-, and long-term among the variables being studied. In this study, a robustness check is also conducted using this test.
4. Empirical results and their discussion
4.1 Summary statistics
For a simple overview of the key interesting variable statistics, please refer to . The mean, maximum, minimum, and standard deviation are included in the series’ summary statistics. Based on yearly observations for the annual time series from 1960 to 2020, provides the summary statistics. The characteristics and traits of the studied variables used in this study are presented in . Additionally, demonstrates that technique effect (TE) has the greatest mean value (60.316), whereas CO2 emission has the smallest mean value (0.264). The greatest maximum (80.717) and lowest minimum (0.084) values for TE and CO2 emissions, respectively, were noted. The fact that virtually all of the variables’ standard deviations were lower than their mean values shows that all of the variables perform well. Kurtosis results show that all variables have platykurtic distributions, meaning that all estimated parameters have positive and kurtosis values under three. According to the skewness findings, CO2, technological innovation (TECH), foreign direct investment (FDI), and trade openness (OPEN) all have long right-tail distributions (positive skewness), whereas the other variables have long left-tail distributions (negative skewness). The Jarque-Bera statistic revealed that all of the variables had normal distributions, constant variances, and zero covariance, indicating that the variables were appropriate for estimation.
Table 3. Descriptive statistics.
4.2. Order of integration of the respective variables
Starting with the unit root tests such as KPSS, ADF, PP, and DF-GLS, the empirical study investigates the stationarity characteristics of the variables. provides the relevant outcomes of the unit root analysis. According to these tests, the test statistics’ statistical significance points to a mixed order of variable integration. The experiments show that although all the variables are stationary at the first difference, some are non-stationary at level.
Table 4. Unit root analysis.
4.3. Lag length selection results
The investigation of the ideal lag length, which depends on the number of lags selected, comes after the examination of the unit root and order of integration for the nominated model. The lags’ selection criteria are displayed in . Since the model performs better at lag 1 than lag 0 to 4 based on SIC value of 19.094*, the whole lag selection criteria have been employed to apply the ARDL bounds test in this study (see ).
Table 5. Lag length criteria.
4.4. Cointegration test results
The results of the cointegration test are provided in , which demonstrate that the null hypothesis that there is no cointegration between the variables is rejected since the F-stat and t-stat cross all upper boundaries, indicating statistical evidence of a long-term link between the variables. We computed the long- and short-run coefficients of the variables under discussion after achieving a cointegration connection between the variables.
Table 6. ARDL bounds test analysis.
4.5. Diagnostic statistics tests
The research thus employs several diagnostic statistical procedures, and their quantitative findings are presented in , in order to guarantee that our selected model is trustworthy and accurate. Given that the model in use cleared all testing procedures, the empirical findings imply that it fits correctly. The Breusch Godfrey LM test demonstrates that the model is not affected by serial correlation or autocorrelation issues. Evidence obtained using the Ramsey RESET test demonstrates that the model is not mis-specified. Both the Breusch-Pagan-Godfrey test and the ARCH test are used to determine if the model exhibits heteroscedasticity. According to the empirical results, heteroscedasticity is minimal and not a concern. Last but not least, the Jarque-Bera diagnostic outcome indicates that the residuals are having a normal distribution.
Table 7. Diagnostic statistics tests.
4.6. Dynamic ARDL simulations model results
displays the outcomes from the dynamic ARDL simulations framework. Our findings show that the scale effect (InSE) and technique effect (InTE) have a positive and negative influence on CO2 emissions, correspondingly. The scale effect causes a reduction in ecological health, whereas the technique effect buffers the environment. The EKC theory is therefore supported by empirical evidence in the case of South Africa, where real income rises up to a certain threshold but CO2 emissions start to decline. During the initial phases of economic growth, ecological condition in South Africa falls; but, after the nation achieves its optimum level, it starts to improve. This supports the inverted U-shaped relationship between economic growth and ecological quality. The outcomes are pertinent to South Africa and are connected to the structural change and technological advancement of the nation. As people’s living standards increase, so does their environmental consciousness. Ecological regulations are therefore implemented to use energy-efficient technologies to lessen contamination. These results support Udeagha and Breitenbach (Citation2021)'s assertion that the EKC theory is true for the Southern African Development Community (SADC). Alharthi et al. (Citation2021) arrived at comparable conclusions showing that the EKC hypothesis holds true for the countries of the Middle East and North Africa (MENA). Similar to this, Bibi and Jamil (Citation2021) discovered proof supporting the EKC hypothesis. Also, Udeagha and Ngepah (Citation2021b) claim that South Africa fits the EKC hypothesis (2021b). Our results support those of Sun et al. (Citation2021) for China, Isik et al. (Citation2021) for eight OECD countries, and Murshed (Citation2021) for six South Asian countries. The outcomes disagree with Minlah and Zhang (Citation2021)'s observation that Ghana’s environmental Kuznets curve for carbon dioxide emissions is upward sloping. Their observation conflicts with the standard Environmental Kuznets Curve principle, which suggests an inverted "U"-shaped connection between economic progress and ecological decay. Mensah et al. (Citation2018) reported data that are similar and show that the EKC hypothesis is false.
Table 8. Dynamic ARDL simulations analysis.
In terms of statistical significance, the calculated technological innovation coefficient is both short- and long-term negative. Our empirical research demonstrates that, over the long and short term, respectively, a 1% increase in technological innovation results in a reduction in CO2 emissions of 0.73% and 0.22%. The reduction of carbon emissions in South Africa is a result of technological advancements that promote efficient energy use and produce renewable energy sources at lower costs. Technological innovation can be classified into end-of-pipe innovations and cleaner production technologies (Iqbal et al., Citation2021). South Africa has implemented a number of energy-saving and energy-efficient initiatives in this area to reduce carbon emissions. The exact components of industries, the push of technology, the pull of the market, and governmental laws are all part of South Africa’s environmental perfection goals, which are influencing the trend toward pollution-free society. More specifically, the biofuels industry looks for creative activities in a variety of technical stages based on technological capabilities and environmental conditions. Furthermore, carbon emissions are reduced, and global climate change is tackled owing to carbon capture and storage (CCS) technology. Additionally, South Africa is motivated to invest in environmental innovation by externalities, market imperfections, and R&D and innovation incentives. This aids the nation in planning the geographic distribution of polluting businesses and enables environmental protection at minimal economic cost. Meanwhile, South Africa’s considerable R&D expenditures and technological advancements are among the factors that have significantly improved the nation’s environmental quality. As part of the primary strategy to reduce the rapidly increasing levels of greenhouse gases emissions, South Africa has also put in place a number of policy initiatives aimed at creating the wide range of equipment required to reduce the severity of pollutants from manufacturing operations and other sectors of the economy associated with high levels of greenhouse gas emissions. Our findings are consistent with those of Udeagha and Ngepah (Citation2022a), who noted that technological innovation has increased energy efficiency through a number of means, such as altering the fuel mix, implementing energy-efficient industrial practices, and utilizing end-of-pipe technology, which results in a decrease in CO2 emissions in the BRICS countries. Our findings are further supported by Erdogan (Citation2021) and Guo et al. (Citation2021), who highlighted that, for the BRICS countries and China, respectively, technological advancement fosters an environment that encourages a decrease in energy consumption, an increase in energy efficiency, and ultimately a decrease in greenhouse gas emissions. These results are further supported by Anser et al. (Citation2021) for EU countries. Our findings, however, are not consistent with those made by Dauda et al. (Citation2021), who contend that the development of technology in Sub-Saharan African nations compromises ecological integrity. Usman and Hammar (Citation2021) found equivalent results for Asian countries.
When trade openness is increased by 1%, CO2 emissions increased by 0.188% ceteris paribus according to the predicted coefficient for the long run on trade openness (InOPEN), which is determined to be statistically significant and positive. Undisputedly, the long-term adverse effect of openness on South Africa’s environmental situation reinforces the opposition to economic liberalization. Part of the potential explanation for why trade openness harms South Africa’s atmosphere is the sort of goods that make up the majority of its exports. Since South Africa has a competitive edge in the trade and manufacturing of items that require a lot of natural resources, such as timber, arsenate, ramekin, brass, cerium minerals, nitrates, molybdenum, valuable minerals, propane, chromite, mineral fuels, nickel, coal, copper and zinc, gemstones, palladium, and doubloons, an increase in the production of these commodities will undoubtedly aggravate the country’s pollution levels. This is due to the fact that the constant harvesting of these items to supply the expanding global markets considerably degrades South Africa’s ecological environment. Additionally, the López (Citation1994) conceptual model, which holds that carbon emissions is primarily caused by energy-intensive operations like production and transportation that utilize a lot of energy, might be used to justify our observations. Our findings are also in line with the pollution haven hypothesis (Taylor, Citation2004), which claims that emerging economies like South Africa have a comparative advantage in creating commodities that are pollutant-heavy whereas the industrialized economies have a comparative advantage in making items that are clean (Wagner, Citation2010). Consequently, industrialized nations frequently use trade to spread carbon emissions to third world nations (Cole, Citation2004; Wagner, Citation2010). The findings of Khan and Ozturk (Citation2021), which suggest that emerging economies typically generate a high quantity of emissions as a result of reliance on unclean sectors, are consistent with and complement our empirical evidence. Our findings are in line with those of Khan et al. (Citation2022a), who claimed that trade openness is detrimental and significantly worsens Pakistan’s environmental situation. Ibrahim and Ajide (Citation2021a), who concluded that trade openness led to increased CO2 emissions in the G-7, provide more empirical support for this conclusion. Same findings were made by Van Tran (Citation2020), who demonstrated that trade openness erodes the state of the environment in 66 emerging markets. The outcomes from Aydin and Turan (Citation2020) and Ali et al. (Citation2020), which revealed that trade has a detrimental impact on ecological health by increasing carbon dioxide emissions, are consistent with the adverse perception of ecological repercussions of trade openness. Our results do not agree with those of Ibrahim and Ajide (Citation2021b, Citation2021c), and Ding et al. (Citation2021), who showed that more trade openness improves ecological integrity in the G-20, 48 Sub-Saharan African nations, and G-7 economies, respectively.
The computed coefficients for the short- and long-term energy consumption (InEC) are statistically significant and positive, indicating that energy usage makes an important contribution to rising CO2 emissions in South Africa. South Africa is the seventh-largest nation that largely relies on coal to satisfy its energy needs, and although this is necessary to sustain production and further economic growth, it also significantly contributes to the degradation of environmental quality (World Bank, Citation2021). It can be shown that over time, a 1% rise in energy use results in a 0.2713% rise in CO2 emissions. South Africa is significantly reliant on the energy industry, where the production process is dominated by the use of coal. In South Africa, coal reserves account for 93% of power generation and over 77% of the country’s primary energy source (Udeagha & Breitenbach, Citation2021). Because of South Africa’s consistently rising energy consumption, CO2 emissions have dramatically grown over time, having serious adverse environmental effects, and playing a big role in the global climate change. Adebayo et al. (Citation2021)’s findings that energy use causes CO2 emissions in South Korea are consistent with our empirical findings. Similar findings are made by Aslan et al. (Citation2021), who discover that energy use degrades ecological integrity in 17 Mediterranean nations. Additionally, Doğanlar et al. (Citation2021) note that Turkey’s energy usage increases CO2 emissions. Similar findings were reached by Hongxing et al. (Citation2021), who found that 81 BRI economies’ energy usage results in higher carbon emissions. According to research by Hu et al. (Citation2021), Guangdong, China, experiences a rise in carbon emissions due to overall energy usage. Similar findings were made by Irfan et al. (Citation2021b), who looked at the factors affecting consumer intention to use renewable energy. They discovered that the driving factors, such as perception of one’s own effectiveness, awareness, and perception of neighbour participation, have significant and advantageous effects on consumer intention to use renewable energy. Our findings conflict with those made by Ponce and Khan (Citation2021), Khan et al. (Citation2021c), He et al. (Citation2021), Hao et al. (Citation2021) and Baye et al. (Citation2021), who claim that energy use enhances ecological integrity.
The estimated foreign direct investment (InFDI) coefficient over the short term is found to exacerbate CO2 emissions. Our findings are consistent with South Africa’s "pollution have theory." Due to its competitive potential in the export and manufacturing of filthy goods, South Africa has drawn significant FDI inflows, which have significantly worsened the nation’s pollution level. The damaging impact of FDI on South Africa’s atmosphere shows that FDI inflows aid the nation to turn into one of the world’s "havens" for sectors with high levels of pollution. Our findings are in accordance with those of Copeland and Taylor (Citation2013), who asserted that environmentally harmful factories that generate dirty products have relocated to less industrialized economies, thereby shifting the pollutions of the industrialized economies to these poor countries. This has a significant negative impact on these countries’ already decaying environmental conditions. South Africa has also gotten dirtier as a result of poor environmental regulations and corrupt institutions, since the nation is known for producing dirty commodities that considerably increase the rate of environmental degradation. FDI inflows have helped South Africa become a heavily polluted international factory that sends a large portion of what it manufactures back to international markets. This factual data reveals the real characteristics of the South African economy, which is one of Africa’s fastest-emerging economies. Therefore, in order to assure efficiency in the manufacturing processes, authorities and environmentalists must do more to guarantee that overseas companies use modern, environmentally friendly, and energy-efficient products to switch from non-renewable to renewable or less carbon-intensive energy sources. Meanwhile, South Africa’s CO2 emissions will be significantly reduced by switching from non-renewable energy sources to alternatives like solar power. This will eventually encourage long-term value for GHG emission reductions and continuously assist the creation of innovative solutions that improve South Africa’s environmental condition and protect the environment worldwide. Our findings are supported by Muhammad et al. (Citation2021), who found that FDI increases CO2 emissions in BRICS and developing nations from 1991 to 2018. Faheem et al. (Citation2022), who investigated the role of FDI in fostering environmental sustainability in Malaysia, found that FDI has a damaging effect on the Malaysian environment. Our results support the conclusions of Abdouli and Hammami (Citation2017), who in the case of MENA countries achieved a comparable outcome that FDI has greatly escalated CO2 emissions and concluded that there was clear indication for the pollution haven hypothesis. Conclusions drawn by Adeel-Farooq et al. (Citation2021) for 76 developed and developing countries, and Ngepah and Udeagha (Citation2018) for sub-Saharan Africa provide additional evidence in support of this empirical finding. However, the results disagree with those of Mohanty and Sethi (Citation2022), who found that FDI helps to enhance green technologies that improve environmental quality in BRICS countries.
For industrial growth, we found evidence that the growth of the manufacturing industry over time considerably worsens the ecological environment of South Africa. A rise in CO2 emissions is mostly caused by South Africa’s expanding industrial sector. South Africa has implemented a variety of measures throughout the years to pursue economic change and industrialization in order to combat inequality and encourage equitable distribution of income. To ensure lasting economic development, employment generation, and sustainable development, the economy must structurally shift from low-productivity agricultural to high-productivity industrialization. However, South Africa’s expanding industrial sector has resulted in an increase in CO2 emissions. Immense industrialization, the resulting environmental effects, and the effects on biodiversity put human survival in danger since they interfere with fundamental needs, recreational activities, and biological processes. It is recognized that degradation from a variety of sources, notably from commercial entities, has a detrimental effect on the ecosystem that is permanent in nature and leads to the extinction of animal species, which results in the destruction of valuable and unique genetic resources. Our results support the observations made by Udemba (Citation2022), who found that the expanding manufacturing industries are mostly to blame for the increased trend in CO2 emissions in Turkey. In addition, Tian et al. (Citation2014) claimed that domestic CO2 emissions are mostly caused by heavy industry. Cherniwchan (Citation2012) and Hossain (Citation2011) are more sources that validate our findings. The results, however, disagree with those of Lin et al. (Citation2015), who argued that there is no proof that Nigeria’s rapid industrialization activities raises carbon emissions. Studies like those by Shahbaz et al. (Citation2014b) and Shafiei and Salim (Citation2014) found evidence that industrial sector growth reduces CO2 emissions.
The statistically significant, negative error correction term of -0.824, which also demonstrates the quick return to the long-run equilibrium, entrenches the equilibrium connection between the variables. It further clarifies that after correcting the short-run disequilibrium, our model restores to long-run equilibrium at an 82% rate of adjustment.
Impulse response functions dynamically display and forecast the future value of a regressed variable in response to an independent variable in the dynamic ARDL model while maintaining the constant value of the other predictor variable. In this investigation, we predicted the change in CO2 emissions in response to a 10% change in the explanatory factors, either positively or negatively.
The expected relationship between scale effect (economic growth) and CO2 emissions is shown in . Each 10% rise in scale effect inevitably degrades the environment in the short term. However, over time, a rise in scale effect causes more long-term harm to the ecosystem than it does short-term harm. On the other side, every 10% decrease in the scale effect results in a long-term decrease in CO2 emissions, and the environment spontaneously repairs the harm.
Figure 1. The impulse response plot for scale effect (economic growth) and CO2 emissions.
It shows a 10% increase and a decrease in scale effect and its influence on CO2 emissions where dots specify average prediction value. However, the dark blue to light blue line denotes 75, 90, and 95% confidence interval, respectively.
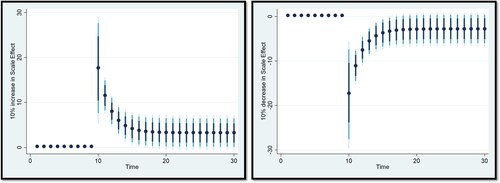
The impulse response of CO2 emissions to positive or negative changes in technique effect is predicted in . As demonstrated, a 10% increase or decrease in technique effect causes significant short- and long-term changes in environmental health. Additionally, over time, every 10% increase in technique effect results in continued improvement of environmental quality. On the other hand, any decrease in technique effect eventually lowers the quality of the environment.
Figure 2. The impulse response plot for technique effect and CO2 emissions.
It shows a 10% increase and a decrease in technique effect and its influence on CO2 emissions where dots specify average prediction value. However, the dark blue to light blue line denotes 75, 90, and 95% confidence interval, respectively.
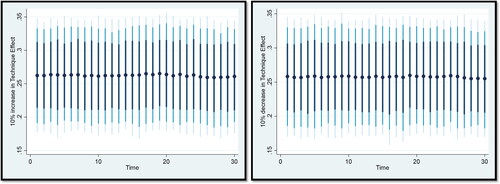
displays the impulse response functions for CO2 emissions to changes in trade openness of 10%. A 10% rise in trade openness or decline results in a similar short-term cost to the environment. However, over time, every increase in trade openness causes CO2 emissions to rise, whereas any 10% decrease in trade openness causes a gradual decline in CO2 emissions. However, as CO2 emissions continue to rise over time, the environment cannot recover from this loss in trade openness.
Figure 3. The impulse response plot for trade openness and CO2 emissions.
It shows a 10% increase and a decrease in trade openness and its influence on CO2 emissions where dots specify average prediction value. However, the dark blue to light blue line denotes 75, 90, and 95% confidence interval, respectively.
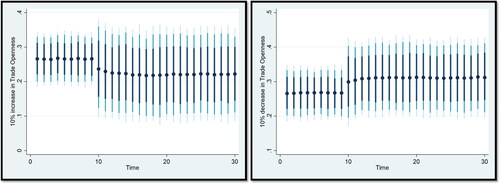
illustrates how variations in CO2 emissions in reaction to energy consumption. Thus any 10% shift in energy usage results in a definite effect in the environment. Additionally, over time, every 10% rise in energy use continually worsens the environment by increasing CO2 emissions. However, every 10% reduction in energy usage results in an improvement in environmental quality. As a result, energy usage will continue to exacerbate environmental deterioration.
Figure 4. The impulse response plot for energy consumption and CO2 emissions.
It shows a 10% increase and a decrease in energy consumption and its influence on CO2 emissions where dots specify average prediction value. However, the dark blue to light blue line denotes 75, 90, and 95% confidence interval, respectively.
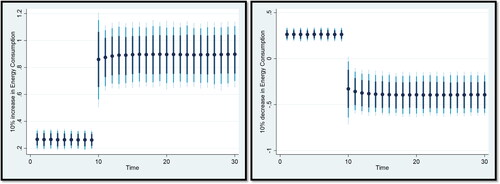
According to the findings, environmental contamination in South Africa increases with a + 10% shock to foreign direct investment, but decreases with a -10% shock, as seen in . This means that boosting foreign direct investment would increase CO2 emissions in the nation; nevertheless, lowering foreign direct investment would improve South Africa’s environmental quality.
Figure 5. The impulse response plot for foreign direct investment and CO2 emissions.
It shows a 10% increase and a decrease in foreign direct investment and its influence on CO2 emissions where dots specify average prediction value. However, the dark blue to light blue line denotes 75, 90, and 95% confidence interval, respectively.
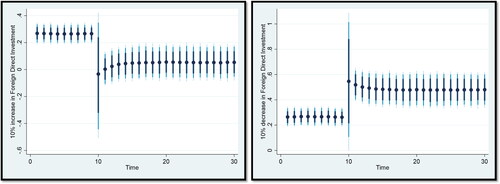
The forecasts in show the relationship between environmental quality and technological advancement. An equal and positive short-term shift in CO2 emissions happens from each 10% increase or decrease in technological innovation. In the long term, environmental quality tends to increase with each successful technological breakthrough, but any additional technological delay results in more severe environmental degradation.
Figure 6. The impulse response plot for technological innovation and CO2 emissions.
It shows a 10% increase and a decrease in technological innovation and its influence on CO2 emissions where dots specify average prediction value. However, the dark blue to light blue line denotes 75, 90, and 95% confidence interval, respectively.

shows that a + 10% shock to urbanization causes environmental deterioration in the nation whereas a -10% shock to urbanization enhances the nation's ecological quality. This means that South Africa's growing urban population is not ecologically friendly.
Figure 7. The impulse response plot for urbanization and CO2 emissions.
It shows a 10% increase and a decrease in urbanization and its influence on CO2 emissions where dots specify average prediction value. However, the dark blue to light blue line denotes 75, 90, and 95% confidence interval, respectively.
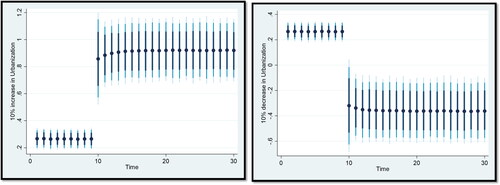
This work also uses the frequency domain causality test proposed by Breitung and Candelon (Citation2006) to explore the causality between InSE, InTE, InTECH, InEC, InFDI, InOPEN, InIGDP and InCO2 in South Africa. shows that InSE, InTE, InTECH, InEC, InFDI, InOPEN and InIGDP Granger-cause InCO2 in the short, medium, and long run for frequencies
Table 9. Frequency-domain causality test.
This implies that InSE, InTE, InTECH, InEC, InFDI, InOPEN and InIGDP significantly affect CO2 emissions in short, medium, and long term in South Africa. Our empirical evidence is compatible with the findings of Udeagha and Ngepah (Citation2023a), and Udeagha and Muchapondwa (Citation2022a).
Moreover, the stability of the model is confirmed from the corresponding CUSUM and CUSUMSQ charts illustrated in and .
Figure 8. The impulse response plot for industrial value-added and CO2 emissions.
It shows a 10% increase and a decrease in industrial value-added and its influence on CO2 emissions where dots specify average prediction value. However, the dark blue to light blue line denotes 75, 90, and 95% confidence interval, respectively.
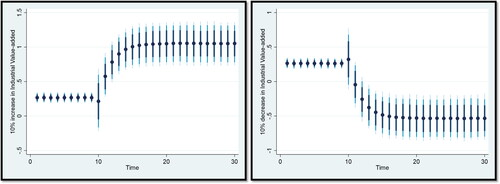
Figure 9. Plot of cumulative sum of recursive residuals (CUSUM).
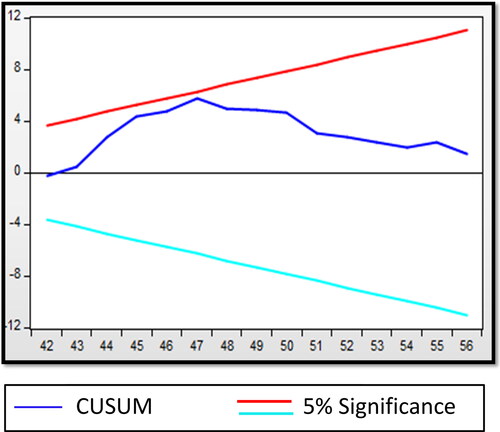
Additionally, shows that a + 10% shock to industrial value-added causes environmental deterioration in the nation whereas a -10% shock to industrial value-added enhances the nation’s ecological quality. This means that South Africa’s growing industrial sector is not ecologically friendly.
5. Conclusion and policy implications
5.1. Conclusion
In the post-COVID-19 era, the imperative to reduce carbon emissions while sustaining economic growth cannot be overstated. Striking this balance is essential for economic recovery, lowering CO2 emissions, and realizing carbon neutrality goals. It is crucial to recognize that the impact of COVID-19 on energy consumption and CO2 emissions is transient. By analyzing the combined effects of technological innovation and energy usage on environmental quality in South Africa from 1960 to 2020 using the EKC structure, this study adds to the literature from both methodological and empirical viewpoints. The novel dynamic ARDL simulations framework provides an accurate and robust methodological approach. It facilitates the estimation, simulation, and dynamic plotting of (positive and negative) variable changes, allowing us to understand their short- and long-term correlations. The study’s main conclusions are as follows: (i) technological innovation reduces CO2 emissions over both short and long terms. (ii) The scale effect exacerbates CO2 emissions, while the technique effect mitigates them, supporting the existence of the EKC hypothesis. (iii) Energy consumption, foreign direct investment, and industrial value-added negatively impact environmental quality. (iv) While trade openness has a beneficial short-term impact, its long-term effect is detrimental, supporting the Pollution Haven Hypothesis. (v) Industrial growth, trade openness, foreign direct investment, energy use, technological innovation, technique effect, and scale effect all Granger-cause CO2 emissions in the short, long, and medium run. This study’s findings underscore the significance of these factors in influencing CO2 emissions and emphasize the need to consider technological innovation as a key driver of clean energy and ecological sustainability in the post-COVID-19 period ().
Figure 10. Plot of cumulative sum of squares of recursive residuals (CUSUMSQ).
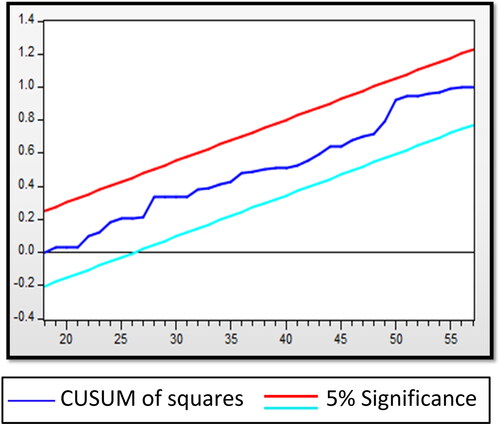
5.2. Policy implications
We present the following policy suggestions based on our empirical findings: First, policymakers should concentrate on maximizing the ecological impact of sustainable technologies in an effort to promote and improve sustainability, considering that technological progress enhances South Africa’s atmospheric health. The South African government should also invest more in initiatives that promote the use of environmentally friendly technologies and make a deliberate effort to amend all types of legislation to support ecological progress and enabling technologies. Environmental and sustainable development concerns should be addressed to encourage sustainable growth (Udeagha & Breitenbach, Citation2023a). To achieve this, green policies should be put into place to promote environmental protection, and regulations that support new technologies should be adopted. The risk issues associated with new inventions and technological advancements may be managed when a growing number of acceptable technical infrastructures and innovations are constructed with the inclusion of green initiatives. Authorities need a set of guiding principles to use when making decisions on environmentally friendly rules for technologies that could benefit the environment. To accelerate environmental advancements, a market architecture that enables companies to exchange cutting-edge concepts and advantages while creating considerable synergies should be created. Policymakers should encourage investment in environmentally friendly technologies and sustainable renewable energy sources in order to advance greener manufacturing.
Second, because energy use impairs environmental quality, South Africa’s government should make it simpler for companies to employ energy-saving techniques in their production activities by providing low-interest financial supports and encouraging the expansion and development of companies that make energy-efficient appliances as a supplementary strategy. Tax breaks and other programs that do not affect the price of conventional energy should be used to increase energy efficiency. In order to transition the energy structure away from fossil fuels, funding, fiscal incentives, and tax breaks should be given to sustainable green types of energy (Udeagha & Muchapondwa, Citation2023e). Renewable energy resources might be a preferable option in South Africa’s energy ambitions to cut CO2 emissions. In South Africa, the usage of sustainable energy has lately seen significant economic development. The country however does not utilize sufficient renewable energy, though. Fossil fuels provide for more than 80% of South Africa’s primary energy source (Ngepah & Udeagha, Citation2018). Even if there is a decline in the usage of fossil fuels, this percentage is still significant. The need of switching from fossil fuel-based to renewable resources and promoting clean energy sources through green technologies is brought home by this. The environment is still polluted by overall energy usage despite growing significant funding help from South Africa for the advancement of alternate energy resources. As a result, the authorities should increase the share of clean energy resources in the energy portfolio to better manage the nation’s physical endowments. The country should also expand tax breaks for companies that utilize sustainable power, strengthen financial benefits for consumers of low-carbon energy, and promote energy efficiency and decrease ecological footprint. In order to lower the cost of deploying green energy resources, South Africa should extend its aid to enterprises involved in research and development (Udeagha & Muchapondwa, Citation2023d).
Third, the South African government should strengthen its trade regulations in a bid to safeguard the atmosphere since trade openness causes atmospheric health to decline. Nevertheless, due to specific benefits to South Africa’s economy, it does not propose drastic measures to limit the borders given the long-term adverse consequences of trade openness on the country’s environment. Rather, appropriate steps should be taken to guarantee that global commerce helps to reduce South Africa’s rising carbon pollution (Udeagha & Ngepah, Citation2023c, Citation2023d). In this reference, officials in South Africa should intensify their actions to embrace modern, eco-friendly, and non-polluting methods that could aid the nation in making the shift from non-renewable to greener, less carbon-intensive energy sources and ensure the expertise of its production operations (Udeagha & Breitenbach, Citation2023d). Additionally, non-renewable energy resources, which provide around 90% of the country’s energy, will be replaced by innovative energy alternatives like solar power. Global collaboration in reducing greenhouse gas emissions is also needed to deal with the expanding multinational ecological pollution and many other spillover effects. In this regard, the South African authorities ought to work hard to develop strong relationships with the rest of the world, especially in order to share technology and improve the environment (Ngepah & Udeagha, Citation2019). More importantly, the government should incorporate provisions on emission reduction in their trade agreement regulations in order to facilitate the shift to eco-friendly sectors and a low-carbon economy, which support the production of sustainable goods and services. Trade policy may be complemented by other measures in order to further encourage long-term benefit for reducing greenhouse gas emissions and continually contribute to the advancement of advanced products that strengthen South Africa’s ecological posture and protect the planet’s climate (Udeagha & Ngepah, Citation2023h).
Fourth, since foreign direct investment contributes to increase carbon emissions, it is recommended that FDI laws be incorporated into the environmental legislative structure. By imposing strong pollution controls on multinational enterprises, it will be easier to enforce the law and prevent South Africa from becoming a sanctuary for polluting multinational corporations while maintaining the ecological integrity of the nation (Udeagha & Breitenbach, Citation2023c). While the FDI entrance norms and assessment techniques are revised, a more thorough review process that is ecologically friendly, greener, and focused on research & development activities should be employed. Government oversight of FDI in sectors that affect the environment and contribute to global warming must be stepped up. More focus should be given to the sustainability of FDI usage while retaining accessibility, particularly in certain undeveloped areas seeking to fast advance economically and grow through FDI (Udeagha & Ngepah, Citation2023g).
Fifth, our research findings on the effects of GDP and trade openness on the environment shows that South Africa has been exporting commodities with high embedded emissions. It is therefore recommended to enhance the share of tradeable sustainable goods in every trade (Udeagha & Breitenbach, Citation2023b). In view of increased liberalization, the industrial framework should be modified to incorporate more productive and ecologically friendly production techniques. More crucially, international collaboration on reducing greenhouse gas emissions is required to deal with expanding transnational pollutions and their potential repercussions (Udeagha & Breitenbach, Citation2023f). In this context, the South African government should work to forge significant international linkages, particularly to share technological developments and lower emissions (Udeagha & Muchapondwa, Citation2023c). Governments should incorporate emission reduction clauses in trade agreements to encourage the transition to green sectors and a low-carbon economy that promote the expansion of eco-friendly products and services.
Sixth, South African authorities should support economic policies that encourage innovation and investment in energy-efficient technology and equipment in order to improve environmental quality. The government and policymakers in South Africa should take extra measures to ensure the implementation of legislation that facilitates the move from non-renewable energy sources to renewable energy sources in order to promote efficiency in the industrial processes and lower CO2 emissions (Udeagha & Muchapondwa, Citation2023b). In order to properly support economic growth, South Africa should take action to reduce energy use and encourage renewable energy sources, which would reduce the uncertainty surrounding economic policy (Udeagha & Ngepah, Citation2023b). More importantly, South Africa’s environmental policy must constantly take economic policy uncertainties into account in order to gather more precise data for minimizing environmental deterioration.
Finally, as a supplementary measure, South Africa’s authorities should support the growth of businesses that produce energy-saving appliances and give them access to low-interest funding for their manufacturing activities. To encourage energy efficiency, one can employ tax credits or other non-price measures that have no impact on the cost of fossil fuels. Eco- friendly energy resources should be given more benefits, tax breaks, and support in order to shift the energy structure away from fossil fuels. Other energy resources need to be given greater consideration if they’re to compete with non-renewable options. Energy storage technology advancements should be controlled alongside renewable energy projects as a crucial policy instrument (Udeagha & Breitenbach, Citation2023e). It is also necessary to emphasize the great value of energy technologies in lowering greenhouse gas emissions (Udeagha & Ngepah, Citation2023f). Energy policy should prioritize energy innovation in order to lower the societal costs of using fossil fuels.
5.3. Limitations and potential future research areas
While this study has produced robust empirical results within the context of South Africa, it is essential to acknowledge its limitations, which can inform future research endeavors. One notable limitation is the constraint on data availability beyond the reference period. The reliance on current time series data restricts the temporal scope of this study. Subsequent research could explore other emerging markets like China, Brazil, India, South Korea, and employ alternative econometric methods or more disaggregated data to gain a broader perspective on the environmental impacts of technological innovation and energy use. Additionally, this study does not consider certain growth-related factors like institutional quality and natural resources. Future investigations could delve into these variables to offer a more comprehensive understanding. The use of CO2 as a proxy for environmental damage, while common, leaves room for further exploration. Future research could evaluate alternative metrics such as consumption-based carbon emissions and other indicators of carbon footprints to better measure environmental deterioration. Future research should delve into the impact of Innovative Organizational Culture (IOC) on firm performance in the South African context, as emphasized by Ashraf and Ali (Citation2022). This would contribute to a deeper understanding of the dynamics between organizational culture and business outcomes in the unique South African business landscape. Furthermore, the study predominantly focuses on CO2 emissions. Subsequent research should encompass a broader range of environmental concerns, including industrial effluents and radioactive materials, to provide a more holistic perspective on the interplay between technological innovation, energy use, and environmental quality. This research is also confined to a single country. To obtain a more global perspective, future studies should examine the ecological implications of technological innovation and energy use in multi-country panel setups, allowing for cross-country comparisons and a more comprehensive understanding of these dynamics (Udeagha & Ngepah, Citation2023e). These considerations, while limitations in the current study, open avenues for future research to expand and refine our understanding of the complex relationship between technological innovation, energy consumption, and environmental quality on a broader scale.
Author information
Maxwell Chukwudi Udeagha and Nicholas Ngepah contributed equally to this work.
Contributions
MC conceptualised the study idea, drafted the paper, collected data, analysed data, wrote the introduction section, organised the literature review, drafted the methodology section, interpreted the results and provided the discussions, concluded the study with policy implications and organised the reference list. N conceptualised the study idea, drafted the paper, collected data, analysed data, wrote the introduction section, organised the literature review, drafted the methodology section, interpreted the results and provided the discussions, concluded the study with policy implications and organised the reference list.
Availability of data and materials
The datasets used are publicly available from the World Bank World Development Indicators, which can be accessed at https://databank.worldbank.org/source/world-develop ment-indicators
Disclosure statement
No potential conflict of interest was reported by the authors.
References
- Abid, A., Mehmood, U., Tariq, S., & Haq, Z. U. (2022). The effect of technological innovation, FDI, and financial development on CO2 emission: Evidence from the G8 countries. Environmental Science and Pollution Research, 29(8), 11654–11662. https://doi.org/10.1007/s11356-021-15993-x
- Abdouli, M., & Hammami, S. (2017). Investigating the causality links between environmental quality, foreign direct investment and economic growth in MENA countries. International Business Review, 26(2), 264–278. https://doi.org/10.1016/j.ibusrev.2016.07.004
- Adebayo, T. S., Awosusi, A. A., Kirikkaleli, D., Akinsola, G. D., & Mwamba, M. N. (2021). Can CO2 emissions and energy consumption determine the economic performance of South Korea? A time series analysis. Environmental Science and Pollution Research, 28(29), 38969–38984. https://doi.org/10.1007/s11356-021-13498-1
- Adebayo, T. S., Oladipupo, S. D., Adeshola, I., & Rjoub, H. (2022). Wavelet analysis of impact of renewable energy consumption and technological innovation on CO2 emissions: Evidence from Portugal. Environmental Science and Pollution Research, 29(16), 23887–23904. https://doi.org/10.1007/s11356-021-17708-8
- Adeel-Farooq, R. M., Riaz, M. F., & Ali, T. (2021). Improving the environment begins at home: Revisiting the links between FDI and environment. Energy, 215, 119150. https://doi.org/10.1016/j.energy.2020.119150
- African Development Bank Group. (2019). South Africa economic outlook. https://www.afdb.org/en/countries/southern-africa/south-africa/south-africa-econ omic-outlook.
- Ahmad, M., & Raza, M. Y. (2020). Role of public-private partnerships investment in energy and technological innovations in driving climate change: Evidence from Brazil. Environmental Science and Pollution Research, 27(24), 30638–30648. https://doi.org/10.1007/s11356-020-09307-w
- Ahmad, M., & Wu, Y. (2022). Combined role of green productivity growth, economic globalization, and eco-innovation in achieving ecological sustainability for OECD economies. Journal of Environmental Management, 302, 113980. https://doi.org/10.1016/j.jenvman.2021.113980
- Alharthi, M., Dogan, E., & Taskin, D. (2021). Analysis of CO2 emissions and energy consumption by sources in MENA countries: Evidence from quantile regressions. Environmental Science and Pollution Research, 28(29), 38901–38908. https://doi.org/10.1007/s11356-021-13356-0
- Ali, M., Irfan, M., Ozturk, I., & Rauf, A. (2022). Modeling public acceptance of renewable energy deployment: A pathway towards green revolution. Economic Research-Ekonomska Istraživanja, 36(3), 1–19. https://doi.org/10.1080/1331677X.2022.2159849
- Ali, S., Yan, Q., Dilanchiev, A., Irfan, M., & Fahad, S. (2022). Modeling the economic viability and performance of solar home systems: A roadmap towards clean energy for environmental sustainability. Environmental Science and Pollution Research, 30(11), 30612–30631. https://doi.org/10.1007/s11356-022-24387-6
- Ali, S., Yan, Q., Razzaq, A., Khan, I., & Irfan, M. (2022). Modeling factors of biogas technology adoption: A roadmap towards environmental sustainability and green revolution. Environmental Science and Pollution Research International, 30(5), 11838–11860. https://doi.org/10.1007/s11356-022-22894-0
- Ali, S., Yusop, Z., Kaliappan, S. R., & Chin, L. (2020). Dynamic common correlated effects of trade openness, FDI, and institutional performance on environmental quality: Evidence from OIC countries. Environmental Science and Pollution Research, 27(11), 11671–11682. https://doi.org/10.1007/s11356-020-07768-7
- Altinoz, B., Vasbieva, D., & Kalugina, O. (2021). The effect of information and communication technologies and total factor productivity on CO2 emissions in top 10 emerging market economies. Environmental Science and Pollution Research, 28(45), 63784–63793. https://doi.org/10.1007/s11356-020-11630-1
- Álvarez-Herránz, A., Balsalobre, D., Cantos, J. M., & Shahbaz, M. (2017). Energy innovations-GHG emissions nexus: Fresh empirical evidence from OECD countries. Energy Policy, 101, 90–100. https://doi.org/10.1016/j.enpol.2016.11.030
- Anser, M. K., Khan, M. A., Nassani, A. A., Aldakhil, A. M., Hinh Voo, X., & Zaman, K. (2021). Relationship of environment with technological innovation, carbon pricing, renewable energy, and global food production. Economics of Innovation and New Technology, 30(8), 807–842. https://doi.org/10.1080/10438599.2020.1787000
- Anwar, A., Chaudhary, A. R., Malik, S., & Bassim, M. (2021). Modelling the macroeconomic determinants of carbon dioxide emissions in the G-7 countries: The roles of technological innovation and institutional quality improvement. Global Business Review, 097215092110393. https://doi.org/10.1177/09721509211039392
- Arshad, Z., Robaina, M., & Botelho, A. (2020). The role of ICT in energy consumption and environment: An empirical investigation of Asian economies with cluster analysis. Environmental Science and Pollution Research, 27(26), 32913–32932. https://doi.org/10.1007/s11356-020-09229-7
- Ashraf, Y., & Ali, F. (2022). How innovative organization culture affects firm performance in the wake of enterprise resource planning? evidence from energy-and non-energy-sector firms in Pakistan. Frontiers in Environmental Science, 10, 1801. https://doi.org/10.3389/fenvs.2022.991319
- Asif, M. H., Zhongfu, T., Ahmad, B., Irfan, M., Razzaq, A., & Ameer, W. (2023c). Influencing factors of consumers’ buying intention of solar energy: A structural equation modeling approach. Environmental Science and Pollution Research, 30(11), 30017–30032. https://doi.org/10.1007/s11356-022-24286-w
- Asif, M. H., Zhongfu, T., Dilanchiev, A., Irfan, M., Eyvazov, E., & Ahmad, B. (2023a). Determining the influencing factors of consumers’ attitude toward renewable energy adoption in developing countries: A roadmap toward environmental sustainability and green energy technologies. Environmental Science and Pollution Research, 30(16), 47861–47872. https://doi.org/10.1007/s11356-023-25662-w
- Asif, M. H., Zhongfu, T., Irfan, M., & Işık, C. (2023b). Do environmental knowledge and green trust matter for purchase intention of eco-friendly home appliances? An application of extended theory of planned behavior. Environmental Science and Pollution Research, 30(13), 37762–37774. https://doi.org/10.1007/s11356-022-24899-1
- Aslan, A., Altinoz, B., & Özsolak, B. (2021). The nexus between economic growth, tourism development, energy consumption, and CO2 emissions in Mediterranean countries. Environmental Science and Pollution Research, 28(3), 3243–3252. https://doi.org/10.1007/s11356-020-10667-6
- Asongu, S. A. (2018). ICT, openness and CO 2 emissions in Africa. Environmental Science and Pollution Research, 25(10), 9351–9359. https://doi.org/10.1007/s11356-018-1239-4
- Atsu, F., Adams, S., & Adjei, J. (2021). ICT, energy consumption, financial development, and environmental degradation in South Africa. Heliyon, 7(7), e07328. https://doi.org/10.1016/j.heliyon.2021.e07328
- Aydin, M., & Turan, Y. E. (2020). The influence of financial openness, trade openness, and energy intensity on ecological footprint: Revisiting the environmental Kuznets curve hypothesis for BRICS countries. Environmental Science and Pollution Research, 27(34), 43233–43245. https://doi.org/10.1007/s11356-020-10238-9
- Baloch, M. A., Ozturk, I., Bekun, F. V., & Khan, D. (2021). Modeling the dynamic linkage between financial development, energy innovation, and environmental quality: Does globalization matter? Business Strategy and the Environment, 30(1), 176–184. https://doi.org/10.1002/bse.2615
- Baye, R. S., Olper, A., Ahenkan, A., Musah-Surugu, I. J., Anuga, S. W., & Darkwah, S. (2021). Renewable energy consumption in Africa: Evidence from a bias corrected dynamic panel. The Science of the Total Environment, 766, 142583. https://doi.org/10.1016/j.scitotenv.2020.142583
- Bibi, F., & Jamil, M. (2021). Testing environment Kuznets curve (EKC) hypothesis in different regions. Environmental Science and Pollution Research, 28, 13581–13594. https://doi.org/10.1007/s11356-020-11516-2
- Breitung, J., & Candelon, B. (2006). Testing for short-and long-run causality: A frequency-domain approach. Journal of Econometrics, 132(2), 363–378. https://doi.org/10.1016/j.jeconom.2005.02.004
- Cherniwchan, J. (2012). Economic growth, industrialization, and the environment. Resource and Energy Economics, 34(4), 442–467. https://doi.org/10.1016/j.reseneeco.2012.04.004
- Chhabra, M., Giri, A. K., & Kumar, A. (2022). Do technological innovations and trade openness reduce CO2 emissions? Evidence from selected middle-income countries. Environmental Science and Pollution Research International, 29(43), 65723–65738. https://doi.org/10.1007/s11356-022-20434-4
- Cole, M. A. (2004). Trade, the pollution haven hypothesis and the environmental Kuznets curve: Examining the linkages. Ecological Economics, 48(1), 71–81. https://doi.org/10.1016/j.ecolecon.2003.09.007
- Cole, M. A., & Elliott, R. J. (2003). Determining the trade–environment composition effect: The role of capital, labor and environmental regulations. Journal of Environmental Economics and Management, 46(3), 363–383. https://doi.org/10.1016/S0095-0696(03)00021-4
- Copeland, B. R., & Taylor, M. S. (2013). Trade and the environment. Princeton University Press.
- Dauda, L., Long, X., Mensah, C. N., & Salman, M. (2019). The effects of economic growth and innovation on CO 2 emissions in different regions. Environmental Science and Pollution Research, 26(15), 15028–15038. https://doi.org/10.1007/s11356-019-04891-y
- Dauda, L., Long, X., Mensah, C. N., Salman, M., Boamah, K. B., Ampon-Wireko, S., & Dogbe, C. S. K. (2021). Innovation, trade openness and CO2 emissions in selected countries in Africa. Journal of Cleaner Production, 281, 125143. https://doi.org/10.1016/j.jclepro.2020.125143
- Demir, C., Cergibozan, R., & Ari, A. (2020). Environmental dimension of innovation: Time series evidence from Turkey. Environment, Development and Sustainability, 22(3), 2497–2516. https://doi.org/10.1007/s10668-018-00305-0
- Destek, M. A., & Manga, M. (2021). Technological innovation, financialization, and ecological footprint: Evidence from BEM economies. Environmental Science and Pollution Research, 28(17), 21991–22001. https://doi.org/10.1007/s11356-020-11845-2
- Dinda, S. (2018). Production technology and carbon emission: Long-run relation with short-run dynamics. Journal of Applied Economics, 21(1), 106–121. https://doi.org/10.1080/15140326.2018.1526871
- Ding, Q., Khattak, S. I., & Ahmad, M. (2021). Towards sustainable production and consumption: Assessing the impact of energy productivity and eco-innovation on consumption-based carbon dioxide emissions (CCO2) in G-7 nations. Sustainable Production and Consumption, 27, 254–268. https://doi.org/10.1016/j.spc.2020.11.004
- Doğanlar, M., Mike, F., Kızılkaya, O., & Karlılar, S. (2021). Testing the long-run effects of economic growth, financial development and energy consumption on CO2 emissions in Turkey: New evidence from RALS cointegration test. Environmental Science and Pollution Research, 28(25), 32554–32563. https://doi.org/10.1007/s11356-021-12661-y
- Energy Information Administration (EIA). (2010). Energy Statistics for Countries.
- Erdogan, S. (2021). Dynamic nexus between technological innovation and buildings Sector’s carbon emission in BRICS countries. Journal of Environmental Management, 293, 112780. https://doi.org/10.1016/j.jenvman.2021.112780
- Faheem, M., Hussain, S., ArsalanTanveer, Safdar, N., & Anwer, M. A. (2022). Does foreign direct investment asymmetrically affect the mitigation of environmental degradation in Malaysia? Environmental Science and Pollution Research, 29, 7393–7405. https://doi.org/10.1007/s11356-021-16231-0
- Faisal, F., Tursoy, T., Pervaiz, R., Azizullah. (2020). Does ICT lessen CO2 emissions for fast-emerging economies? An application of the heterogeneous panel estimations. Environmental Science and Pollution Research, 27(10), 10778–10789. https://doi.org/10.1007/s11356-019-07582-w
- Fine, B., & Rustomjee, Z. (1996). The political economy of South Africa: From Minerals-energy complex to industrialisation. Hurst.
- Godil, D. I., Sharif, A., Agha, H., & Jermsittiparsert, K. (2020). The dynamic nonlinear influence of ICT, financial development, and institutional quality on CO2 emission in Pakistan: New insights from QARDL approach. Environmental Science and Pollution Research, 27(19), 24190–24200. https://doi.org/10.1007/s11356-020-08619-1
- Guo, J., Zhou, Y., Ali, S., Shahzad, U., & Cui, L. (2021). Exploring the role of green innovation and investment in energy for environmental quality: An empirical appraisal from provincial data of China. Journal of Environmental Management, 292, 112779. https://doi.org/10.1016/j.jenvman.2021.112779
- Grossman, G. M., & Krueger, A. B. (1995). Economic growth and the environment. The Quarterly Journal of Economics, 110(2), 353–377. https://doi.org/10.2307/2118443
- Habiba, U. M. M. E., Xinbang, C., & Anwar, A. (2022). Do green technology innovations, financial development, and renewable energy use help to curb carbon emissions? Renewable Energy, 193, 1082–1093. https://doi.org/10.1016/j.renene.2022.05.084
- Hao, L. N., Umar, M., Khan, Z., & Ali, W. (2021). Green growth and low carbon emission in G7 countries: How critical the network of environmental taxes, renewable energy and human capital is? Science of the Total Environment, 752, 141853. https://doi.org/10.1016/j.scitotenv.2020.141853
- Haseeb, A., Xia, E., Saud, S., Ahmad, A., & Khurshid, H. (2019). Does information and communication technologies improve environmental quality in the era of globalization? An empirical analysis. Environmental Science and Pollution Research, 26(9), 8594–8608. https://doi.org/10.1007/s11356-019-04296-x
- He, A., Xue, Q., Zhao, R., & Wang, D. (2021). Renewable energy technological innovation, market forces, and carbon emission efficiency. The Science of the Total Environment, 796, 148908. https://doi.org/10.1016/j.scitotenv.2021.148908
- Hongxing, Y., Abban, O. J., Boadi, A. D., & Ankomah-Asare, E. T. (2021). Exploring the relationship between economic growth, energy consumption, urbanization, trade, and CO2 emissions: A PMG-ARDL panel data analysis on regional classification along 81 BRI economies. Environmental Science and Pollution Research, 28(46), 66366–66388. https://doi.org/10.1007/s11356-021-15660-1
- Hossain, M. S. (2011). Panel estimation for CO2 emissions, energy consumption, economic growth, trade openness and urbanization of newly industrialized countries. Energy Policy, 39(11), 6991–6999.
- Hu, M., Chen, S., Wang, Y., Xia, B., Wang, S., & Huang, G. (2021). Identifying the key sectors for regional energy, water and carbon footprints from production-, consumption-and network-based perspectives. The Science of the Total Environment, 764, 142821. https://doi.org/10.1016/j.scitotenv.2020.142821
- Ibrahiem, D. M. (2020). Do technological innovations and financial development improve environmental quality in Egypt? Environmental Science and Pollution Research, 27(10), 10869–10881. https://doi.org/10.1007/s11356-019-07585-7
- Ibrahim, M., & Vo, X. V. (2021). Exploring the relationships among innovation, financial sector development and environmental pollution in selected industrialized countries. Journal of Environmental Management, 284, 112057. https://doi.org/10.1016/j.jenvman.2021.112057
- Ibrahim, R. L., & Ajide, K. B. (2021a). Nonrenewable and renewable energy consumption, trade openness, and environmental quality in G-7 countries: The conditional role of technological progress. Environmental Science and Pollution Research, 28(33), 45212–45229. https://doi.org/10.1007/s11356-021-13926-2
- Ibrahim, R. L., & Ajide, K. B. (2021b). Disaggregated environmental impacts of non-renewable energy and trade openness in selected G-20 countries: The conditioning role of technological innovation. Environmental Science and Pollution Research, 28(47), 67496–67510. https://doi.org/10.1007/s11356-021-15322-2
- Ibrahim, R. L., & Ajide, K. B. (2021c). Trade facilitation and environmental quality: Empirical evidence from some selected African countries. Environment, Development and Sustainability, 24(1), 1282–1312. https://doi.org/10.1007/s10668-021-01497-8
- International Energy Agency. (2020). Global energy review 2020: The impacts of the COVID—19 crisis on global energy demand and CO2 emissions.
- IPCC. (2018). Summary for policymakers. Global warming of 1.5 °C. IPCC, Geneva
- Iqbal, N., Abbasi, K. R., Shinwari, R., Guangcai, W., Ahmad, M., & Tang, K. (2021). Does exports diversification and environmental innovation achieve carbon neutrality target of OECD economies? Journal of Environmental Management, 291, 112648. https://doi.org/10.1016/j.jenvman.2021.112648
- Irfan, M., Elavarasan, R. M., Hao, Y., Feng, M., & Sailan, D. (2021a). An assessment of consumers’ willingness to utilize solar energy in China: End-users’ perspective. Journal of Cleaner Production, 292, 126008. https://doi.org/10.1016/j.jclepro.2021.126008
- Irfan, M., Hao, Y., Ikram, M., Wu, H., Akram, R., & Rauf, A. (2021b). Assessment of the public acceptance and utilization of renewable energy in Pakistan. Sustainable Production and Consumption, 27, 312–324. https://doi.org/10.1016/j.spc.2020.10.031
- Irfan, M., Razzaq, A., Sharif, A., & Yang, X. (2022b). Influence mechanism between green finance and green innovation: Exploring regional policy intervention effects in China. Technological Forecasting and Social Change, 182, 121882. https://doi.org/10.1016/j.techfore.2022.121882
- Irfan, M., Razzaq, A., Suksatan, W., Sharif, A., Elavarasan, R. M., Yang, C., Hao, Y., & Rauf, A. (2022a). Asymmetric impact of temperature on COVID-19 spread in India: Evidence from quantile-on-quantile regression approach. Journal of Thermal Biology, 104, 103101. https://doi.org/10.1016/j.jtherbio.2021.103101
- Irfan, M., Zhao, Z. Y., Li, H., & Rehman, A. (2020). The influence of consumers’ intention factors on willingness to pay for renewable energy: A structural equation modeling approach. Environmental Science and Pollution Research, 27(17), 21747–21761. https://doi.org/10.1007/s11356-020-08592-9
- Irfan, M., Zhao, Z. Y., Rehman, A., Ozturk, I., & Li, H. (2021c). Consumers’ intention-based influence factors of renewable energy adoption in Pakistan: A structural equation modeling approach. Environmental Science and Pollution Research, 28(1), 432–445. https://doi.org/10.1007/s11356-020-10504-w
- Isik, C., Ongan, S., Ozdemir, D., Ahmad, M., Irfan, M., Alvarado, R., & Ongan, A. (2021). The increases and decreases of the environment Kuznets curve (EKC) for 8 OECD countries. Environmental Science and Pollution Research, 28(22), 28535–28543. https://doi.org/10.1007/s11356-021-12637-y
- Islam, M. M., Irfan, M., Shahbaz, M., & Vo, X. V. (2022). Renewable and non-renewable energy consumption in Bangladesh: The relative influencing profiles of economic factors, urbanization, physical infrastructure and institutional quality. Renewable Energy. 184, 1130–1149. https://doi.org/10.1016/j.renene.2021.12.020
- Jordan, S., & Philips, A. Q. (2018). Cointegration testing and dynamic simulations of autoregressive distributed lag models. The Stata Journal: Promoting Communications on Statistics and Stata, 18(4), 902–923. https://doi.org/10.1177/1536867X1801800409
- Khalid, W., & Jalil, A. (2019). An econometric analysis of inter-fuel substitution in energy sector of Pakistan. Environmental Science and Pollution Research, 26(17), 17021–17031. https://doi.org/10.1007/s11356-019-05014-3
- Khalid, W., & Ozdeser, H. (2021). Estimation of substitution possibilities between hydroelectricity and classical factor inputs for Pakistan’s economy. Forman Journal of Economic Studies, 17(02), 69–101. https://doi.org/10.32368/FJES.20211712
- Khalid, W., Özdeşer, H., & Jalil, A. (2021). An empirical analysis of inter-factor and inter-fuel substitution in the energy sector of Pakistan. Renewable Energy. 177, 953–966. https://doi.org/10.1016/j.renene.2021.05.163
- Khan, A., Muhammad, F., Chenggang, Y., Hussain, J., Bano, S., & Khan, M. A. (2020). The impression of technological innovations and natural resources in energy-growth-environment nexus: A new look into BRICS economies. Science of the Total Environment, 727, 138265. https://doi.org/10.1016/j.scitotenv.2020.138265
- Khan, I., Han, L., BiBi, R., & Khan, H. (2022b). The role of technological innovations and renewable energy consumption in reducing environmental degradation: Evidence from the belt and road initiative countries. Environmental Science and Pollution Research, 29(48), 73085–73099. https://doi.org/10.1007/s11356-022-21006-2
- Khan, I., Hou, F., & Le, H. P. (2021c). The impact of natural resources, energy consumption, and population growth on environmental quality: Fresh evidence from the United States of America. The Science of the Total Environment, 754, 142222. https://doi.org/10.1016/j.scitotenv.2020.142222
- Khan, I., Lei, H., Shah, A. A., Khan, I., Baz, K., Koondhar, M. A., & Hatab, A. A. (2022a). Environmental quality and the asymmetrical nonlinear consequences of energy consumption, trade openness and economic development: Prospects for environmental management and carbon neutrality. Environmental Science and Pollution Research, 29(10), 14654–14664. https://doi.org/10.1007/s11356-021-16612-5
- Khan, M., & Ozturk, I. (2021). Examining the direct and indirect effects of financial development on CO2 emissions for 88 developing countries. Journal of Environmental Management, 293, 112812. https://doi.org/10.1016/j.jenvman.2021.112812
- Khattak, S. I., Ahmad, M., Khan, Z. U., & Khan, A. (2020). Exploring the impact of innovation, renewable energy consumption, and income on CO2 emissions: New evidence from the BRICS economies. Environmental Science and Pollution Research, 27(12), 13866–13881. https://doi.org/10.1007/s11356-020-07876-4
- Kripfganz, S., & Schneider, D. C. (2018). ARDL: Estimating autoregressive distributed lag and equilibrium correction models. Retrieved July 12, 2019, from Stata: www.stata.com/meeting/uk18/slides/uk18_Kripfganz.pdf
- Kuang, H., Akmal, Z., & Li, F. (2022). Measuring the effects of green technology innovations and renewable energy investment for reducing carbon emissions in China. Renewable Energy, 197, 1–10. https://doi.org/10.1016/j.renene.2022.06.091
- Kwiatkowski, D., Phillips, P. C., Schmidt, P., & Shin, Y. (1992). Testing the null hypothesis of stationarity against the alternative of a unit root: How sure are we that economic time series have a unit root?. Journal of Econometrics, 54(1–3), 159–178. https://doi.org/10.1016/0304-4076(92)90104-Y
- Li, Y., Zhang, C., Li, S., & Usman, A. (2022). Energy efficiency and green innovation and its asymmetric impact on CO2 emission in China: A new perspective. Environmental Science and Pollution Research, 29(31), 47810–47817. https://doi.org/10.1007/s11356-022-19161-7
- Lin, B., Omoju, O. E., & Okonkwo, J. U. (2015). Impact of industrialisation on CO2 emissions in Nigeria. Renewable and Sustainable Energy Reviews, 52, 1228–1239. https://doi.org/10.1016/j.rser.2015.07.164
- Lin, B., & Ma, R. (2022). Green technology innovations, urban innovation environment and CO2 emission reduction in China: Fresh evidence from a partially linear functional-coefficient panel model. Technological Forecasting and Social Change, 176, 121434. https://doi.org/10.1016/j.techfore.2021.121434
- Ling, C. H., Ahmed, K., Muhamad, R. B., & Shahbaz, M. (2015). Decomposing the trade-environment nexus for Malaysia: What do the technique, scale, composition, and comparative advantage effect indicate? Environmental Science and Pollution Research, 22(24), 20131–20142. https://doi.org/10.1007/s11356-015-5217-9
- López, R. (1994). The environment as a factor of production: The effects of economic growth and trade liberalization. Journal of Environmental Economics and Management, 27(2), 163–184. https://doi.org/10.1006/jeem.1994.1032
- MacKinnon, J. G. (1996). Numerical distribution functions for unit root and cointegration tests. Journal of Applied Econometrics, 11(6), 601–618. https://doi.org/10.1002/(SICI)1099-1255(199611)11:6<601::AID-JAE417>3.0.CO;2-T
- Mensah, C. N., Long, X., Boamah, K. B., Bediako, I. A., Dauda, L., & Salman, M. (2018). The effect of innovation on CO2 emissions of OCED countries from 1990 to 2014. Environmental Science and Pollution Research, 25(29), 29678–29698. https://doi.org/10.1007/s11356-018-2968-0
- Minlah, M. K., & Zhang, X. (2021). Testing for the existence of the Environmental Kuznets Curve (EKC) for CO 2 emissions in Ghana: Evidence from the bootstrap rolling window Granger causality test. Environmental Science and Pollution Research, 28(2), 2119–2131. https://doi.org/10.1007/s11356-020-10600-x
- Mohanty, S., & Sethi, N. (2022). The energy consumption-environmental quality nexus in BRICS countries: The role of outward foreign direct investment. Environmental Science and Pollution Research, 29(13), 19714–19730. https://doi.org/10.1007/s11356-021-17180-4
- Muhammad, B., Khan, M. K., Khan, M. I., & Khan, S. (2021). Impact of foreign direct investment, natural resources, renewable energy consumption, and economic growth on environmental degradation: Evidence from BRICS, developing, developed and global countries. Environmental Science and Pollution Research, 28(17), 21789–21798. https://doi.org/10.1007/s11356-020-12084-1
- Muhammad, F., Khan, A., Razzaq, N., & Karim, R. (2021). Influence of tourism, governance, and foreign direct investment on energy consumption and CO 2 emissions: A panel analysis of Muslim countries. Environmental Science and Pollution Research, 28(1), 416–431. https://doi.org/10.1007/s11356-020-10502-y
- Murshed, M. (2021). LPG consumption and environmental Kuznets curve hypothesis in South Asia: A time-series ARDL analysis with multiple structural breaks. Environmental Science and Pollution Research, 28(7), 8337–8372. https://doi.org/10.1007/s11356-020-10701-7
- Narayan, P. K., Narayan, S., & Popp, S. (2010). A note on the long-run elasticities from the energy consumption–GDP relationship. Applied Energy, 87(3), 1054–1057. https://doi.org/10.1016/j.apenergy.2009.08.037
- Ngepah, N., & Udeagha, M. C. (2018). African regional trade agreements and intra-African trade. Journal of Economic Integration, 33(1), 1176–1199. https://doi.org/10.11130/jei.2018.33.1.1176
- Ngepah, N., & Udeagha, M. C. (2019). Supplementary trade benefits of multi-memberships in African regional trade agreements. Journal of African Business, 20(4), 505–524. https://doi.org/10.1080/15228916.2019.1584719
- Obobisa, E. S., Chen, H., & Mensah, I. A. (2022). The impact of green technological innovation and institutional quality on CO2 emissions in African countries. Technological Forecasting and Social Change, 180, 121670. https://doi.org/10.1016/j.techfore.2022.121670
- Pan, X., Wang, Y., Shen, Z., & Song, M. (2022). Technological progress on embodied carbon emissions in G7 countries’ exports: A structural decomposition analysis. Journal of Cleaner Production, 372, 133800. https://doi.org/10.1016/j.jclepro.2022.133800
- Pesaran, M. H., Shin, Y., & Smith, R. J. (2001). Bounds testing approaches to the analysis of level relationships. Journal of Applied Econometrics, 16(3), 289–326. https://doi.org/10.1002/jae.616
- Ponce, P., & Khan, S. A. R. (2021). A causal link between renewable energy, energy efficiency, property rights, and CO2 emissions in developed countries: A road map for environmental sustainability. Environmental Science and Pollution Research, 28(28), 37804–37817. https://doi.org/10.1007/s11356-021-12465-0
- Rafique, M. Z., Li, Y., Larik, A. R., & Monaheng, M. P. (2020). The effects of FDI, technological innovation, and financial development on CO2 emissions: Evidence from the BRICS countries. Environmental Science and Pollution Research, 27(19), 23899–23913. https://doi.org/10.1007/s11356-020-08715-2
- Rafique, M. Z., Schneider, N., Shahzad, U., & Song, M. (2022). High‐tech industries, financial expansion, and low‐carbon energy deployment along the belt and road initiative. Sustainable Development, 30(6), 1779–1795. https://doi.org/10.1002/sd.2347
- Rahman, M. M., Alam, K., & Velayutham, E. (2022). Reduction of CO2 emissions: The role of renewable energy, technological innovation and export quality. Energy Reports, 8, 2793–2805. https://doi.org/10.1016/j.egyr.2022.01.200
- Santra, S. (2017). The effect of technological innovation on production-based energy and CO2 emission productivity: Evidence from BRICS countries. African Journal of Science, Technology, Innovation and Development, 9(5), 503–512. https://doi.org/10.1080/20421338.2017.1308069
- Shafiei, S., & Salim, R. A. (2014). Non-renewable and renewable energy consumption and CO2 emissions in OECD countries: A comparative analysis. Energy Policy, 66, 547–556. https://doi.org/10.1016/j.enpol.2013.10.064
- Shahbaz, M., Sbia, R., Hamdi, H., & Ozturk, I. (2014b). Economic growth, electricity consumption, urbanization and environmental degradation relationship in United Arab Emirates. Ecological Indicators, 45, 622–631. https://doi.org/10.1016/j.ecolind.2014.05.022
- Shan, S., Genç, S. Y., Kamran, H. W., & Dinca, G. (2021). Role of green technology innovation and renewable energy in carbon neutrality: A sustainable investigation from Turkey. Journal of Environmental Management, 294, 113004. https://doi.org/10.1016/j.jenvman.2021.113004
- Sharif, A., Saqib, N., Dong, K., & Khan, S. A. R. (2022). Nexus between green technology innovation, green financing, and CO2 emissions in the G7 countries: The moderating role of social globalisation. Sustainable Development, 30(6), 1934–1946. https://doi.org/10.1002/sd.2360
- Squalli, J., & Wilson, K. (2011). (2011). A new measure of trade openness. The World Economy, 34(10), 1745–1770. https://doi.org/10.1111/j.1467-9701.2011.01404.x
- Statistics South Africa. (2019). Economic growth. http://www.statssa.gov.za/? page_id=735&id=1.
- Sun, Y., Li, M., Zhang, M., Khan, H. S. U. D., Li, J., Li, Z., Sun, H., Zhu, Y., & Anaba, O. A. (2021). A study on China’s economic growth, green energy technology, and carbon emissions based on the Kuznets curve (EKC). Environmental Science and Pollution Research, 28(6), 7200–7211. https://doi.org/10.1007/s11356-020-11019-0
- Tang, C., Xue, Y., Wu, H., Irfan, M., & Hao, Y. (2022). How does telecommunications infrastructure affect eco-efficiency? Evidence from a quasi-natural experiment in China. Technology in Society, 69, 101963. https://doi.org/10.1016/j.techsoc.2022.101963
- Taylor, M. S. (2004). Unbundling the pollution haven hypothesis. Advances in Economic Analysis & Policy, 3(2).
- Tian, X., Chang, M., Shi, F., & Tanikawa, H. (2014). How does industrial structure change impact carbon dioxide emissions? A comparative analysis focusing on nine provincial regions in China. Environmental Science & Policy, 37, 243–254. https://doi.org/10.1016/j.envsci.2013.10.001
- Udeagha, M. C., & Breitenbach, M. C. (2021). Estimating the trade-environmental quality relationship in SADC with a dynamic heterogeneous panel model. African Review of Economics and Finance, 13(1), 113–165.
- Udeagha, M. C., & Breitenbach, M. C. (2023a). Exploring the moderating role of financial development in environmental Kuznets curve for South Africa: Fresh evidence from the novel dynamic ARDL simulations approach. Financial Innovation, 9(1), 5. https://doi.org/10.1186/s40854-022-00396-9
- Udeagha, M. C., & Breitenbach, M. C. (2023b). On the asymmetric effects of trade openness on CO2 emissions in SADC with a nonlinear ARDL approach. Discover Sustainability, 4(1), 2. https://doi.org/10.1007/s43621-022-00117-3
- Udeagha, M. C., & Breitenbach, M. C. (2023c). Revisiting the nexus between fiscal decentralization and CO2 emissions in South Africa: Fresh policy insights. Financial Innovation, 9(1), 50. https://doi.org/10.1186/s40854-023-00453-x
- Udeagha, M. C., & Breitenbach, M. C. (2023d). Can fiscal decentralization be the route to the race to zero emissions in South Africa? Fresh policy insights from novel dynamic autoregressive distributed lag simulations approach. Environmental Science and Pollution Research, 30(16), 46446–46474. https://doi.org/10.1007/s11356-023-25306-z
- Udeagha, M. C., & Breitenbach, M. C. (2023e). The role of financial development in climate change mitigation: Fresh policy insights from South Africa. Biophysical Economics and Sustainability, 8(1), 1. https://doi.org/10.1007/s41247-023-00110-y
- Udeagha, M. C., & Breitenbach, M. C. (2023f). The role of fiscal decentralization in limiting CO2 emissions in South Africa. Biophysical Economics and Sustainability, 8(3), 5. https://doi.org/10.1007/s41247-023-00112-w
- Udeagha, M. C., & Muchapondwa, E. (2022a). Investigating the moderating role of economic policy uncertainty in environmental Kuznets curve for South Africa: Evidence from the novel dynamic ARDL simulations approach. Environmental Science and Pollution Research, 29(51), 77199–77237. https://doi.org/10.1007/s11356-022-21107-y
- Udeagha, M. C., & Muchapondwa, E. (2023a). Green finance, fintech, and environmental sustainability: Fresh policy insights from the BRICS nations. International Journal of Sustainable Development & World Ecology, 30(6), 633–649. https://doi.org/10.1080/13504509.2023.2183526
- Udeagha, M. C., & Muchapondwa, E. (2023b). Achieving regional sustainability and carbon neutrality target in BRICS economies: Understanding the importance of fiscal decentralization, export diversification and environmental innovation. Sustainable Development, 31(4), 2620–2635. https://doi.org/10.1002/sd.2535
- Udeagha, M. C., & Muchapondwa, E. (2023c). Achieving green environment in Brazil, Russia, India, China, and South Africa economies: Do composite risk index, green innovation, and environmental policy stringency matter? Sustainable Development, 31(5), 3468–3489. https://doi.org/10.1002/sd.2597
- Udeagha, M. C., & Muchapondwa, E. (2023d). Striving for the United Nations (UN) Sustainable Development Goals (SDGs) in BRICS economies: The role of green finance, fintech, and natural resource rent. Sustainable Development, 31(5), 3657–3672. https://doi.org/10.1002/sd.2618
- Udeagha, M. C., & Muchapondwa, E. (2023e). Environmental sustainability in South Africa: Understanding the criticality of economic policy uncertainty, fiscal decentralization, and green innovation. Sustainable Development, 31(3), 1638–1651. https://doi.org/10.1002/sd.2473
- Udeagha, M. C., & Ngepah, N. (2019). Revisiting trade and environment nexus in South Africa: Fresh evidence from new measure. Environmental Science and Pollution Research, 26(28), 29283–29306. https://doi.org/10.1007/s11356-019-05944-y
- Udeagha, M. C., & Ngepah, N. (2020). Trade liberalization and the geography of industries in South Africa: Fresh evidence from a new measure. International Journal of Urban Sciences, 24(3), 354–396. https://doi.org/10.1080/12265934.2019.1695652
- Udeagha, M. C., & Ngepah, N. (2021a). The asymmetric effect of trade openness on economic growth in South Africa: A nonlinear ARDL approach. Economic Change and Restructuring, 54(2), 491–540. https://doi.org/10.1007/s10644-020-09285-6
- Udeagha, M. C., & Ngepah, N. (2022a). Does trade openness mitigate the environmental degradation in South Africa? Environmental Science and Pollution Research, 29(13), 19352–19377. https://doi.org/10.1007/s11356-021-17193-z
- Udeagha, M. C., & Ngepah, N. (2022b). Dynamic ARDL simulations effects of fiscal decentralization, green technological innovation, trade openness, and institutional quality on environmental sustainability: Evidence from South Africa. Sustainability, 14(16), 10268. https://doi.org/10.3390/su141610268
- Udeagha, M. C., & Ngepah, N. (2022c). Disaggregating the environmental effects of renewable and non-renewable energy consumption in South Africa: Fresh evidence from the novel dynamic ARDL simulations approach. Economic Change and Restructuring, 55(3), 1767–1814. https://doi.org/10.1007/s10644-021-09368-y
- Udeagha, M. C., & Ngepah, N. (2022d). The asymmetric effect of technological innovation on CO2 emissions in South Africa: New evidence from the QARDL approach. Frontiers in Environmental Science, 10, 985719. https://doi.org/10.3389/fenvs.2022.985719
- Udeagha, M. C., & Ngepah, N. (2023a). Can public–private partnership investment in energy (PPPI) mitigate CO2 emissions in South Africa? Fresh evidence from the novel dynamic ARDL simulations approach. Frontiers in Environmental Science, 10, 1044605. https://doi.org/10.3389/fenvs.2022.1044605
- Udeagha, M. C., & Ngepah, N. (2023b). Striving towards environmental sustainability in the BRICS economies: The combined influence of fiscal decentralization and environmental innovation. International Journal of Sustainable Development & World Ecology, 30(2), 111–125. https://doi.org/10.1080/13504509.2022.2123411
- Udeagha, M. C., & Ngepah, N. (2023c). Striving towards carbon neutrality target in BRICS economies: Assessing the implications of composite risk index, green innovation, and environmental policy stringency. Sustainable Environment, 9(1), 2210950. https://doi.org/10.1080/27658511.2023.2210950
- Udeagha, M. C., & Ngepah, N. (2023d). Towards climate action and UN sustainable development goals in BRICS economies: Do export diversification, fiscal decentralisation and environmental innovation matter? International Journal of Urban Sustainable Development, 15(1), 172–200. https://doi.org/10.1080/19463138.2023.2222264
- Udeagha, M. C., & Ngepah, N. (2023e). The role of technological innovation in fostering environmental quality in South Africa: Fresh evidence from the novel dynamic ARDL simulations approach. Economics and Policy of Energy and the Environment, (2), 107–155. https://doi.org/10.3280/EFE2022-002006
- Udeagha, M. C., & Ngepah, N. (2023f). Achieving decarbonization goals in BRICS economies: Revisiting the joint role of composite risk index, green innovation, and environmental policy stringency. Cogent Social Sciences, 9(1), 2234230. https://doi.org/10.1080/23311886.2023.2234230
- Udeagha, M. C., & Ngepah, N. (2023g). The drivers of environmental sustainability in BRICS economies: Do green finance and fintech matter? World Development Sustainability, 3(1), 100096. https://doi.org/10.1016/j.wds.2023.100096
- Udeagha, M. C., & Ngepah, N. (2023h). The role of tourism development in improving environmental quality in South Africa: Insights from novel dynamic ARDL simulations approach. African Review of Economics and Finance, 1–24. https://african-review.com/online-first-details.php?id=69
- Udeagha, M. C., & Ngepah, N. N. (2021b). A step towards environmental mitigation in South Africa: Does trade liberalisation really matter? Fresh evidence from a novel dynamic ARDL simulations approach. Research Square, https://doi.org/10.21203/rs.3.rs-419113/v1
- Udemba, E. N. (2022). Implication of energy expansion via the interaction of coal, industrialization, and agriculture towards climate goal: Dual sustainability analysis. Environmental Science and Pollution Research, 29(17), 25605–25622. https://doi.org/10.1007/s11356-021-17537-9
- United Nations Climate Change. (2021). COP26 reaches consensus on key actions to address climate change. https://unfccc.int/news/cop26- reach es- consensus- on- key- actions- to- address- climate- change.
- Usman, M., & Hammar, N. (2021). Dynamic relationship between technological innovations, financial development, renewable energy, and ecological footprint: Fresh insights based on the STIRPAT model for Asia Pacific Economic Cooperation countries. Environmental Science and Pollution Research, 28(12), 15519–15536. https://doi.org/10.1007/s11356-020-11640-z
- Van Tran, N. (2020). The environmental effects of trade openness in developing countries: Conflict or cooperation? Environmental Science and Pollution Research International, 27(16), 19783–19797. https://doi.org/10.1007/s11356-020-08352-9
- Van Zyl, A. (2011). Innovation in South Africa: The role of the technological innovation agency. South African Journal of Science, 107(1–2), 1–2. https://doi.org/10.4102/sajs.v107i1/2.594
- Villanthenkodath, M. A., & Mahalik, M. K. (2022). Technological innovation and environmental quality nexus in India: Does inward remittance matter? Journal of Public Affairs, 22(1), e2291. https://doi.org/10.1002/pa.2291
- Vitenu-Sackey, P. A., & Acheampong, T. (2022). Impact of economic policy uncertainty, energy intensity, technological innovation and R&D on CO2 emissions: Evidence from a panel of 18 developed economies. Environmental Science and Pollution Research, 29(58), 87426–87445. https://doi.org/10.1007/s11356-022-21729-2
- Wagner, G. (2010). Energy content of world trade. Energy Policy, 38(12), 7710–7721. https://doi.org/10.1016/j.enpol.2010.08.022
- Wang, Z., Gao, L., Wei, Z., Majeed, A., & Alam, I. (2022). How FDI and technology innovation mitigate CO2 emissions in high-tech industries: Evidence from province-level data of China. Environmental Science and Pollution Research, 29(3), 4641–4653. https://doi.org/10.1007/s11356-021-15946-4
- World Bank. (2021). World development indicators. http://www.world bank.org
- Yang, B., Jahanger, A., & Ali, M. (2021b). Remittance inflows affect the ecological footprint in BICS countries: Do technological innovation and financial development matter? Environmental Science and Pollution Research, 28(18), 23482–23500. https://doi.org/10.1007/s11356-021-12400-3
- Yang, C., Hao, Y., & Irfan, M. (2021a). Energy consumption structural adjustment and carbon neutrality in the post-COVID-19 era. Structural Change and Economic Dynamics, 59, 442–453. https://doi.org/10.1016/j.strueco.2021.06.017
- Zameer, H., Yasmeen, H., Zafar, M. W., Waheed, A., & Sinha, A. (2020). Analyzing the association between innovation, economic growth, and environment: Divulging the importance of FDI and trade openness in India. Environmental Science and Pollution Research, 27(23), 29539–29553. https://doi.org/10.1007/s11356-020-09112-5
- Zheng, L., Abbasi, K. R., Salem, S., Irfan, M., Alvarado, R., & Lv, K. (2022). How technological innovation and institutional quality affect sectoral energy consumption in Pakistan? Fresh policy insights from novel econometric approach. Technological Forecasting and Social Change, 183, 121900. https://doi.org/10.1016/j.techfore.2022.121900