
 ?Mathematical formulae have been encoded as MathML and are displayed in this HTML version using MathJax in order to improve their display. Uncheck the box to turn MathJax off. This feature requires Javascript. Click on a formula to zoom.
Abstract
This study aims to compare household food security and its determinants among PSNP beneficiary, graduated, and non-beneficiary. Data was collected from 396 sample households using a structured questionnaire and key informant interview. Binary Probit regression was used to analyse the determinants of household food security. Household food security was measured using Food Insecurity Experience Scale (FIES) and Household Hunger Scale (HHS). The study found significant differences in household food security among beneficiary, graduated and non-beneficiary both in FIES and HHS. The mean raw scores of FIES and HHS for graduated households were lower than both beneficiary and non-beneficiary households. Graduated households had the highest percentage of food secure households (67.4%), followed by non-beneficiary households (61.5%) and beneficiary households (34.3%). The binary probit model showed the number of clinic visits by household head was the only factor that negatively associated with all the three groups. The number of years benefited from PSNP had a negative influence on both beneficiary and graduated households’ food security. Whereas livestock had a positive effect on the food security of both graduated and non-beneficiary households, unlike dependency ratio. Livelihood zone, drought, and credit were only associated with beneficiary household food security, while crop diversification determined only graduated households’ food security. Hence, the findings suggest that policymakers and practitioners should focus on improving access to health care, limit the duration of PSNP participation, promote crop diversification, and provide proper credit use training to enhance household food security.
Impact statement
Effective food security interventions play a significant role in addressing chronic food insecurity. In Ethiopia, Productive Safety Net Program (PSNP) has been implemented to provide predictable and reliable support to chronically food insecure households. Hence, this study compared the household food security and its determinants among PSNP beneficiary, graduated, and non-beneficiary. The findings showed that the household food security status of PSNP beneficiary, graduated, and non-beneficiary were significantly different. Graduated households had better household food security status than both beneficiary and non-beneficiary households. Moreover, the factors that determine the household food security status also vary among PSNP beneficiary, graduated, and non-beneficiary. The number of years benefited from PSNP had a negative effect on both beneficiary and graduated households’ food security. Comparing graduated households to current beneficiaries and non-beneficiaries provides insights on the long-term effects of PSNP. This study helps policymakers and practitioners to make changes on PSNP and design effective food security intervention considering the differences in food security status and determinants among PSNP beneficiary, graduated and non-beneficiary.
REVIEWING EDITOR:
1. Introduction
Food insecurity is an urgent issue that impacts the well-being and livelihoods of millions of people worldwide. Achieving food security is a key UN Sustainable Development Goal (SDG), emphasizing the need for sustainable access to nutritious food for all. Ethiopia, among other developing nations, has been fighting with chronic and widespread food insecurity, which has affected a significant portion of its population and large geographic areas.
With a population of around 123 million people in 2022, Ethiopia ranked as the second most populous country in Africa (UNDP, Citation2022). Poverty and food insecurity persist despite the country’s rapid economic growth in recent years. In 2020, about 56% of the population was estimated to be food insecure moderately or severely, which showed about 7 million increase compared to 2016 (FAO et al., Citation2021). Recurrent droughts and other shocks have left many people with chronic food insecurity and humanitarian aid dependency. Humanitarian assistance often fails to lift households out of the poverty trap, even when it helps save lives (Béné et al., Citation2012).
Food security interventions before 2002 were dependent on emergency food aid and had limitations in terms of sustainability and long-term impacts. To provide predictable and reliable support to vulnerable households in chronically food insecure areas, the Productive Safety Net Program (PSNP) was launched in 2005 (Ministry of Agriculture and Rural Development (MOARD), Citation2010). Ethiopia’s PSNP is one of Sub-Saharan Africa’s largest social protection programs, with about 8 million beneficiaries, which accounts for around 10% of the population and covers more than 300 chronic food insecure districts (Desalegn & Ali, Citation2018). PSNP was successful in saving lives and improving food security but failed to build resilience. Most households have not been lifted out of poverty by the program (Sabates-Wheeler et al., Citation2021).
Evidence from previous studies on the impacts of PSNP in Ethiopia are mixed and different. Different studies have demonstrated the positive impact of PSNP on improving household food security (Berhane et al., Citation2015; Gilligan et al., Citation2009; Hailu & Amare, Citation2022; Tadesse & Gebremedhin Zeleke, Citation2022); children’s nutritional status (Debela et al., Citation2015; Porter & Goyal, Citation2016); and asset accumulation (Borga & D’Ambrosio, Citation2021; Welteji et al., Citation2017). In contrast to these findings, other studies have not found significant effect of participation in the PSNP on household food security (Bahru et al., Citation2020; Berlie, Citation2014; Gebrehiwot & Castilla, Citation2019); child nutritional status (Bahru et al., Citation2020; Berhane et al., Citation2017; Gebrehiwot & Castilla, Citation2019); asset accumulation (Gilligan et al., Citation2009); livestock holdings (Andersson et al., Citation2011); agricultural input use and technology adoption (Bahru & Zeller, Citation2022; Hoddinott et al., Citation2012); and non-farm income (Weldegebriel & Prowse, Citation2013).
Most existing studies have focused solely on beneficiary households, neglecting the examination of graduated households. Moreover, most impact evaluations done on PSNP only made comparisons among current beneficiary and non-beneficiary households, whereas evidence on graduated households current food security status was not investigated. The study by Devereux & Ulrichs (Citation2015) and Sabates-Wheeler et al. (2021) found that there was premature graduation in PSNP which resulted due to the political emphasis on high graduation numbers as the program success. Consequently, households were often graduated out of the program based on quotas rather than actual poverty alleviation. In addition, Sabates-Wheeler et al. (Citation2012) also indicated that many graduated households complained that they graduated early and had no confidence not needing the PSNP benefit in the future. However, the studies done on graduated households are qualitative studies on stakeholders and graduates’ perceptions on PSNP graduation which did not address their household food security status and associated factors. Moreover, it is not well known whether graduated household have better food security status than both beneficiaries and non-beneficiaries or not. Hence, this study was conducted to answer the following research questions: Is there a significant difference in household food security among PSNP beneficiaries, graduates, and non-beneficiaries? Are the determinants of household food security different among PSNP beneficiaries, graduates and non-beneficiaries? Therefore, this study aimed to compare the extent and determinants of household food security among PSNP current beneficiaries, graduates, and non-beneficiary households. This study contributes to the existing literature on food security interventions, specifically PSNP in Ethiopia by exploring the differences in food security outcomes and determinants among beneficiary, graduated, and non-beneficiary households. Comparing graduated households to current beneficiaries and non-beneficiaries provides insights on the PSNP long-term effects. This study helps policymakers and practitioners to make informed decisions on program modifications such as on targeting, graduation, and amount of transfer; and resource allocation to target interventions effectively that address potential disparities among different groups.
2. Materials and methods
2.1. Description of study area
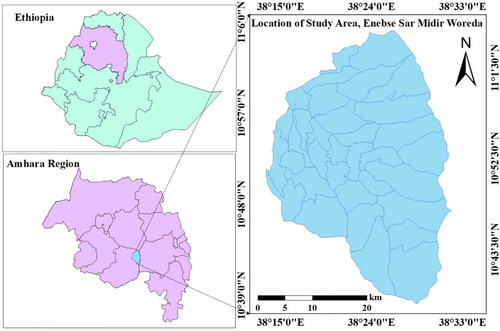
The study was conducted in Enebesie Sar Medir district, Amhara region, Northwestern Ethiopia (). The district is located between 10° 39′ N to 11° 6′ N latitude and 38° 15′ E to 38° 33′ E longitude, and its altitude varies from 950 to 3660 meters above sea level. It is one of the 64 food insecure and PSNP targeted districts in Amhara region where the PSNP has been implemented since the inception of the program in 2005. In the district, there are 37 kebeles, of which 25 kebeles are chronically food insecure and PSNP targeted. The total population of the district is about 188,533. The annual rainfall ranges from 900 to 1200 mm, and the mean monthly temperature varies from 10 to 22°C. Haricot bean, sorghum, teff, wheat, bean, maize, and peas are the major crops in the district (Enebise Sar Medir District Agriculture Office (ESMDAO), Citation2022). The district shares three different livelihood zones, which are Abay Beshilo River Basin (ABB) (16 kebeles), Southwest ‘Woina Dega’ Wheat (SWW) (12 kebeles) and Central Highland Barely and Potato (CBP) (5 kebeles). The major shocks which affect crop and livestock production are repeated occurrence of drought, crop pests and livestock diseases (Ministry of Agriculture and Rural Development (MOARD) & USAID, Citation2009).
Figure 1. Location map of the study area.
2.2. Sampling procedure and sample size
Multistage sampling was used to select representative sample households, taking into account possible sources of heterogeneity. In the first stage, Enebesie Sar Medir district was purposively selected based on the condition of food insecurity and the presence of PSNP intervention since the program’s inception in 2005. In the second stage, the PSNP targeted kebeles were stratified based on the existing livelihood zone (LZ) classification (Abay Beshilo River Basin, Southwest ‘woina dega’ Wheat, and Central Highland Barely and Potato) to capture their heterogeneity, which are delineated taking into account population density, rainfall patterns, altitude, market dynamics, and dominant livelihood activities (Ministry of Agriculture and Rural Development (MOARD) & USAID, Citation2009). For instance, the Abay Beshilo River basin LZ is characterized by lowland geography, less than 900 mm annual rainfall, sparse population, crops like sorghum and teff, market challenges, and erratic rainfall. The Southwest ‘woina dega’ Wheat LZ features midland agroecology, cultivating teff, wheat, and maize, with 900 to 1200 mm annual rainfall and good market access. The Central Highland Barley and Potato LZ distinguished by its highland agroecology, dense population, barley and potato cultivation, 1200 to 1400 mm annual rainfall, and limited market access.
In the third stage, a total of five kebeles (villages) were randomly selected to represent the livelihood zones in the district, taking into account the proportionality of each stratum. In the fourth stage, the sample beneficiary, graduates and non-beneficiary households were selected using a sampling frame of each PSNP target kebeles (villages). The selection for beneficiaries and graduated households is implemented based on the PSNP Program Implementation Manual (Ministry of Agriculture (MOA), Citation2014). The PSNP program has a task force called the Community Food Security Task Force (CFSTF), which is responsible for identifying the beneficiaries and graduate households. The basic PSNP beneficiary eligibility criteria is being chronically food insecure household who have faced continuous food shortages (3 months of food gap or more per year) in the last 3 years. Due to the limited quota for each kebele (village), all eligible households do not participate in the program. Therefore, the CFSTF made eligible households’ wealth ranking based on the household asset status such as land holding, quality of land, livestock holding, food stock, labor availability and income from agricultural and non-agricultural activities. The poorest households are selected as beneficiaries considering the quota allocated for each kebele. Then, the PSNP beneficiaries graduate when they meet the criteria of achieving household food self-sufficiency without external support. In the district, the benchmark for graduation is reaching an asset value of more than 9,000 Birr per capita. Non-beneficiary households are those households which neither participated nor graduated from PSNP. The lists and respective numbers of beneficiaries, graduates, and non-beneficiaries in each kebele were obtained from the Enebesie Sar Medir District Agriculture Office which was used as a sampling frame for this study. The sample beneficiary, graduate and non-beneficiary households were selected in consultation with the Enebesie Sar Medir District Agriculture Office and PSNP experts. Finally, Probability Proportional to Size (PPS) followed by simple random sampling procedure was used to draw 396 representative sample households from each stratum and group. The sample size was determined using the Yamane sampling formula (Yamane, Citation1967) as follows:
where n is total sample size, N is the total number of households in PSNP kebeles (17992) and e is the margin of error (5%).
2.3. Methods of data collection
Structured questionnaire and key informants’ interviews (KII) were used to collect primary data. The questionnaire was prepared and encoded into Kobo toolbox which is a data collection software. Five enumerators and one supervisor were trained about the questionnaire content and how to use the Kobo toolbox. Pre-test was carried out in non-sampled households to check the consistency and relevance of the contents of the questionnaire. The questionnaire was revised based on the pre-test feedback. The actual data collection was conducted using Kobo collect mobile application from January to February 2023. During the data collection, the collected data were checked daily on the Kobo toolbox online server. The questionnaire covers a wide range of variables which includes sociodemographic characteristics, agriculture and non-agriculture related issues, food security, shocks, PSNP related issues, and access to infrastructure. Secondary data collected by reviewing various articles, books, government policy and strategy documents and reports.
2.4. Method of data analysis
Descriptive statistics, crosstabulation and ANOVA used to analyse the characteristics of households and compare the extent of explanatory variables among beneficiary, graduated and non-beneficiary households. Household food security was measured using Food Insecurity Experience Scale (FIES) and Household Hunger Score (HHS). FIES is an experience-based metric of household food security developed by FAO (Wambogo et al., Citation2018). HHS is the most suitable measure for monitoring and evaluating the impact of anti-hunger policies and programmes in areas with chronic food insecurity, including those funded by a particular donor across various countries and cultures (Ballard et al., Citation2011).
2.4.1. Theoretical model
The Agricultural Household Utility Model developed by Singh et al. (Citation1986) was used to compare household food security status and its determinants in developing countries. It is the most widely used model to analyse rural household decision making and determinants of household food security (Feleke et al., Citation2005; Yovo and Gnedeka, Citation2023). The model assumes that households are both producers and consumers. Households seek to maximize their utility (in this case, household food security (HFS)) subject to various constraints that include PSNP participation (P), wealth (W), landholding (L), shocks (S) and other household characteristics (Zi) and written as follows.
Given these constraints, households make rational decisions to achieve their HFS through their participation in the PSNP intervention. Households’ consumption choices would vary among PSNP beneficiaries, graduates, and non-beneficiaries depending on their resources and constraints. According to the PSNP asset-based targeting criteria, the poorest households are selected as beneficiaries. Non-beneficiaries are better off than beneficiaries in terms of household assets and income from agricultural and non-agricultural activities. Hence, beneficiaries are expected to have lower household food security status than non-beneficiaries. PSNP provides support to beneficiaries until they graduate to improve their household assets and income to achieve household food security after graduation. Graduated households are therefore expected to achieve the same or better household food security status (HFS) than non-beneficiaries. Non-beneficiaries are used as a reference group to compare the household food security status of beneficiaries and graduated households. Therefore, it is particularly important to understand how households in each group (beneficiary, graduated and non-beneficiary) achieve their HFS based on their consumption choices and constraints. Hence, this study analysed HFS status and associated factors for each group to provide concrete information for policy makers to design interventions that target HFS of each group.
2.4.2. Econometric model
To analyse determinants of household food security in beneficiary, graduated and non-beneficiary households, binary probit model was used. The dependent variable was household food security which was measured using FIES. Following the FIES result, the severely and moderately food insecure categories were recoded as food insecure, while the other was recoded as food secure due to insufficiency of the observations for regression analysis in the severely and moderately food insecure categories. Therefore, the HFS of the beneficiary, graduate and non-beneficiary households was measured as a dummy variable (1 if food secure and 0 if food insecure). As a result, this study used binary probit model to answer the research question: are the determinants of household food security different among PSNP beneficiaries, graduates, and non-beneficiaries? Therefore, a total of three binary probit models (one model for each group) were run to identify statistically significant factors affecting HFS of beneficiaries, graduates, and non-beneficiaries. The mathematical model of the binary probit model is specified as follows.
where
Where:
Yi and denote HFS of beneficiaries, graduates, and non-beneficiaries and latent variable,
Xi are explanatory variables that affect HFS of each group and
is the error term.
2.4.3. Description and hypothesis of variables
This study was used composite explanatory variables such wealth status, dependency ratio, and livestock size (). The wealth status of sample households was determined using wealth index developed by World Food Programme (WFP) (Citation2009). The wealth index was computed using principal component analysis. Then, the wealth index was categorized into quintiles, which are assigned as poorest (1st quantile), poor (2nd quantile), medium (3rd quantile), rich (4th quantile) and richest (5th quantile). Due to insufficient number of observations in each category, this study categorized household wealth status as poor (by merging the poorest and poor), and rich (merging the middle, rich, and richest). Similarly, previous studies also categorized quantiles into rich and poor (Workie & Tesfaw, Citation2021). The wealth index is not an absolute measure of wealth, rather it is a relative measure. Dependency ratio is calculated by dividing the number of non-working age (<15&>64) members of the household with working age (15-64) members. The number of livestock owned by the household was converted into tropical livestock unit (TLU) using the conversion factors of Storck et al. (Citation1991).
Table 1. Description and hypothesis of explanatory variables.
3. Results and discussion
3.1. Descriptive characteristics of sample households
The mean household size, land size and livestock (TLU) are highest in graduated households whereas crop diversification, amount of chemical fertilizers, are highest in non-beneficiary households. The mean number of livestock owned by graduated households is 2.85 TLU, while the non-beneficiary and beneficiary households had 2.63 and 1.2 TLU, respectively. The F-test result showed that the mean difference across beneficiary, graduated and non-beneficiary households in household size, land size, livestock and crop diversification were significant at less than 1% probability level. Graduated households had highest mean household size in adult equivalence (3.95), followed by non-beneficiaries (3.55) and beneficiaries (2.93). The average number of years graduated households benefited from PSNP were 6.42 which is higher than beneficiary households (4.95) ().
Table 2. Summary statistics for continuous variables by PSNP participation.
The chi-square test result demonstrated that marital status and credit usage had statistically significant association with the three groups at a probability level less than 1% (). Majority of the sample respondents were married household heads in the graduated (75%) and non-beneficiary (66.2%). Graduated households had highest percentage of credit use (34.8%). Whereas 24.6% of beneficiaries and 17.7% of non-beneficiaries were received credit. There is no significant difference in experiencing drought among beneficiary, graduate and non-beneficiary.
Table 3. Descriptive results for categorical variables by PSNP participation.
3.2. Food security status and PSNP participation
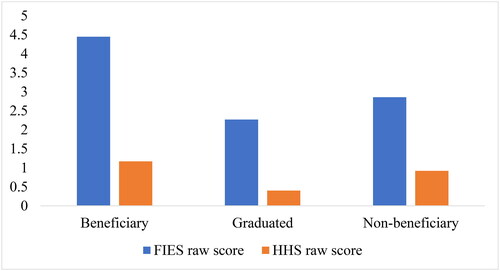
The F-test result showed that the mean difference in raw scores of FIES and HHS between beneficiary, graduate, and non-beneficiary households was statistically significant at the 1% level of significance (). It should be noted that higher mean raw scores indicate higher food insecurity status. The mean raw scores of FIES and HHS in beneficiary households were 4.45 and 1.17 respectively. Beneficiary households had the highest raw scores as compared with graduated and non-beneficiary households. Non-beneficiary households mean raw scores were 2.86 in FIES and 0.92 in HHS which were higher than graduated but lower than beneficiaries. Consistent with these results, studies done by Hailu & Amare (Citation2022) and Sabates-Wheeler et al. (2021) found that the food gap in beneficiaries were higher than non-beneficiaries.
Table 4. Comparison in food security status among beneficiary, graduated and non-beneficiary households using FIES and HHS.
As indicated in , using FIES graduated households have the highest percentage of food-secure households at 67.4%, followed by non-beneficiary households at 61.5% and beneficiary households at 34.3%. Similar results were found using HHS with the highest proportion of households with no hunger accounted for graduated household (90.9%) followed by non-beneficiary households (72.7%) and beneficiary households (62.7%). The percentages of severely food insecure households were highest in beneficiary households (36.6%). Moreover, about 37.3% of beneficiary households were experienced moderate or severe hunger due to food shortages. Sabates-Wheeler et al. (2021) also finds that the level of transfer provided by PSNP is not sufficient to support households in attaining sustainable livelihoods and escaping poverty. Dejene & Cochrane (Citation2022) also showed that delayed and unpredictable payments resulting in household indebtedness and increased vulnerability in PSNP beneficiary.
As shown in , the mean of FIES and HHS for graduated households is also lower than both beneficiary and non-beneficiary households. Graduated households mean raw scores of FIES and HHS were 2.27 and 0.40 respectively. Therefore, it indicated that graduated households have better food security status, followed by non-beneficiary households, and then beneficiary households.
Figure 2. Mean plots of Food Insecurity Experience scale and Household hunger scale by PSNP participations.
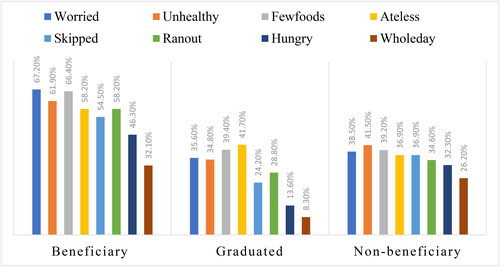
In FIES, the severity of food insecurity increases from question 1 (Worried) to question 8 (Wholeday) for households which responded confirmative answers for theses FIES questions. Among beneficiary, graduated and non-beneficiary households as shown in , the proportion of households which experienced ‘running out of food’ (Runout), ‘hungry but did not eat’ (Hungry), and ‘went without eating for a whole day’ (Wholeday) were lowest in graduated households. On the other hand, highest percentages of beneficiary households were faced ‘running out of food’ (Runout)(58.2%), ‘hungry but did not eat’ (Hungry)(46.3%), and ‘went without eating for a whole day’ (Wholeday)(32.1%) as compared to both graduated and non-beneficiary households. In non-beneficiary households, about 26.2% of households responded as they ‘went without eating for a whole day’ (Wholeday) because of shortage of food or lack of resources.
Figure 3. FIES questions and PSNP participation.
3.3. Determinants of household food security status of PSNP beneficiary, graduated and non-beneficiary
As shown in , different factors significantly determined the household food security status of PSNP beneficiaries, graduates, and non-beneficiaries. Among the determinants, livelihood zone, drought, number of years benefited from PSNP, number of clinic visits, and credit significantly determined beneficiary household food security status. The food security status of graduated households was determined by number of years benefited from PSNP, number of clinic visits, livestock, crop diversification, and dependency ratio were significantly associated with their household food security. The significant factors which affected non-beneficiary household food security were number of clinic visits, land size, livestock, dependency ratio, amount of chemical fertilizer, marital status, and household size.
Table 5. Coefficients and marginal effects of Binary Probit estimation of determinants of household food security using FIES.
Dependency ratio had a significant negative impact on food security status of both graduated and non-beneficiary households at p < 0.05. This show that an increase in dependency ratio results in a decrease in food security status of graduated and non-beneficiary households. A unit increase in dependency ratio is associated with a 14.8% and 12.2% reduction in the likelihood of graduated and non-beneficiary households’ food security status, respectively.
Household size negatively and significantly determined food security status of non-beneficiary households. An increase in household size leads to a 6.5% decrease in food security status of non-beneficiary households. This might be due to the larger household size and dependency ratio can lead to increased food insecurity due to resource constraints. This resources shortage makes it difficult to provide adequate food for all members, accessing education and healthcare services which can result the cycle of limited resources and food insecurity. This result is in line with studies done by Agidew & Singh (Citation2018), Awoke et al. (Citation2022), Ayal et al. (Citation2023), Bahiru et al. (Citation2023), Feyisa et al. (Citation2023), Getaneh et al. (Citation2022), Mekonnen et al. (Citation2021) and Tigistu & Hegena (Citation2022). In contrary to this result, Assefa & Abide (Citation2023) and Melketo et al. (Citation2021) found that an increase in household size positively contributes to food security. Conversely, marital status had positively associated with food security status of non-beneficiary households at p < 0.05. The household heads who are married had 13.8% higher probability to be food secure than single household heads in non-beneficiary. A possible reason for this is because married household heads have better access to land which enable them in increasing their agricultural production.
The number of years benefiting from PSNP had a significant negative impact on the food security status of beneficiary and graduated households at p < 0.05. An increase in the number of years benefited from PSNP decreased the probability to be food secure by 4.8% and 1.6% in beneficiary and graduated households, respectively. This implies that households who stayed for longer period are less likely to be food secure. This might be partly attributed to the inadequacy of PSNP payments to improve food security and accumulate assets, rapid food price inflation, and dependency. Sabates-Wheeler et al. (2021) found that the level of transfer provided by PSNP is not sufficient to support households in attaining sustainable livelihoods and escaping poverty. Ethiopia has experienced increasing food price inflation since 2009 (Kuma & Gata, Citation2023), which could reduce the PSNP payments purchasing power. A study done by Araya & Holden (Citation2017) using panel data also found that PSNP beneficiaries built larger family size than non-beneficiaries in anticipation of gaining more support from the program. In graduated households, the negative association between numbers of years benefited in the program and household food security might be partly attributed to low graduation benchmark which do not reflect the actual livelihood improvement, and premature graduation. Sabates-Wheeler et al. (2021) indicated that households were graduated from PSNP to fulfil the quotas taking duration of participation in PSNP (five years or more) as graduation criteria.
Credit use is negatively and significantly associated with beneficiary household food security at p < 0.01. The probability of credit users’ to be food secure is decreased by 23.1% as compared to credit non-users. This might be attributed to misuse of credit for non-productive spending which could aggravate their household food insecurity. This explanation is supported by the key informant interview results. The key informant (District PSNP coordinator) said that: “In PSNP targeted areas, food insecure households are given priority to get credit in low interest rate. Farmers primarily borrowed credit for buying agricultural inputs such as improved seeds, chemical fertilizers, pesticides, and livestock, which help them to improve their agricultural production and diversify income. However, most farmers misuse the credit by diverting it to cover non-productive expenditures such as for construction and renovation of homes, weddings, funeral, religious holidays, and other social events. Some farmers also use the credit to meet their immediate food needs. To pay back their debt, they usually sell their productive assets such as livestock, and rent out their land which affects their agricultural production.” Thus, misuse of credit for unproductive activities such as house construction and renovation, weddings, funerals, religious holidays, and other social events worsens the current and future household food security of credit users. In line with the findings of this study, studies done by Aweke et al. (Citation2022) in Ethiopia and Danso-Abbeam et al. (Citation2022) in Ghana found that households with access to credit are less likely to be food secure than those without access. In contrary to this finding, studies done by Bahiru et al. (Citation2023), Getaneh et al. (Citation2022), Melketo et al. (Citation2021), Muche & Tolossa (Citation2022), Tefera et al. (Citation2022) and Woleba et al. (Citation2023) found that credit access positively associated with household food security. The deviation might be attributed to the difference in study areas where most of these studies were done in non-PSNP targeted and not chronically food insecure areas. In chronically food insecure areas, poor households have difficulty in borrowing enough to improve their household food security due to a lack of sufficient collateral.
Drought is found negatively influenced beneficiary household food security. It decreased the likelihood of beneficiary households to be food secure by 33.8%. Rainfed agriculture, a primary livelihood for many Ethiopian households, is highly vulnerable to droughts, leading to crop failure and income loss. This result is consistent with studies by Ayal et al. (Citation2023), Bahiru et al. (Citation2023), Feyisa et al. (Citation2023), Sisha (Citation2020) and Tora et al. (Citation2021).
Land had a significant and positive effect only on non-beneficiary household food security. An increase in land size increased the likelihood of non-beneficiary households to be food secure by 18.7%. Land is a critical productive asset, which enable households to increase their agricultural production, generate income, and diversify livelihoods. This finding is similar with studies conducted by Assefa & Abide (Citation2023), Awoke et al. (Citation2022), Bahiru et al. (Citation2023), Feyisa et al. (Citation2023), Mekonnen et al. (Citation2021), Mota et al. (Citation2019) and Woleba et al. (Citation2023) who reported that an increase in land size positively contributed to household food security. Similarly, livestock ownership is positively and significantly influenced both graduated and non-beneficiary households’ food security. An increase in livestock increased the probability of graduated and non-beneficiary household to be food secure by 7.5% and 9.4% respectively. In Ethiopia, livestock are used for ploughing to produce crops. Therefore, an increase in livestock size contribute to increase agricultural production and reduce food insecurity. They also serve as a source of food and income. This finding is in line with (Aragie & Genanu, Citation2017; Ayal et al., Citation2023; Bahiru et al., Citation2023; Feyisa et al., Citation2023; Getaneh et al., Citation2022; Woleba et al., Citation2023).
Chemical fertilizer improves non-beneficiary households’ food security status. An increase in the amount of chemical fertilizer increased the likelihood of non-beneficiary households to be food secure by 0.1%. This could be attributed to fertilizer enable households to improve their crop production which enhances food security. This result is consistent with studies done by Aweke et al. (Citation2021), Bahiru et al. (Citation2023), Misgina (Citation2014) and Mota et al. (Citation2019). Moreover, an increase in the number of crops varieties produced increased the likelihood of graduated household to be food secure by 7.2%. This might be due to the reason that different crop varieties have varying tolerance level for extreme weather shocks such as drought.
The number of clinic visits by household head is the only factor that negatively associated with the food security status of beneficiary, graduated and non-beneficiary households. An increase in number of clinic visits reduced the probability of household to be food secure by 4.7% in beneficiary, 5.1% in graduated and 2.2% in non-beneficiary households. Frequent visits to clinics due to health problems could lead to financial burdens, reduced productivity, and income loss which can create a cycle of food insecurity and poor health.
The difference in livelihood zone is significantly associated with beneficiary households’ food security. Those households which are located in Southwest and Central highland livelihood zones are more likely to be food secure as compared to Abay beshilo by 44.6% and 25.6%, respectively. Abay beshilo livelihood zone is characterized by lowland geography and erratic rainfall which might contributed to the lower food security. Atara et al. (Citation2019) study showed that the differences in livelihood zones have significant effect on the household’s food security status. Consistent with the findings of this study, Zeleke et al. (Citation2023) showed also that households located in the lowland agroecology are relatively more vulnerable to climate risks, followed by those living in the highland and midland agroecology.
4. Conclusion
Understanding the food security status and its determinants is required to improve food security through providing policy makers evidence to design effective food security interventions. The study found that there is a significant difference in household food security among beneficiary, graduated and non-beneficiary both in FIES and HHS. Graduated households had better household food security status than both beneficiary and non-beneficiary households. Whereas beneficiary households showed the lowest household food security. The determinants of household food security also vary among PSNP beneficiary, graduated and non-beneficiary. The binary probit model showed the number of clinic visits by household head is the only factor that negatively associated with all the three groups. The number of years benefited from PSNP had a negative influence on both beneficiary and graduated households’ food security. Whereas livestock had a positive effect on the food security of both graduated and non-beneficiary households, unlike dependency ratio. Livelihood zone, drought, and credit were only associated with beneficiary household food security, while crop diversification determined only graduated households’ food security. The significant factors which affected only non-beneficiary household food security were land size, amount of chemical fertilizer, marital status, and household size.
Therefore, the findings of this study suggests that policy makers and practitioners should consider the differences in food security status and determinants among PSNP beneficiary, graduated and non-beneficiary to design effective food security interventions. To address the negative association of number of years benefited from PSNP and household food security, the program needs to limit the duration of participation with the provision of sufficient transfer to improve food security. Given the positive impact of livestock ownership on food security, there should be efforts to promote livestock production and diversify income sources for households. Proper financial literacy training should be provided to households to ensure the effective use of credit for productive purposes rather than non-productive spending. Improving healthcare access and awareness can help reduce the frequency of clinic visits due to health problems, which could have a positive impact on food security. Moreover, diversify the crop varieties and implement drought adaptation strategies that will help to reduce the impacts of drought and improve food security. Food security interventions also need to consider livelihood zone differences. This study has limitation on not selecting non-beneficiaries and graduates whose wealth rankings are close to the benchmarks for more robust comparisons due to lack of wealth ranking information in the sample frame. Further studies should be done on the impact of credit and the duration of PSNP participation on household food security in PSNP targeted areas.
Supplementary material.docx
Download MS Word (42.5 KB)Disclosure statement
No potential conflict of interest was reported by the authors.
Additional information
Notes on contributors
Yednekachew Merkeb
Yednekachew Merkebis a lecturer in the Department of Disaster Risk Management and Sustainable Development at Bahir Dar University, Ethiopia. He received his B.Sc. in Disaster Risk Management and Sustainable Development in 2010 and his Master of Public Health in 2014 from Bahir Dar University; and his MSc in Dryland Science from Tottori University, Japan, in 2022. He is currently pursuing his PhD at Tottori University, Japan. His research interests include food security, nutrition, public health, disaster risk management, programme impact evaluation, and sustainable development.
Kumi Yasunobu
Kumi Yasunobuis a Professor in the Faculty of Agriculture, Tottori University, Japan.
Asres Elias
Asres Eliasis an Associate Professor in the Faculty of Agriculture, Tottori University, Japan.
Birara Endalew
Birara Endalewis a lecturer at Bahir Dar University, Ethiopia.
References
- Agidew, A. m A., & Singh, K. N. (2018). Determinants of food insecurity in the rural farm households in South Wollo Zone of Ethiopia: The case of the Teleyayen sub-watershed. Agricultural and Food Economics, 6(1), 1–23. https://doi.org/10.1186/s40100-018-0106-4
- Andersson, C., Mekonnen, A., & Stage, J. (2011). Impacts of the productive safety net program in Ethiopia on livestock and tree holdings of rural households. Journal of Development Economics, 94(1), 119–126. https://doi.org/10.1016/j.jdeveco.2009.12.002
- Aragie, T., & Genanu, S. (2017). Level and determinants of food security in North Wollo Zone (Amhara Region – Ethiopia). Journal of Food Security, 5(6), 232–247. https://doi.org/10.12691/jfs-5-6-4
- Araya, G. B., & Holden, S. T. (2017). Is Ethiopia’s productive safety net program enhancing dependency? Standard-Nutzungsbedingungen, (Working Paper, No. 5/17), 1–38. http://hdl.handle.net/10419/242752
- Assefa, T., & Abide, E. B. (2023). Determinants of food insecurity in rural households: A case of lemo district, southern Ethiopia. Heliyon, 9(1), e12764. https://doi.org/10.1016/j.heliyon.2022.e12764
- Atara, A., Tolossa, D., & Denu, B. (2019). Assessment of food security situation of the rural households: The case of Boricha Woreda of Sidama Zone, Ethiopia. GeoJournal, 86(2), 711–727. https://doi.org/10.1007/s10708-019-10094-2
- Aweke, C. S., Hassen, J. Y., Wordofa, M. G., Moges, D. K., Endris, G. S., & Rorisa, D. T. (2021). Impact assessment of agricultural technologies on household food consumption and dietary diversity in eastern Ethiopia. Journal of Agriculture and Food Research, 4, 100141. https://doi.org/10.1016/j.jafr.2021.100141
- Aweke, C. S., Sassi, M., Lahiff, E., & Wordofa, M. G. (2022). Seasonality and food security among smallholder rural households in eastern Ethiopia: Evidence from panel data analysis. Cogent Economics & Finance, 10(1), 1–15. https://doi.org/10.1080/23322039.2022.2035492
- Awoke, W., Eniyew, K., Agitew, G., & Meseret, B. (2022). Determinants of food security status of household in Central and North Gondar Zone, Ethiopia. Cogent Social Sciences, 8(1), 1–12. https://doi.org/10.1080/23311886.2022.2040138
- Ayal, D. Y., W/Michael, T., Getahun, A. B., Ture, K., Zeleke, T. T., & Tesfaye, B. (2023). Climate variability induced household food insecurity coping strategy in Gambella Zuria Woreda, Southwestern, Ethiopia. Climate Services, 30, 100382. https://doi.org/10.1016/j.cliser.2023.100382
- Bahiru, A., Senapathy, M., & Bojago, E. (2023). Status of household food security, its determinants, and coping strategies in the Humbo district, Southern Ethiopia. Journal of Agriculture and Food Research, 11, 100461. https://doi.org/10.1016/j.jafr.2022.100461
- Bahru, B. A., & Zeller, M. (2022). Gauging the impact of Ethiopia’s productive safety net programme on agriculture: Application of targeted maximum likelihood estimation approach. Journal of Agricultural Economics, 73(1), 257–276. https://doi.org/10.1111/1477-9552.12452
- Bahru, B. A., Jebena, M. G., Birner, R., & Zeller, M. (2020). Impact of Ethiopia’s productive safety net program on household food security and child nutrition: A marginal structural modeling approach. SSM - Population Health, 12, 100660. https://doi.org/10.1016/j.ssmph.2020.100660
- Ballard, T., Coates, J., Swindale, A., & Deitchler, M. (2011). Household Hunger Scale: Indicator Definition and Measurement Guide (Project, FHI 360). www.fantaproject.org
- Bendel, R. B., & Afifi, A. A. (1977). Comparison of Stopping Rules in Forward “Stepwise” Regression. Journal of the American Statistical Association, 72(357), 46–53. https://doi.org/10.1080/01621459.1977.10479905
- Béné, C., Devereux, S., & Sabates-Wheeler, R. (2012). Shocks and social protection in the Horn of Africa: Analysis from the productive safety net programme in Ethiopia. In IDS Working Papers, 2012(395), 1–120. https://doi.org/10.1111/j.2040-0209.2012.00395.x
- Berhane, G., Gilligan, D. O., Hoddinott, J., Kumar, N., & Taffesse, A. S. (2015). Can social protection work in Africa? The impact of Ethiopia’s productive safety net programme. Economic Development and Cultural Change, 63(1), 1–26. https://doi.org/10.1086/677753
- Berhane, G., Hoddinott, J., & Kumar, N. (2017). The impact of Ethiopia’s Productive Safety Net Programme on the nutritional status of children. Essp Working Paper, 99, 2008–2012.
- Berlie, A. B. (2014). The role of productive safety nets in improving household food dietary diversity in the Amhara Region of Ethiopia: A case study on Lay Gayint District. Ethiopian Journal of Health Development, 28(3), 191–201.
- Borga, L. G., & D’Ambrosio, C. (2021). Social protection and multidimensional poverty: Lessons from Ethiopia, India and Peru. World Development, 147, 105634. https://doi.org/10.1016/j.worlddev.2021.105634
- Danso-Abbeam, G., Asale, M. A., & Ogundeji, A. A. (2022). Determinants of household food insecurity and coping strategies in Northern Ghana. GeoJournal, 88(2), 2307–2324. https://doi.org/10.1007/s10708-022-10742-0
- Debela, B. L., Shively, G., & Holden, S. T. (2015). Does Ethiopia’s Productive Safety Net Program improve child nutrition? Food Security, 7(6), 1273–1289. https://doi.org/10.1007/s12571-015-0499-9
- Dejene, M., & Cochrane, L. (2022). Safety nets as a means of tackling chronic food insecurity in rural southern Ethiopia: What is constraining programme contributions? Canadian Journal of Development Studies / Revue Canadienne D'études du Développement, 43(2), 157–175. https://doi.org/10.1080/02255189.2021.1914559
- Desalegn, G., & Ali, S. N. (2018). Review of the impact of Productive Safety Net Program (PSNP) on rural welfare in Ethiopia Standard-Nutzungsbedingungen (No. 173; ZEF Working Paper Series). http://hdl.handle.net/10419/187479
- Devereux, S., & Ulrichs, M. (2015). Stakeholder perceptions on graduation in Ethiopia and rwanda. IDS Bulletin, 46(2), 145–154. https://doi.org/10.1111/1759-5436.12137
- Enebise Sar Medir District Agriculture Office (ESMDAO). (2022). Agriculture office 2021/2022 annual report.
- FAO, IFAD, UNICEF, WFP & WHO. (2021). The state of food security and nutrition in the world 2021. Transforming Food Systems for Food Security, Improved Nutrition and Affordable Healthy Diets for All. https://doi.org/10.4060/cb4474en
- Feleke, S. T.,Kilmer, R. L., &Gladwin, C. H. (2005). Determinants of food security in Southern Ethiopia at the household level. Agricultural Economics, 33(3), 351–363.
- Feyisa, B. W., Haji, J., & Mirzabaev, A. (2023). Determinants of food and nutrition security: Evidence from crop-livestock mixed farming households of central and eastern Ethiopia. Journal of Agriculture and Food Research, 12, 100556. https://doi.org/10.1016/j.jafr.2023.100556
- Gebrehiwot, T., & Castilla, C. (2019). Do safety net transfers improve diets and reduce undernutrition? Evidence from Rural Ethiopia. The Journal of Development Studies, 55(9), 1947–1966. https://doi.org/10.1080/00220388.2018.1502881
- Getaneh, Y., Alemu, A., Ganewo, Z., & Haile, A. (2022). Food security status and determinants in North-Eastern rift valley of Ethiopia. Journal of Agriculture and Food Research, 8, 100290. https://doi.org/10.1016/j.jafr.2022.100290
- Gilligan, D. O., Hoddinott, J., & Taffesse, A. S. (2009). The Impact of Ethiopia’s productive safety net programme and its linkages. Journal of Development Studies, 45(10), 1684–1706. https://doi.org/10.1080/00220380902935907
- Hailu, A. G., & Amare, Z. Y. (2022). Impact of productive safety net program on food security of beneficiary households in western Ethiopia: A matching estimator approach. PloS One, 17(1), e0260817. https://doi.org/10.1371/journal.pone.0260817
- Hoddinott, J., Berhane, G., Gilligan, D. O., Kumar, N., & Taffesse, A. S. (2012). The impact of Ethiopia’s productive safety net programme and related transfers on agricultural productivity. Journal of African Economies, 21(5), 761–786. https://doi.org/10.1093/jae/ejs023
- Kuma, B., & Gata, G. (2023). Factors affecting food price inflation in Ethiopia: An autoregressive distributed lag approach. Journal of Agriculture and Food Research, 12, 100548. https://doi.org/10.1016/j.jafr.2023.100548
- Mekonnen, A., Tessema, A., Ganewo, Z., & Haile, A. (2021). Climate change impacts on household food security and farmers adaptation strategies. Journal of Agriculture and Food Research, 6, 100197. https://doi.org/10.1016/j.jafr.2021.100197
- Melketo, T., Schmidt, M., Bonatti, M., Sieber, S., Müller, K., & Lana, M. (2021). Determinants of pastoral household resilience to food insecurity in Afar region, northeast Ethiopia. Journal of Arid Environments, 188(March), 104454. https://doi.org/10.1016/j.jaridenv.2021.104454
- Ministry of Agriculture (MOA). (2014). Productive safety net programme phase IV. Programme Implementation Manual (PIM), Vol. Version 1, 1–179.
- Ministry of Agriculture and Rural Development (MOARD) & USAID. (2009). An Atlas of Ethiopian Livelihoods: The Livelihoods Integration Unit
- Ministry of Agriculture and Rural Development (MOARD). (2010). Productive safety net programme: Programme implementation manual.
- Misgina, A. (2014). Rural household food security status and its determinants: The case of Laelaymychew Woreda, Central Zone of Tigrai, Ethiopia. Journal of Agricultural Extension and Rural Development, 6(5), 162–167. https://doi.org/10.5897/JAERD2013.0555
- Mota, A. A., Lachore, S. T., & Handiso, Y. H. (2019). Assessment of food insecurity and its determinants in the rural households in Damot Gale Woreda, Wolaita zone, southern Ethiopia. Agriculture & Food Security, 8(1), 1–11. https://doi.org/10.1186/s40066-019-0254-0
- Muche, M., & Tolossa, D. (2022). Comparative analysis of housheold food insecurity between selected coffee and wheat growers of Ethiopia. Cogent Food & Agriculture, 8(1), 2149134. https://doi.org/10.1080/23311932.2022.2149134
- Porter, C., & Goyal, R. (2016). Social protection for all ages? Impacts of Ethiopia’s Productive Safety Net Program on child nutrition. Social Science & Medicine (1982), 159, 92–99. https://doi.org/10.1016/j.socscimed.2016.05.001
- Sabates‐Wheeler, R., Lind, J., Hoddinott, J., & Tefera Taye, M. (2021). Graduation after 10 years of Ethiopia’s Productive Safety Net Programme: Surviving but still not thriving. Development Policy Review, 39(4), 511–531. https://doi.org/10.1111/dpr.12515
- Sabates-Wheeler, R., Mulugeta, T., & Girma, B. (2012). Assessing enablers and constrainers of graduation: Evidence from the food security programme, Ethiopia (FAC Working Paper 44). www.future-agricultures.org
- Sileshi, M., Kadigi, R., Mutabazi, K., & Sieber, S. (2019). Analysis of households’ vulnerability to food insecurity and its influencing factors in East Hararghe, Ethiopia. Journal of Economic Structures, 8(1), 1–17. https://doi.org/10.1186/s40008-019-0174-y
- Singh, I., Squire, L., & Strauss, J. (1986). Agricultural household models: Extensions, applications and policy. The Johns Hopkins University Press.
- Sisha, T. A. (2020). Household level food insecurity assessment: Evidence from panel data, Ethiopia. Scientific African, 7, e00262. https://doi.org/10.1016/j.sciaf.2019.e00262
- Storck, H., Emana, B., Adnew, B., Borowiccki, A., & Woldehawariat, S. (1991). Farming systems and resource economics in the tropics: Farming system and farm management practices of smallholders in the Hararghe Highland (vol. II). Wissenschaftsverlag Vauk.
- Tadesse, T., & Gebremedhin Zeleke, T. (2022). The impact of the productive safety net program (PSNP) on food security and asset accumulation of rural households’: Evidence from Gedeo zone, Southern Ethiopia. Cogent Economics & Finance, 10(1), 1–28. https://doi.org/10.1080/23322039.2022.2087285
- Tefera, S. A., Tadesse, T. B., & Asmare, W. (2022). Prevalence of household food insecurity in Ethiopia during the COVID-19 pandemic: Evidence from panel data Coping Strategy Index Ethiopia Food insecurity Panel data. Scientific African, 16, e01141. https://doi.org/10.1016/j.sciaf.2022.e01141
- Tigistu, S., & Hegena, B. (2022). Determinants of food insecurity in food aid receiving communities in Ethiopia. Journal of Agriculture and Food Research, 10, 100391. https://doi.org/10.1016/j.jafr.2022.100391
- Tora, T. T., Degaga, D. T., & Utallo, A. U. (2021). Drought vulnerability perceptions and food security status of rural lowland communities: An insight from Southwest Ethiopia. Current Research in Environmental Sustainability, 3, 100073. https://doi.org/10.1016/j.crsust.2021.100073
- UNDP. (2022). Ethiopia 2030: A country transformed? Options for a next generation of reforms (No.2; Working Paper Series).
- Wambogo, E. A., Ghattas, H., Leonard, K. L., & Sahyoun, N. R. (2018). Validity of the Food insecurity experience scale for use in sub-saharan Africa and characteristics of food-insecure individuals. Current Developments in Nutrition, 2(9), nzy062. https://doi.org/10.1093/cdn/nzy062
- Weldegebriel, Z. B., & Prowse, M. (2013). Climate-change adaptation in Ethiopia: To what extent does social protection influence livelihood diversification? Development Policy Review, 31(s2), o35–o56. https://doi.org/10.1111/dpr.12038
- Welteji, D., Mohammed, K., & Hussein, K. (2017). The contribution of Productive Safety Net Program for food security of the rural households in the case of Bale Zone, Southeast Ethiopia. Agriculture & Food Security, 6(1), 1–12. https://doi.org/10.1186/s40066-017-0126-4
- Woleba, G., Tadiwos, T., Bojago, E., & Senapathy, M. (2023). Household food security, determinants and coping strategies among small-scale farmers in Kedida Gamela district, Southern Ethiopia. Journal of Agriculture and Food Research, 12, 100597. https://doi.org/10.1016/j.jafr.2023.100597
- Workie, D. L., & Tesfaw, L. M. (2021). Bivariate binary analysis on composite index of anthropometric failure of under-five children and household wealth-index. BMC Pediatrics, 21(1), 332. https://doi.org/10.1186/s12887-021-02770-5
- World Food Programme (WFP). (2009). Comprehensive food security & vulnerability analysis guidelines.
- Yamane, T. (1967). Statistics: An introductory analysis (2nd ed.). Harper and Row.
- Yovo, K., &Gnedeka, K. T. (2023). Assess the level and the determinants of household food security in Togo: The food expenditures approach. Scientific African, 20, e01685.
- Zeleke, G., Teshome, M., & Ayele, L. (2023). Farmers’ livelihood vulnerability to climate-related risks in the North Wello Zone, northern Ethiopia. Environmental and Sustainability Indicators, 17, 100220. https://doi.org/10.1016/j.indic.2022.100220