
ABSTRACT
Colorectal cancer (CRC) is a heterogeneous disease that requires new diagnostic and prognostic markers. Integrated bioinformatics approach to identify novel therapeutic targets associated with CRC. Using GEO2R identified DEGs in CRC, and Funrich software facilitated the visualization of DEGs through Venn diagrams. From a total of 114 enhanced DEGs, potential hub genes were further filtered based on their nodal strength and edges using STRING database. To gain insights into the functional roles of these hub genes, gene ontology and pathway enrichment were conducted thorough g: profiler web server. Subsequently, overall survival plots from GEPIA and oncogenic predictive functions like mRNA expressions for stages and nodal metastasis were employed to identify hub genes in CRC patient samples. Additionally, the cBioPortal and HPA databases also revealed genetic alterations and expression levels in these hub genes in CRC patients, further supporting their involvement in colorectal cancer. Gene expression by RT-PCR shows upregulation of hub genes in HT-29 cells. Finally, our integrated bioinformatic analysis revealed that ABCE1, AURKA, HSPD1, PHKA1, CDK4, and YWHAE as hub genes with potential oncogenic roles in CRC. These genes hold promise as diagnostic and prognostic markers for colorectal tumorigenesis, providing insights into targeted therapies for improved patient outcomes.
Introduction
Throughout the world, colorectal cancer is a serious issue for public health.Citation1 It remains a significant global health concern, with approximately 6,55,000 deaths reported annually worldwide. According to the World Health Organisation (WHO, 2012) and the National Cancer Institute (NCI, 2012), it is the third most common cause of cancer-related deaths in the Western world and the fourth most prevalent type of cancer in the United States.Citation2, Citation3 India is also experiencing a substantial incidence of colorectal cancer. Firstly, there has been population growth in India, leading to a larger number of individuals whose occurrence of colorectal cancer is at risk.Citation4 Additionally, aging population in India plays a role in the increased incidence of colorectal cancer, as age is a known risk factor for the disease.Citation5 Furthermore, the economic transition that India has been undergoing also contributes to the heightened susceptibility to colorectal cancer. Among the various factors that bring something to the development of colon cancer, environmental factors have been identified as the most influential in its etiology.Citation6 Changes in the way we eat and lifestyle that are related to economic development, like as a shift toward a more sedentary lifestyle and the consumption of processed and unhealthy foods, are recognized colorectal cancer risk factors. The process of colorectal carcinogenesis is widely recognized as a complex series of events occurring at the cellular and molecular levels.Citation7, Citation8 During this multistep process, normal cells undergo a transformation into malignant cells. This progression toward colorectal cancer is thought to occur gradually, following a stepwise pattern characterized by the development of many mutations in tumor suppressor and proto-oncogenes. These mutations significantly contribute to the initiation and spread of colon cancer.Citation9–12
In current times, the utilization of microarray technology has greatly contributed to our comprehension of disease mechanisms, presenting diverse possibilities for applications. By merging this technology with bioinformatics, we acquire a comprehensive methodology that enables the identification of genes associated with tumors and the unraveling of their regulatory mechanisms.Citation13 This integrated approach allows for an in-depth exploration of differentially expressed genes that are crucial in the beginning and advancement of colorectal cancer (CRC). The National Centre for Biotechnology Information (NCBI) created and maintains the Gene Expression Omnibus (GEO), an open gene expression database serves as a platform for collecting and public sharing various data sets from high-throughput functional genomics, including microarrays and next-generation sequencing data.Citation14 By utilizing GEO to access and analyze these datasets, facilitating the investigation of gene expression patterns and their associations with different biological processes.
The publicly financed Cancer Genome Atlas (TCGA) project intends to create an exhaustive cancer atlas by identifying and analyzing major genetic changes that underlie distinct types of cancer. Information on many cancer forms is available in the TCGA database thanks to extensive genome sequencing and multivariate analysis.Citation15 Several databases, such as UALCAN,Citation16 cBioPortal,Citation17 HPA,Citation18 STRING,Citation19 and others, have been developed based on TCGA data sets to facilitate data collection and analysis. Furthermore, visualizing different pipelines for mRNA expressions, networking, DNA methylation, and utilizing tools like Cytoscape,Citation20 Funrich,Citation21 Wanderer,Citation22 and GephiCitation23 can enhance research efforts aimed at identifying significant prognostic markers in various cancers. This comprehensive strategy offers a powerful method to recognize tumor-related genes and elucidating their regulation processes. Additionally, the application of microarray technology allows for in-depth investigations into these key genes, with the goal of identifying potential molecular targets and diagnostic indicators.
The primary objective of our study was to utilize integrated bioinformatic analysis to find possibly important genes linked to the emergence of colorectal cancer (CRC) and investigate their therapeutic targets. Initially, we analyzed microarray data and observed significant upregulation of Differentially Expressed Genes (DEGs) in pathways related to cancer and specifically colorectal cancer. We characterized the DEGs in colorectal cancer using protein-protein interaction (PPI) network analysis, Gene Ontology (GO) function analysis, Kyoto Encyclopaedia of Genes and Genomes (KEGG), and Reactome pathway analysis in order to gain a deeper understanding of the molecular mechanisms underlying CRC pathogenesis. To identify potential key genes function, we conducted survival and expression analysis using mRNA expression on stages, nodal metastasis, and overall survival rates. By integrating survival data and expression patterns, we determined specific hub genes that exhibited promising potential therapeutic targets or as CRC diagnostic biomarkers.
Materials and methods
Data collection
The Gene Expression Omnibus (GEO) database (https://www.ncbi.nlm.nih.gov/geo/), maintained by the National Centre for Biotechnology Information (NCBI), serves as an openly accessible repository for diverse and multidimensional data obtained from microarray experiments and NGS technologies.Citation14 In the search for colorectal cancer (CRC) datasets within GEO, the keyword used was (“colorectal tumorigenesis”[MeSH Terms] OR colorectal cancer [All Fields]) AND “Homo sapiens”[porgn] AND (“Expression profile by microarray”[Filter]). This search yielded a total of 17 datasets, from which four dataset profiles were selected for further analysis. The selection of these datasets was based on specific criteria such as the datasets had to include both colorectal cancer tissue samples and corresponding healthy tissue samples (Control). The analysis required the availability of sufficient clinical data. The datasets containing samples from patients who had undergone treatment and developed therapy resistance were excluded. According to the basis of aforementioned criteria, a total of four gene expression profiles (GSE20916, GSE32323, GSE49355, and GSE33113) for colorectal cancer were retrieved and downloaded from the GEO database. GSE20916 consisted of 30 normal samples and 115 CRC samples. GSE32323 included 17 paired samples of normal and CRC tissues. GSE33113 provided 6 samples of normal tissues and 90 CRC samples. Each dataset was built using the GPL570 Affymetrix platform (Human Genome U133 Plus 2.0 Array). GSE49355 comprised 38 normal samples and 19 CRC samples, and the dataset was based on the GPL96 Affymetrix platform (Human Genome U133A Array).
Microarray data pre-processing
The Series Matrix File(s) of GSE20916, GSE32323, GSE49355, and GSE33113 were obtained from the Gene Expression Omnibus (GEO) database for further analysis. Prior to conducting the analysis, the probes within each dataset were converted into standard gene symbols. This conversion helps to simplify the interpretation of the microarray results by aligning the gene identifiers to a common nomenclature. To ensure comparability and remove any potential technical biases, the four datasets underwent a normalization process using the sturdy multi-array average method. This normalization method, accomplished in the R software (version 2.6.0), adjusts the gene expression data within each dataset to a common scale and distribution. By normalizing the data, any systematic variations between samples or experimental conditions are minimized, allowing for more reliable comparisons and analysis across the datasets. GSEA (Gene Set Enrichment Analysis) is a powerful software tool designed for the comprehensive evaluation as well as interpretation gene expression data obtained from microarrays and RNA-sequencing experiments, which has been utilized for this study.
Identification of DEGs in CRC datasets
In the present research, GEO2R was employed to identify differentially expressed genes (DEGs) in the CRC datasets. The Volcano Plot obtained from GEO2R tool (https://www.ncbi.nlm.nih.gov/geo/geo2r/) displays the y-axis that displays the statistical significance (p-value), while the x-axis displays the fold change in gene expression, facilitating the identification of genes that displayed significant alteration in expression. The DEGs were determined based on specific criteria, including a p-value cutoff of < 0.01 and an absolute log fold change > 1. Additionally, the overlap and differences in DEGs among the four microarray profiles were visualized using FunRich V3.1.3 software.Citation21 The Venn diagram generated by FunRich tool provides a clear visualization of the common molecular targets or pathways shared across the datasets, aiding in the founded key genes or pathways interconnect with CRC.
PPI network interaction and module analysis of DEGs in CRC
In this study, the PPI network was examined using DEGs from CRC datasets and the STRING database, an online tool for analyzing protein-protein interactions (https://string-db.org/). The combined score > 0.08 was seen as important of the interactions, indicating the reliability of the protein associations.Citation19 The resulting DEGs were used to build and visualize the PPI network using Cytoscape software (version 3.5.1; http://www.cytoscape.org).Citation20 In the constructed PPI network, the edges connecting the proteins were assigned width based on the combined score, reflecting the strength of the interactions between the proteins. Hub genes were referred to be nodes with a degree > 10, indicating their importance in the network. To identify highly related gene clusters within the PPI network, the MCODE plugin of Cytoscape was utilized. By setting the parameters such as a node score cutoff of 0.2, a k-core value of 2, and a maximum depth of 100, the plugin detected and extracted core modules or clusters of closely connected genes. These gene clusters likely represent functional units or pathways within the network.
Gene ontology (GO) and pathway enrichment analysis
Functional and pathway enrichment analysis is a crucial step in uncovering the biological significance of discovered DEGs and gene clusters. To further understand the involvement of up-regulated and down-regulated hub genes biological functions and potentially enriched pathways in this study was carried out by g: profiler database (https://biit.cs.ut.ee/gprofiler/).Citation24 This tool provides systematic and uniform annotations that group genes into molecular functions (MF), cellular components (CC), and biological processes (BP). Additionally, KEGG and Reactome pathway analyses were carried out to find pathways that displayed noticeably greater enrichment with the discovered DEGs.Citation25,Citation26 The thresholds for pathway crosstalk analysis were set as a Benjamini-Hochberg adjusted p-value <.05 and a combination of the Jaccard Coefficient (50%) and Overlap Coefficient (50%) >0.5 consider as a statistically significant. By analyzing the DEGs within specific pathways, their potential roles in key biological processes and regulating pathways can be determined.
mRNA expression and survival analysis of hub genes
To investigate survival rate and the relationship between important genes of colorectal cancer (CRC) patients, the study employed several databases, including UALCAN (http://ualcan.path.uab.edu/), GEPIA (http://gepia.cancer-pku.cn/),Citation27 and KM plotter (https://kmplot.com/analysis/). Survival analysis was executed using the Kaplan-Meier method along with log-rank tests. A significance threshold of p < .05 was used to determine statistical significance, indicating a significant association between gene expression levels and patient survival. For expression validation, CRC patient information from The Cancer Genome Atlas (TCGA) were utilized. Based on the number of transcripts per million (TPM) values, the data were split into two categories, which were visualized in the GEPIA database. Patients in the low/medium expression group had TPM values below the upper quartile, while those in the high expression group had TPM values above the upper quartile.
Prognostic characteristics for hub genes
To evaluate the prognostic role for the hub genes, we utilized the mRNA expression for early and advanced stages of hub genes in CRC datasets from GEPIA database (http://gepia.cancer-pku.cn/) and also to find their metastatic property of CRC hub genes were analyzed from UALCAN database (http://ualcan.path.uab.edu/). Moreover, cBio Cancer Genomics Portal (http://cbioportal.org) was utilized to obtain information on the mutation and expression profiles of hub genes from colorectal tissue samples of TCGA datasets.Citation17 The portal offers comprehensive mutation analysis, including the identification of mutations, amplifications, and deletions, across 20 CRC studies. In addition, the study evaluated the protein levels of hub genes in tumor tissues through the Human Protein Atlas (HPA) database (https://www.proteinatlas.org/).Citation18 The HPA database offers information on certain human tissues’ immunohistochemistry-based expression, allowing for the examination of protein expression patterns in different tissue types.
Cell culture
Human colorectal cell line, HT-29 was procured from National Centre for Cell Sciences (NCCS), India. The cells were maintained in CO2 incubator with supplementary of 10% of Fetal Bovine Serum (FBS), 1% of penicillin and streptomycin combinational antibiotics, and DMEM media purchased from Himedia. For mRNA expression analysis, around 5 × 10⁶ of HT-29 cells were seeded and detached using 0.25% trypsin-EDTA in a 6-well plate.
mRNA expression for hub genes in CRC cells
HT-29 cells were seeded at a density of 5 × 10⁶ cells per well in a 6-well plate. The cells were cultured for overnight incubation, and RNA was extracted TRIR, Abgene, UK. The concentration of the extracted RNA was determined using spectrometric quantification and expressed in micrograms (µg).Citation28 To synthesize complementary DNA (cDNA), 2 µg of total RNA was used in conjunction with a reverse transcriptase kit from Eurogentec (Seraing, Belgium) according to the manufacturer’s instructions. For Real-Time PCR analysis (CFX96 Touch Real-Time PCR, Bio-rad, USA), a reaction mixture was prepared using Takara SyBr green master mix (Primer concentration − 0.1 μM, Template RNA − 5ng, RT enzyme − 100 units/μl, dNTPs − 100 μM, Mgcl2 – 3 mM), and specific forward and reverse primers were designed for ABCE1, AURKA, CDK4, HSPD1, PHKA1, and YWHAE. The primer sequences and reaction conditions are listed in . Real-Time PCR cycles consisted of pre-denaturation at 94°C for 2 minutes, followed by 35 cycles of denaturation at 94°C for 1 minute, annealing at 57°C for 30 seconds, extension at 72°C for 30 seconds, and a final extension at 72°C for 10 minutes. Melting analysis was performed, with β-actin serving as an intrinsic positive control. The CT values of each sample were normalized with β-actin, and the relative expression ratio of each gene was determined using the geometric mean of three samples in each group
Table 1. Real-time PCR primers.
Statistical analysis
The statistical computer language R, which is used for statistical computing, was used to do the data analysis for this study. The student’s t-test, a non-parametric statistical test for paired data, was used to compare the matched normal and tumor tissues in the TCGA dataset. The log-rank test was used to determine p-values for the study of mRNA expressions and the creation of Kaplan-Meier plots to evaluate overall survival. Comparing the groups was deemed to be statistically significant at a significance level of *p < .05, **p < .001, and ***p < .0001.
Results
Involvement of DEGs in cancer progression
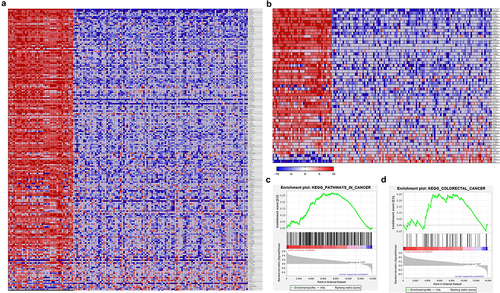
The heatmap cluster analysis of differentially expressed genes obtained from the GEO databaseCitation14 reveals the involvement of these genes in cancer progression, particularly in colorectal cancer. () displays the heatmap clusters, clearly indicating the strong association of these differentially expressed genes with cancer pathways and colorectal cancer. Furthermore, () present the results of Gene Set Enrichment Analysis (GSEA)Citation29 on an RNA sequencing (RNA-seq) dataset, illustrating the upregulation of genes in tumor-related pathways, encompassing the overall differentially expressed cancer-related gene pathways and specifically in colorectal cancer pathways, when compared to non-tumor samples. These initial findings have sparked our interest in identifying significant prognostic markers associated with colorectal tumorigenesis.
Figure 1. The expression patterns of genes compared between normal and colorectal cancer (CRC) samples. (a,b) hierarchical cluster analysis of DEGs from GEO datasets reveals the expression pattern differences between normal and colorectal cancer (CRC) samples. The heatmap illustrates the clustering of samples based on the expression levels of DEGs. Each column represents a different sample, while each row represents a DEG. (c,d) GSEA of the DEGs demonstrates their involvement in cancer pathways and specifically in colorectal cancer. The bar code indicates the number of DEGs, while the green-colored graph represents the enrichment score. The red color indicates upregulation in CRC samples (positively regulated), while the blue color represents downregulation in normal samples (negatively regulated). CRC, colorectal cancer, DEGs, differentially expressed genes, GSEA, Gene Set enrichment analysis.
Identification of DEGs in colorectal carcinogenesis
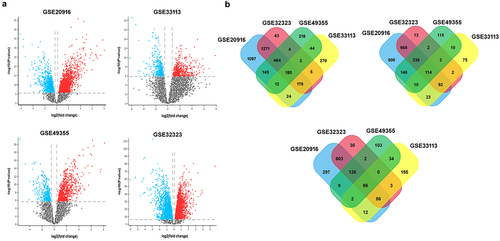
A total of 2,411, 835, 239, and 477 differentially expressed genes (DEGs) were discovered from the colorectal cancer datasets such as GSE20916,Citation30 GSE32323,Citation31 GSE49355,Citation32 and GSE33113,Citation33 respectively. Volcano plots were generated for each dataset using the GEO2R analysis with the Limma package, with a threshold of adjusted p-value <.01 and log fold change > 1 as shown in . The results indicate that the overwhelming majority of DEGs are upregulated in colorectal cancer samples. To identify the common DEGs across the four COAD datasets, we conducted an intersection analysis using FunRich_V3 software.Citation21 displays the expression patterns of the common upregulated and downregulated DEGs identified from the GSE20916, GSE32323, GSE49355, and GSE33113 datasets. The Venn diagram provides a visual representation of the overlapping DEGs among the COAD datasets. The upregulated and downregulated genes from colorectal cancer datasets were enlisted in Supplementary Table S1. These findings revealed that 144 genes are significantly upregulated, while 66 genes are downregulated in colorectal cancer datasets.
Figure 2. Identification of DEGs between normal and CRC samples. (a) The volcano plots depict the differentially expressed genes (DEGs) identified from the colorectal cancer datasets GSE20916, GSE32323, GSE49355, and GSE33113, obtained from the GEO database. The analysis was performed using the web-based tool GEO2R. The DEGs were determined based on specific criteria, with a p-value cutoff of < .01 represented by the vertical line and an absolute log fold change > 1 represented by the horizontal line. In the plots, the blue dots represent down-regulated DEGs, the red dots indicate upregulated DEGs, and non-significant genes are depicted as black dots. (b) The venn diagram illustrates the overlapping and distinct DEGs identified among the four colorectal cancer datasets (GSE20916, GSE32323, GSE49355, and GSE33113). The three sections of the venn diagram represent the overall DEGs, upregulated DEGs, and downregulated DEGs. The numbers indicate the count of genes specifically expressed in each group. The overlapping portions indicate the number of genes expressed in two or more groups. Out of the 180 genes in total, 114 genes are overlapped and upregulated, while 66 overlapped genes are downregulated.
Identification of key genes (KGs) from DEGs using PPI network in CRC
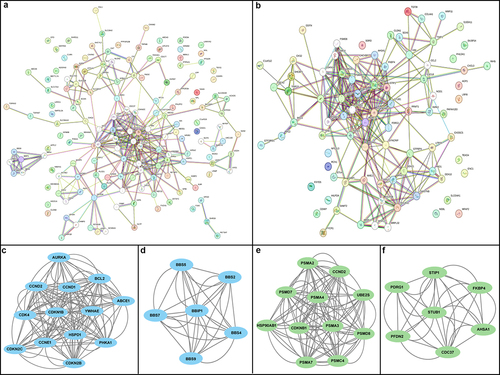
Based on the previous results, we identified upregulated and downregulated genes from colorectal cancer datasets. To analyze their interactions and biological functions in CRC, we utilized STRING databaseCitation19 with a confidence score of > 0.4 and the network was visualized using Cytoscape software.Citation20 We mapped 114 upregulated DEGs and 66 downregulated DEGs into separate protein-protein interaction (PPI) networks. The upregulated DEG network consisted of 127 nodes and 714 edges, while the downregulated DEG network contained 26 nodes and 214 edges (). illustrates the interacting networks of the upregulated and downregulated DEGs, enabling us to assess their biological processes in CRC. To identify significant clusters within the PPI networks, we utilized the MCODE plug-in in Cytoscape software. For upregulated DEGs, two modules were selected: Module 1 with an MCODE score of 11.833 and module 2 with a score of 6.00. These modules consisted of 13 nodes and 142 edges, and 6 nodes and 30 edges, respectively (). For downregulated DEGs, module 1 had 11 nodes and 102 edges, while module 2 had 7 nodes and 34 edges (). These core modules and genes were chosen to go further gene ontology (GO) and pathway analysis to gain insights into their functional roles in CRC tumorigenesis.
Figure 3. Protein-protein interaction (PPI) network analysis and module discovery of CRC differentially expressed genes (GEGs). (a) PPI network from STRING database shows up-regulated DEGs contains overall 127 nodes and 714 edges. The top 2 significant modules were retrieved from MCODE, plugin of Cytoscape software. (b) Module 1 exhibits 13 nodes and 142 edges with score of 11.833, and (c) module 2 shows 6.00 score with 6 nodes and 30 edges, respectively. (d) PPI network analysis show 26 nodes and 214 edges of down-regulated DEGs. Significant top2 modules of down-regulated DEGs were visualized. (e) Module 1 has 11 nodes and 102 edges with 10.20 score, while (f) module 2 had 7 nodes and 34 edges with score of 5.66. The PPI networks were generated using the STRING database with a stringent interaction score threshold of 0.08.
Identification of GO and KEGG/Reactome enrichment analysis of upregulated genes
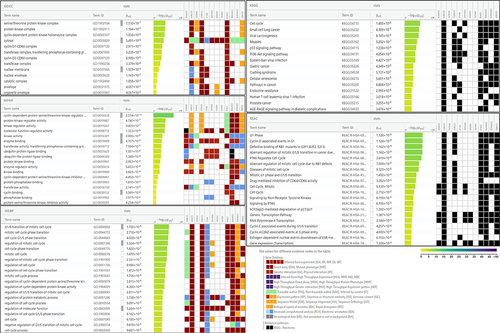
To gain insights into the route enrichment and functional annotation of upregulated DEGs in CRC, we conducted gene ontology (GO) analysis by the g: profiler web server.Citation25 The GO study displayed that the upregulated DEGs are significantly enrich in various biological processes, including the G1/S transition of the mitotic cell cycle, regulation of molecular function, and regulation of protein metabolic process. Molecular functions such as Kinase regulatory activity, enzyme binding, phasphotase binding, and transferase activity were also highly enriched. Additionally, changes in cellular components were observed in the serine/threonine protein kinase complex, organelle envelope, nuclear membrane, and cytosol (). Furthermore, KEGG pathwayCitation25 enrichment test revealed the upregulated DEGs in CRC were significantly associated with several pathways including the cell cycle, viral carcinogenesis, pathways in cancer, cellular senescence, p53 signaling pathway. Reactome pathwayCitation26 analysis also highlighted enrichment in G1 phase, cell cycle, Drug-mediated inhibition of CDK/CDK6 activity (). These results indicate the potential molecular mechanisms involved in CRC tumorigenesis, suggesting that targeting these potent DEGs could provide a more in-depth awareness of the illness.
Figure 4. Gene ontology (GO) and pathway enrichment of CRC DEGs. Gene ontologies, biological processes (BP), molecular functions (MF), and cellular components (CC) of up-regulated DEGs. Kyoto encyclopaedia of genes and genome (KEGG) and reactome pathways shows the enriched pathways of up-regulated genes.
Expression validation and survival analysis of hub genes in CRC
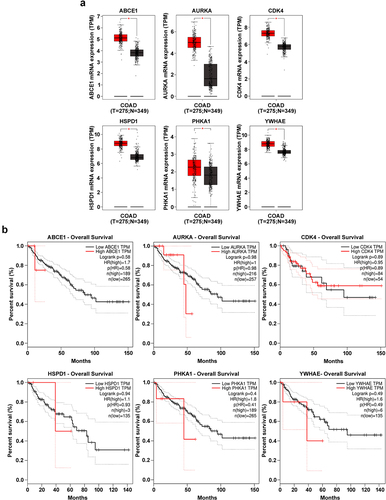
To validate the previous findings and selected potential hub genes for colorectal cancer, survival analysis was performed using various tools such as KM plotter, GEPIA,Citation27 and UALCAN.Citation16 Based on hazard ratios, p-values, and survival percentages, six genes were identified as statistically significant (p < .05) in colorectal cancer patient samples (Supplementary Table S2). Elevated expression levels of ABCE1, AURKA, HSPD1, PHKA1, CDK4, and YWHAE were linked to poor survival in colorectal cancer patients (). Additionally, GEPIA assessment established that the expression levels of six hub genes (ABCE1, AURKA, HSPD1, PHKA1, CDK4, and YWHAE) were significantly upregulated in tumor samples (). These findings provide further validation that the elevated expression levels of hub genes and the survival rate obtained from patient samples analyzed by the GEPIA database serve as significant prognostic markers in colorectal cancer tumorigenesis.
Figure 5. mRNA expression and overall survival rates of hub genes in colon adenocarcinoma (COAD) utilized from GEPIA database. (a) The mRNA expression levels and overall survival rates of hub genes, including ABCE1, AURKA, HSPD1, PHKA1, CDK4, and YWHAE, were analyzed in patients with colon adenocarcinoma (COAD) using data obtained from the cancer genome atlas (TCGA) through the GEPIA database. The expression levels of these hub genes were compared between COAD patient samples (in orange) and normal samples (in blue). The statistical significance of the differences was determined using a student’s t-test. The results showed that the expression levels of these hub genes were significantly higher in COAD patients compared to normal samples (*p < .001). (b) Survival plots for ABCE1, AURKA, HSPD1, PHKA1, CDK4, and YWHAE were generated to assess the association between the expression levels of hub genes and overall survival in COAD patients. The survival plots displayed two groups: one with high expression levels (indicated by the orange line) and the other with low expression levels (indicated by the blue line) of the hub genes. The horizontal line represents the time in months, while the vertical line represents the percentage of survival rate. The Kaplan-Meier method was used to estimate the survival probabilities, and the log-rank test was employed to evaluate the statistical significance.
Analysis of prognostic values for hub genes
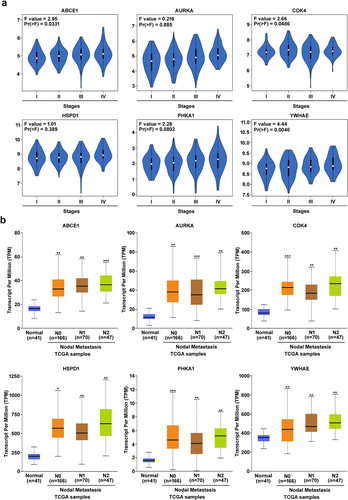
To comprehend the role of oncogenic genes in cancer promotion, it is crucial to evaluate their prognostic characteristics concerning cancer progression. To validate the prognostic relevance of hub genes in colorectal cancer (CRC), we utilized the GEPIA database, focusing on key genes like ABCE1, AURKA, HSPD1, PHKA1, CDK4, and YWHAE, as shown in . The examination of mRNA expression across different stages in CRC datasets revealed significantly higher expression levels in advanced stages for these hub genes. Moreover, we assessed the nodal metastasis status using the UALCAN database, which consistently indicated an enhancement in the metastatic potential of all hub genes, as illustrated in . These findings collectively suggest that hub genes exhibit oncogenic characteristics and are implicated in CRC tumorigenesis.
Figure 6. Prognostic characteristics of hub genes from COAD datasets. (a) mRNA expression for different stages (I-IV) for ABCE1, AURKA, HSPD1, PHKA1, CDK4, and YWHAE were retrieved from GEPIA database. (b) The nodal metastatic status (N0-N3) for ABCE1, AURKA, HSPD1, PHKA1, CDK4, and YWHAE hub genes were obtained from UALCAN database compared with normal CRC patient samples. Compared to normal group was deemed to be statistically significant at a significance level of p < .001.
Identification of mutation in hub genes
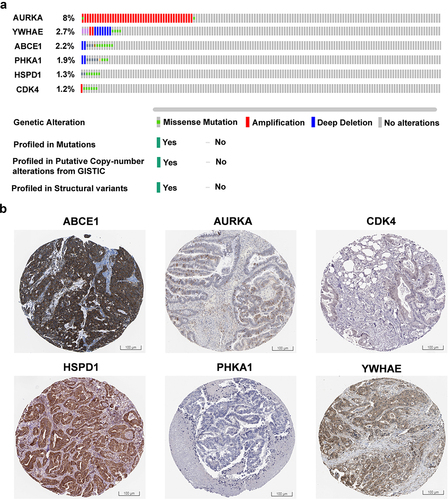
To explore the genetic alterations of the hub genes in colorectal cancer, we utilized the cBioPortal database.Citation16 The expression levels and mutation status of ABCE1, AURKA, HSPD1, PHKA1, CDK4, and YWHAE hub genes were examined in 20 colorectal cancer studies, encompassing a total of 4,128 samples. illustrates the genetic mutation frequencies and types of these hub genes in colorectal cancer samples. The analysis revealed the presence of mutations in approximately 2.5% of the 20 cases examined. The mutation plots of ABCE1, AURKA, HSPD1, PHKA1, CDK4, and YWHAE hub genes in colorectal cancer indicate a mutation rate of more than 1.0% in patient samples derived from The Cancer Genome Atlas (TCGA) datasets. Additionally, the expression levels of the six hub genes (ABCE1, AURKA, HSPD1, PHKA1, CDK4, and YWHAE) in colorectal cancer were validated using immunostaining data obtained from the Human Protein Atlas (HPA) database,Citation18 as shown in . The immunostaining results support the findings that ABCE1, AURKA, HSPD1, PHKA1, CDK4, and YWHAE are significantly upregulated in colorectal cancer tissues. These findings added to the growing body of evidence showing that these hub genes experience genetic changes in colorectal cancer and are related to the clinical condition of patient samples, suggesting their possible involvement in the inception and progression of colorectal carcinogenesis.
Figure 7. Alteration and validation of hub genes (a) gene mutation frequencies of hub genes ABCE1, AURKA, HSPD1, PHKA1, CDK4, and YWHAE in colon adenocarcinoma (COAD) of TCGA datasets retrieved from cBioportal database. The red bar represents gene amplifications, blue bar indicates deep deletion, green bar represents missense mutations, and gray bar represents truncating mutations. (b) ABCE1, AURKA, HSPD1, PHKA1, CDK4, and YWHAE shows immunohistochemistry of tumor tissues from the human protein atlas database.
Gene expression by RT-PCR in HT-29 cells
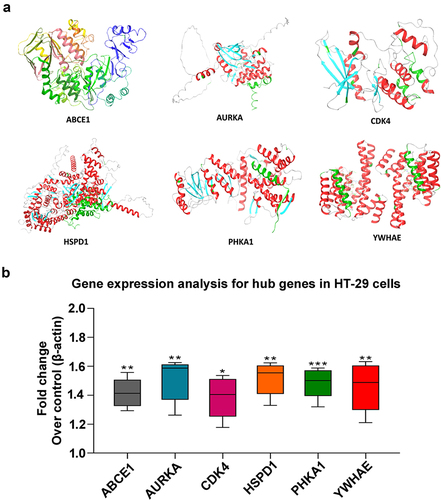
The global representation of x-ray crystallography protein structures of hub genes (ABCE1, AURKA, CDK4, HSPD1, PHKA1, and YWHAE) were retrieved from Protein Data Bank (PDB) and illustrated as shown in . Functional experiments play a pivotal role in reinforcing the impact of bioinformatic analyses aimed at identifying hub genes in cancer.Citation34 To validate our findings, we conducted gene expression experiments using RT-PCR in HT-29 colorectal cancer cells. The study focused on six hub genes: ABCE1, AURKA, CDK4, HSPD1, PHKA1, and YWHAE. As illustrated in , our experimental results revealed a substantial upregulation in the expression levels of all six hub genes in HT-29 cells when compared to the control group. These findings not only validate the accuracy of our integrated bioinformatic analysis but also underscore the significance of these six key genes as potential therapeutic biomarkers for colorectal tumorigenesis.
Figure 8. Structural representation and gene expression analysis for hub genes in HT29 cells. (a) The cartoon representation of six hub genes as 3D protein structures (ABCE1, AURKA, CDK4, HSPD1, PHKA1, and YWHAE) (b) relative expression levels of hub genes in HT-29 cells by RT-PCR. The relative expression levels of each gene were normalized to β-actin in the untreated group, which was arbitrarily set as 1. The reported values represent the mean ± SEM from three independent experiments, with the levels in the other groups determined relative to the control group. Statistical significance is denoted as follows: (*p < .05, **p < .01; ***p < .001) when compared to the control group.
Discussion
Colorectal cancer (CRC) is a prevalent malignancy affecting the large intestine, ranking as the third most common cancer globally. It accounts for a significant number of cancer-related deaths, ranking as the fourth leading cause.Citation34,Citation35 Extensive research over the past few decades have contributed to a comprehensive understanding of CRC, making it one of the most well-studied cancers. The emergence of microarray and high-throughput sequencing technologies has revolutionized gene expression analysis by allowing simultaneous testing of expression levels genes.Citation36 The integration and reanalysis of microarray data offer valuable insights, including the identification of hub genes, exploration of biological activities, and delineation of signaling pathways,Citation37 These results suggest prospective targets for therapeutic intervention and new perspectives on the diagnosis and treatment of colorectal cancer (CRC).
The GEO database’s heatmap cluster analysis of differentially expressed genes gives important insights into how these genes contribute to the development of cancer, particularly colorectal cancer. The heatmap clusters depicted in reveal distinct patterns of gene expression between normal and tumor samples, highlighting the strong association of these differentially expressed genes with cancer pathways and specifically with colorectal cancer. Furthermore, represent the results of Gene Set Enrichment Analysis (GSEA) on an RNA sequencing (RNA-seq) dataset. These findings demonstrate the upregulation of genes involved in tumor-related pathways in the tumor samples, compared to non-tumor samples. This suggests that the differentially expressed the genes uncovered in this study are critical in cancer pathways, including those specific to colorectal cancer. The identification of significant prognostic markers associated with colorectal tumorigenesis is an important objective in this study. By analyzing the differentially expressed genes and their enrichment in cancer-related pathways, aim to identify potential markers that can serve as indicators of disease prognosis.
The analysis of various colorectal cancer datasets in accordance to certain criteria, GSE20916, GSE32323, GSE49355, and GSE33113 were selected, made it possible to identify of a substantial number of differentially expressed genes (DEGs). Specifically, 3962 DEGs were identified from these datasets, respectively. The volcano plots generated using GEO2R analysis with the Limma package () demonstrated the existence of the vast majority of the DEGs were upregulated in colorectal cancer samples, indicating their potential involvement in the disease. To identify common DEGs across the four datasets, an intersection investigation was carried out employing FunRich_V3 software, and the expression patterns of the common upregulated and downregulated DEGs were visualized in .
The Venn diagram displayed in the figure provides an overview of the overlapping DEGs among the colorectal cancer datasets. This analysis revealed 144 genes were considerably elevated, while 66 genes were significantly downregulated across the datasets, suggesting their potential relevance in colorectal cancer. Supplementary Table S1 enlists the specific upregulated and downregulated genes identified from the colorectal cancer datasets. These findings highlight a subset of genes that exhibit consistent dysregulation in colorectal cancer samples, further supporting their potential function in the disease as indicators or targets for treatment. The identification of common DEGs across the datasets strengthens the evidence for their involvement in colorectal cancer development and progression.
Furthermore, to validate the previous results, the analysis of upregulated and downregulated genes from colorectal cancer datasets led to the structure of separate protein-protein interaction (PPI) networks using the STRING database. The networks were visualized using Cytoscape software, highlighting the interactions among the differentially expressed genes. The upregulated DEG network comprised high nodes and edges, while the downregulated DEG network consisted of low nodes and edges (). These network representations provided a comprehensive view of the molecular interactions associated with colorectal cancer.
To identify significant clusters within the PPI networks, the MCODE plug-in in Cytoscape software was employed. For the upregulated DEGs, two modules were selected: Module 1 with a high MCODE score of 11.833 and Module 2 with a score of 6.00. These modules consisted of 13 nodes and 142 edges, and 6 nodes and 30 edges, respectively (). Similarly, for the downregulated DEGs, Module 1 had 11 nodes and 102 edges, while Module 2 had 7 nodes and 34 edges (). These core modules represent clusters of genes that exhibit strong interactions within the network and may play crucial roles in CRC. In order to learn more about the functional functions played by the identified core modules and genes in the development of CRC tumors, gene ontology (GO) and pathway analyses were also applied to them.
With the use of the g: profiler web server, the upregulated differentially expressed genes (DEGs) in colorectal cancer (CRC) were subjected to gene ontology (GO) analysis, which shed important light on their functional annotation. The analysis revealed significant enrichment in various biological processes, proving that these genes participate in important biological processes. Processes such as the the G1/S transition of the mitotic cell cycle, regulation of molecular function, and regulation of protein metabolic process were found to be highly enriched. These findings suggest that the upregulated DEGs may play crucial roles in regulating cellular functions and processes associated with CRC development and progression. In terms of molecular functions, the upregulated DEGs showed enrichment in important activities such as Kinase regulatory activity, enzyme binding, phosphatase binding, and transferase activity. Furthermore, the analysis of cellular components revealed changes in the subcellular localization of the upregulated DEGs. The enriched cellular components included the serine/threonine protein kinase complex, organelle envelope, nuclear membrane, and cytosol.
Pathway enrichment analysis using the KEGG and Reactome databases provided insights into the specific pathways associated with the upregulated DEGs in CRC. The identified pathways, such as the cell cycle, viral carcinogenesis, pathways in cancer, cellular senescence, p53 signaling pathway, are recognized as being crucial in the genesis and spread of cancer. The enrichment in genetic transcription pathways, gene expression, G1 phase, cell cycle, Drug-mediated inhibition of CDK/CDK6 activity further supports the involvement of these DEGs in key molecular mechanisms underlying CRC tumorigenesis (). Overall, the findings from the GO and pathway enrichment analyses shed light on the functional roles and potential molecular mechanisms of the upregulated DEGs in CRC. Understanding the biological processes, molecular functions, and pathways linked together these genes provides valuable insights into the dysregulated cellular processes and signaling pathways in CRC.
The validation of previous findings and the spotting of possible hub genes for colorectal cancer (CRC) were accomplished through survival analysis using multiple tools, including, KMplotter, GEPIA, and UALCAN. This comprehensive analysis enabled the identification of six genes that exhibited statistically significant associations with CRC patient survival. The elevated expression levels of ABCE1, AURKA, HSPD1, PHKA1, CDK4, and YWHAE, were turned out to be linked to poor survival outcomes in CRC patients (). These findings suggest that these genes Could be valuable roles in CRC tumorigenesis and progression. The significance of these genes as prognostic markers in CRC is supported by their hazard ratios, p-values, and survival percentages, which indicate their potential clinical relevance. Furthermore, the study of tumor sample gene expression utilizing the GEPIA database confirmed the dysregulation of these hub genes in CRC. Specifically, ABCE1, AURKA, HSPD1, PHKA1, CDK4, and YWHAE showed significant upregulation in tumor samples. This concordance between survival analysis and gene expression data strengthens the evidence suggesting these hub genes are involved in CRC and their potential as prognostic markers (). The identification of hub genes and their relationship to patient survival in CRC sheds important light on the molecular processes underlying the onset and progression of CRC. Further investigations are warranted to elucidate the determined roles of these hub genes in CRC pathogenesis and to explore their potential as therapeutic targets for effective interventions in CRC.
Furthermore, we are interested to find out the prognostic characteristics of hub genes in colorectal tumorigenesis. In order to find out, GEPIA database revealed the high expression level in advanced stages compared to early stages in hub genes. Moreover, the nodal metastasis status from UALCAN database also gives significant result that shown increased in the nodal metastasis sites for the CRC associated hub genes (). The utilization of the cBioPortal database allowed us to delve into the genetic amendment of the hub genes in colorectal cancer (CRC). By examining the expression levels and mutation status of ABCE1, AURKA, HSPD1, PHKA1, CDK4, and YWHAE across 20 CRC studies encompassing 4,128 samples, we gained valuable insights. visualizes the genetic mutation frequencies and types observed in these hub genes in CRC samples. Notably, our analysis revealed the presence of mutations in approximately 2.5% of the cases examined.
The mutation plots for ABCE1, AURKA, HSPD1, PHKA1, CDK4, and YWHAE in CRC highlight a mutation rate exceeding 2.5% in patient samples derived from The Cancer Genome Atlas (TCGA) datasets. To Additional evidence supporting the expression levels of the six hub genes (ABCE1, AURKA, HSPD1, PHKA1, CDK4, and YWHAE) in CRC, we turned to immunostaining results obtained from the Human Protein Atlas (HPA) database, as depicted in . These immunostaining results corroborate our earlier findings, demonstrating that ABCE1, AURKA, HSPD1, PHKA1, CDK4, and YWHAE are significantly upregulated in colorectal cancer tissues. These findings provide further compelling evidence that these hub genes undergo genetic alterations in CRC and are associated with the clinical status of patient samples, underscoring their probable responsibilities in the growth and development of colorectal tumorigenesis. Moreover, the expression status of these six hub genes also proved that the significantly upregulated in HT-29, colorectal cancer cells (). Collectively, these comprehensive analyses of genetic alterations, including mutations and expression levels, contribute to a deeper grasp of the involvement of these hub genes in CRC. The identification of genetic mutations and dysregulated expression patterns sheds light on their significance as drivers and potential biomarkers in CRC.
Conclusion
The integrated bioinformatics analysis identified ABCE1, AURKA, HSPD1, PHKA1, CDK4, and YWHAE as potential hub genes associated with colorectal cancer (CRC). These hub genes were exhibited significant dysregulation and genetic alterations in CRC patient samples. And also, their expression levels were correlated with patient survival, highlighting their potential as diagnostic and prognostic markers. Functional analysis revealed their involvement in key pathways and biological processes implicated in CRC tumorigenesis. Moreover, the prognostic characteristics of potential hub genes have also validated as an oncogenic role in colorectal cancer progression. These findings provide a footing for further experimental investigations and suggest that targeting these hub genes could lead to improved personalized therapies and patient outcomes in CRC.
CRediT authorship contribution statement
Conceptualization, S.J., S.R.N and M.K.G.; Formal Analysis, C.P.P and P.R.; Investigation, S.R.N. V.P.V and S.J.; Data Curation, S.J and P.R; Writing – Original Draft Preparation, S.R.N. and S.J; Writing – Review and Editing, M.K.G., R.K and T.S.A; Visualization, V.P.V., Supervision, S.J. All authors have read and agreed to the published version of the manuscript.
Supplementary files.docx
Download MS Word (14 KB)Acknowledgement
The work was supported by the Researchers Supporting Project number [RSP2024R393], King Saud University, Riyadh, Saudi Arabia.
Disclosure statement
No potential conflict of interest was reported by the author(s).
Supplementary material
Supplemental data for this article can be accessed online at https://doi.org/10.1080/23723556.2024.2326699
References
- Favoriti P, Carbone G, Greco M, Pirozzi F, Pirozzi RE, Corcione F. Worldwide burden of colorectal cancer: a review. Updates Surg. 2016 Mar;68(1):7–14. doi:10.1007/s13304-016-0359-y.
- Rahib L, Smith BD, Aizenberg R, Rosenzweig AB, Fleshman JM, Matrisian LM. Projecting cancer incidence and deaths to 2030: the unexpected burden of thyroid, liver, and pancreas cancers in the United States. Cancer Res. 2014 Jun 1;74(11):2913–21. doi:10.1158/0008-5472.CAN-14-0155.
- Hull R, Francies FZ, Oyomno M, Dlamini Z. Colorectal cancer genetics, incidence and risk factors: In search for targeted therapies. Cancer Manag Res. 2020 Oct 9;12:9869–9882. doi: 10.2147/CMAR.S251223.
- Mohandas KM. Colorectal cancer in India: controversies, enigmas and primary prevention. Indian J Gastroenterol. 2011 Feb;30(1):3–6. doi:10.1007/s12664-010-0076-2.
- Patil PS, Saklani A, Gambhire P, Mehta S, Engineer R, De’souza A, Chopra S, Bal M. Colorectal cancer in India: an audit from a tertiary center in a low prevalence area. Indian J Surg Oncol. 2017 Dec;8(4):484–490. doi:10.1007/s13193-017-0655-0.
- Rawla P, Sunkara T, Barsouk A. Epidemiology of colorectal cancer: incidence, mortality, survival, and risk factors. Prz Gastroenterol. 2019;14(2):89–103. doi:10.5114/pg.2018.81072.
- Tanaka T. Colorectal carcinogenesis: Review of human and experimental animal studies. J Carcinog. 2009;8(1):5. doi:10.4103/1477-3163.49014.
- Fearon ER. Molecular genetics of colorectal cancer. Annu Rev Pathol. 2011;6:479–507. doi:10.1146/annurev-pathol-011110-130235.
- Mundade R, Imperiale TF, Prabhu L, Loehrer PJ, Lu T. Genetic pathways, prevention, and treatment of sporadic colorectal cancer. Oncoscience. 2014 Jun 30;1(6):400–6. doi:10.18632/oncoscience.59.
- Coppedè F, Lopomo A, Spisni R, Migliore L. Genetic and epigenetic biomarkers for diagnosis, prognosis and treatment of colorectal cancer. World J Gastroenterol. 2014 Jan 28;20(4):943–956. doi:10.3748/wjg.v20.i4.943.
- Mudassar S, Khan MS, Khan NP, Andrabi KI. Possible role of proto-oncogenes in colorectal cancer—A population based study. Colorectal cancer-surgery, diagnostic and treatment. 2014.
- Nakayama M, Oshima M. Mutant p53 in colon cancer. J Mol Cell Biol. 2019 Apr 1;11(4):267–276. doi:10.1093/jmcb/mjy075.
- Banks RE, Dunn MJ, Hochstrasser DF, Sanchez JC, Blackstock W, Pappin DJ, Selby PJ. Proteomics: new perspectives, new biomedical opportunities. Lancet. 2000 Nov 18;356(9243):1749–56. doi:10.1016/S0140-6736(00)03214-1.
- Clough E, Barrett T. The gene expression omnibus database. Methods Mol Biol. 2016;1418:93–110. doi:10.1007/978-1-4939-3578-9_5.
- Tomczak K, Czerwińska P, Wiznerowicz M. The cancer genome atlas (TCGA): an immeasurable source of knowledge. Contemp Oncol (Pozn). 2015;19(1A):A68–77. doi:10.5114/wo.2014.47136.
- Chandrashekar DS, Bashel B, Balasubramanya SAH, Creighton CJ, Ponce-Rodriguez I, Chakravarthi BVSK, Varambally S. UALCAN: a portal for facilitating tumor subgroup gene expression and survival analyses. Neoplasia. 2017 Aug;19(8): 19. 8. 649–658. 10.1016/j.neo.2017.05.002. Epub 2017 Jul 18.
- Guan L, Tang Y, Li G, Qin Z, Li S. Comprehensive analysis of role of cyclin-dependent kinases family members in colorectal cancer. Front Oncol. 2022 Jun 22;12:921710. doi:10.3389/fonc.2022.921710.
- Uhlen M, Oksvold P, Fagerberg L, Lundberg E, Jonasson K, Forsberg M, Zwahlen M, Kampf C, Wester K, Hober S. et al. Towards a knowledge-based human protein atlas. Nat Biotechnol. 2010 Dec;28(12):1248–50. doi:10.1038/nbt1210-1248.
- von Mering C, Huynen M, Jaeggi D, Schmidt S, Bork P, Snel B. STRING: a database of predicted functional associations between proteins. Nucleic Acids Res. 2003 Jan 1;31(1):258–261. doi:10.1093/nar/gkg034.
- Kohl M, Wiese S, Warscheid B. Cytoscape: software for visualization and analysis of biological networks. Methods Mol Biol. 2011;696:291–303. doi:10.1007/978-1-60761-987-1_18.
- Pathan M, Keerthikumar S, Ang CS, Gangoda L, Quek CY, Williamson NA, Mouradov D, Sieber OM, Simpson RJ, Salim A. et al. FunRich: an open access standalone functional enrichment and interaction network analysis tool. Proteomics. 2015 Aug;15(15):2597–2601. doi:10.1002/pmic.201400515.
- Díez-Villanueva A, Mallona I, Peinado MA. Wanderer, an interactive viewer to explore DNA methylation and gene expression data in human cancer. Epigenetics & Chromatin. 2015 Jun 23;8(1):22. 10.1186/s13072-015-0014-8. PMID: 26113876; PMCID: PMC4480445.
- Bastian M, Heymann S, Jacomy M. Gephi: an open source software for exploring and manipulating networks. Proc Int AAAI Conf Web Social Media. 2009 March;3(1):361–362. doi:10.1609/icwsm.v3i1.13937.
- Reimand J, Kull M, Peterson H, Hansen J, Vilo J. G: profiler–a web-based toolset for functional profiling of gene lists from large-scale experiments. Nucleic Acids Res. 2007 Jul;35(Web Server issue):W193–200. doi:10.1093/nar/gkm226.
- Ogata H, Goto S, Fujibuchi W, Kanehisa M. Computation with the KEGG pathway database. Biosystems. 1998 Jun-Jul;47(1–2):119–28. doi:10.1016/s0303-2647(98)00017-3.
- Fabregat A, Jupe S, Matthews L, Sidiropoulos K, Gillespie M, Garapati P, Haw R, Jassal B, Korninger F, May B. et al. The reactome pathway knowledgebase. Nucleic Acids Res. 2018 Jan 4;46(D1):D649–D655. doi:10.1093/nar/gkx1132.
- Tang Z, Li C, Kang B, Gao G, Li C, Zhang Z. GEPIA: a web server for cancer and normal gene expression profiling and interactive analyses. Nucleic Acids Res. 2017 Jul 3;45(W1):W98–W102. doi:10.1093/nar/gkx247.
- Porichi O, Nikolaidou ME, Apostolaki A, Tserkezoglou A, Arnogiannaki N, Kassanos D, Margaritis L, Panotopoulou E. BCL-2, BAX and P53 expression profiles in endometrial carcinoma as studied by real-time PCR and immunohistochemistry. Anticancer Res. 2009 Oct;29(10):3977–3982.
- Subramanian A, Tamayo P, Mootha VK, Mukherjee S, Ebert BL, Gillette MA, Paulovich A, Pomeroy SL, Golub TR, Lander ES. et al. Gene set enrichment analysis: a knowledge-based approach for interpreting genome-wide expression profiles. Proc Natl Acad Sci U S A. 2005 Oct 25;102(43):15545–50. doi:10.1073/pnas.0506580102.
- Skrzypczak M, Goryca K, Rubel T, Paziewska A, Mikula M, Jarosz D, Pachlewski J, Oledzki J, Ostrowski J, Khanin R. Modeling oncogenic signaling in colon tumors by multidirectional analyses of microarray data directed for maximization of analytical reliability. PloS One. 2010 Oct 1;5(10):e13091. doi:10.1371/journal.pone.0013091.
- Khamas A, Ishikawa T, Shimokawa K, Mogushi K, Iida S, Ishiguro M, Mizushima H, Tanaka H, Uetake H, Sugihara K. Screening for epigenetically masked genes in colorectal cancer using 5-aza-2’-deoxycytidine, microarray and gene expression profile. Cancer Genomics Proteomics. 2012 Mar-Apr;9(2):67–75.
- Del Rio M, Mollevi C, Vezzio-Vie N, Bibeau F, Ychou M, Martineau P, Guan X-Y. Specific extracellular matrix remodeling signature of colon hepatic metastases. PLoS One. 2013 Sep 4;8(9):e74599. 10.1371/journal.pone.0074599. PMID: 24023955; PMCID: PMC3762755.
- Kemper K, Versloot M, Cameron K, Colak S, de Sousa e Melo F, de Jong JH, Bleackley J, Vermeulen L, Versteeg R, Koster J. et al. Mutations in the Ras-Raf Axis underlie the prognostic value of CD133 in colorectal cancer. Clin Cancer Res. 2012 Jun 1;18(11):3132–3141. doi:10.1158/1078-0432.CCR-11-3066.
- Wan Y, Zhang X, Leng H, Yin W, Zeng W, Zhang C. Identifying hub genes of papillary thyroid carcinoma in the TCGA and GEO database using bioinformatics analysis. PeerJ. 2020 Jul 9;8:e9120. doi:10.7717/peerj.9120.
- Sawicki T, Ruszkowska M, Danielewicz A, Niedźwiedzka E, Arłukowicz T, Przybyłowicz KE. A review of colorectal cancer in terms of epidemiology, risk factors, development, symptoms and diagnosis. Cancers Basel. 2021 Apr 22;13(9):2025. doi:10.3390/cancers13092025.
- Ansorge WJ. Next-generation DNA sequencing techniques. N Biotechnol. 2009 Apr;25(4):195–203. doi:10.1016/j.nbt.2008.12.009.
- Sharma A, Yadav D, Rao P, Sinha S, Goswami D, Rawal RM, Shrivastava N. Identification of potential therapeutic targets associated with diagnosis and prognosis of colorectal cancer patients based on integrated bioinformatics analysis. Comput Biol Med. 2022 Jul;146:105688. doi:10.1016/j.compbiomed.2022.105688.
- Miralaei N, Majd A, Ghaedi K, Peymani M, Safaei M. Integrated pan-cancer of AURKA expression and drug sensitivity analysis reveals increased expression of AURKA is responsible for drug resistance. Cancer Med. 2021 Sep;10(18):6428–6441. doi:10.1002/cam4.4161.
- Tian Y, Tian X, Han X, Chen Y, Song CY, Jiang WJ, Tian DL. ABCE1 plays an essential role in lung cancer progression and metastasis. Tumour Biol. 2016 Jun;37(6):8375–82. doi:10.1007/s13277-015-4713-3.
- Kim SK, Kim K, Ryu JW, Ryu TY, Lim JH, Oh JH, Min JK, Jung CR, Hamamoto R, Son MY. et al. The novel prognostic marker, EHMT2, is involved in cell proliferation via HSPD1 regulation in breast cancer. Int J Oncol. 2019 Jan;54(1):65–76. doi:10.3892/ijo.2018.4608.
- Jiang Y, Chen F, Ren X, Yang Y, Luo J, Yuan J, Yuan J, Tong Q. RNA-Binding protein COL14A1, TNS1, NUSAP1 and YWHAE are valid biomarkers to predict peritoneal metastasis in gastric cancer. Front Oncol. 2022 Apr 19;12:830688. doi:10.3389/fonc.2022.830688.
- Li D, Pan Z, Zhang K, Yu M, Yu D, Lu Y, Wang J, Zhang J, Zhang K, Du W. Identification of the differentially expressed genes of muscle growth and intramuscular fat metabolism in the development stage of yellow broilers. Genes. 2020 Feb 26;11(3):244. doi:10.3390/genes11030244.
- Zhao P, Hu YC, Talbot IC. Expressing patterns of p16 and CDK4 correlated to prognosis in colorectal carcinoma. World J Gastroenterol. 2003 Oct;9(10):2202–2206. doi:10.3748/wjg.v9.i10.2202.