
ABSTRACT
In this paper, we estimate the vulnerability of railway infrastructure, switches, signals, tracks, and catenaries to different weather conditions, temperature, precipitation, snow depth, and wind speed across the entire Swedish railway network between 2006-2020. Using a method to quantify the fault rate we establish thresholds that can be useful for identifying areas of concern for operations. Results reveal that high or low temperatures have a noticeable impact on the fault rates for switches, tracks, and catenaries. High levels of precipitation are associated with higher fault rates across tracks and catenaries. Snow depth has an influence on fault rates for switches and tracks, and high wind speeds are associated with higher fault rates for tracks and catenaries. Finally, signals were found to be the most resilient asset. When comparing two dominant climate zones, notable differences were only found for track asset vulnerability.
1. Introduction
Critical infrastructures, such as railway transportation, are important for providing essential goods and services to society. Disruption can lead to significant adverse social and economic impacts (Greenham, Ferranti, Quinn, et al., Citation2020). Therefore, it is important to ensure a resilient railway network, one that is able to recover quickly from disruption back to its original state (Lu, Xu, Cui, et al., Citation2022). Compared to other transport infrastructure, railways are more vulnerable to disruptions due to limited rerouting options and capacity constraints (Mattsson & Jenelius, Citation2015). The uncertainty of future climate change and the consequent increases in severity and frequency of extreme weather events poses an additional challenge (Garmabaki, Odelius, Thaduri, et al., Citation2022; Wang, Qu, Yang, et al., Citation2020) and railways will need to adapt to the negative effects of climate change. Although the impacts of climate change will negatively affect the operation of railways, they play an important role in mitigating climate change by providing a low-carbon mode of transportation (Baker, Chapman, Quinn, et al., Citation2010). In order to further leverage these benefits, it is vital to ensure railways are a reliable mode of transportation and resilient to extreme weather and climate change.
There are two ways in which weather can lead to disruptions to transport networks: behavioural change in a driver or operator due to the stress of weather conditions, and infrastructure faults caused by weather (Jaroszweski, Hooper, & Chapman, Citation2014). A diverse range of weather-related faults have been explored in the literature, from heat (Ferranti, Chapman, Lee, et al., Citation2018), to snow (Stenström, Famurewa, Parida, et al., Citation2012) through to flooding (Liu, Wang, & Zhou, Citation2021) and windstorms (Fu & Easton, Citation2018). The literature has also explored the impacts of weather on different types of railway infrastructure such as buckling (Dobney, Baker, Chapman, et al., Citation2009, Citation2010), treefall (Fu & Easton, Citation2018) or bridge scour (Pregnolato, Giordano, Prendergast, et al., Citation2023).
Many studies that have quantified the impact of weather on railways have focused on the effect on operations such as train delays and network disruption (Brazil, White, Nogal, et al., Citation2017; Chen & Wang, Citation2019; Fabella & Szymczak, Citation2021; Ferranti, Chapman, Lee, et al., Citation2018; Greenham, Ferranti, Quinn, et al., Citation2020; Jaroszweski, Hooper, Baker, et al., Citation2015; Ludvigsen & Klæboe, Citation2014; Ochsner & Palmqvist, Citation2022; Palmqvist, Olsson, Winslott, et al., Citation2017; Xia, Van Ommeren, Rietveld, et al., Citation2013; Zakeri & Olsson, Citation2018). Typically, these studies focus on specific regions and short-term impacts (Wang, Qu, Yang, et al., Citation2020) as well as specific combinations of weather variables and railway asset types, such as heat and track (Dobney, Baker, Chapman, et al., Citation2009, Citation2010). There are fewer studies that investigate a range of weather variables or a range of asset fault types, and even fewer that take a more holistic approach (Fisher, Citation2021).
1.1. Aim and research questions
To address these gaps, the aim of this study is to quantify the vulnerability of railway infrastructure to different types of weather in a Swedish context. Additionally, we use the Köppen-Geiger climate zones Beck, Zimmermann, McVicar, et al. (Citation2018) to analyse the relationship based on different climate zones in Sweden. The main three research questions asked in this research are:
How vulnerable are some common railway assets to a range of weather variables?
At what thresholds are the weather variables associated with increased fault rates for key railway assets?
Are these vulnerabilities and thresholds the same or different across the two dominant climate zones in Sweden?
The rest of the paper is organised as follows: Section 2 reviews relevant literature. Section 3 introduces the data and Section 4 presents the method. Section 5 presents and discusses the results of the fault rate analysis, while Section 6 presents and discusses the results of the fault rate analysis between climate zones. Section 7 discusses the approach, limitations, and future research, while Section 8 concludes.
2. Literature review
As high temperatures and flooding are key risks to railway assets around the world these dominate the academic research in this area (Palin, Stipanovic Oslakovic, Gavin, et al., Citation2021). However, other risks, such as low temperatures (Stenström, Famurewa, Parida, et al., Citation2012), snow and ice (Stenström, Famurewa, Parida, et al., Citation2012), lightning strikes (Maduranga, Edirisinghe, Alahacoon, et al., Citation2022) and wind and storms have also been quantified (Fu & Easton, Citation2018; Szymczak, Bott, Babeck, et al., Citation2022). Much of the research is asset specific, with weather impacts to track (Dobney, Baker, Chapman, et al., Citation2009, Citation2010) and embankment assets (Powrie & Smethurst, Citation2019) identified as priorities for industry and research. However, research also considers impacts on switches and crossings (or turnouts) (Garmabaki, Odelius, Thaduri, et al., Citation2022), and interdependencies between railways and power systems (Johansson, Hassel, & Cedergren, Citation2011). This review of literature explores different approaches to quantifying weather impacts, key weather hazards considered, main assets assessed, and how this analysis can be used to inform risk management strategies.
2.1. Weather impacts on railway operations
Many empirical studies have investigated the relationship between adverse weather conditions and train delays in regions around the world. Leaves, temperature, wind gusts, precipitation, and snow have strong effects on passenger train punctuality and cancellations in the Netherlands (Xia, Van Ommeren, Rietveld, et al., Citation2013). On the London Underground network, there is a strong relationship between heat and delays, which is expected to increase under climate change projections (Greenham, Ferranti, Quinn, et al., Citation2020). In Germany, railway operations are most vulnerable to flood events followed by mass movements, and tree-fall events (Fabella & Szymczak, Citation2021). On high-speed rail services in China, the southeast coastal region was found to be more vulnerable to thunderstorms and heavy rainfall while in the central-eastern and northern regions of China, snowstorms were reported to have the main impact on high-speed rail services (Chen & Wang, Citation2019). In Dublin, Ireland rainfall was found to have the greatest impact on train delays, especially when linked with high wind speeds (Brazil, White, Nogal, et al., Citation2017). While many studies focus on passenger trains, research has also been done on freight services (Ludvigsen & Klæboe, Citation2014; Woodburn, Citation2019).
The impact of extreme weather events such as the hot summer in 2003 has been the subject of some studies. In Great Britain heat-related delays cost £9.2 million and due to climate change, this cost is expected to increase (Dobney, Baker, Chapman, et al., Citation2010; Dobney, Baker, Quinn, et al., Citation2009). Similarly, in 2015, heat-related delays caused 220,000 delay-minutes due to incidents such as track buckling and emergency speed restrictions (Ferranti, Chapman, Lee, et al., Citation2018). In addition, storms that hit Great Britain on 28 June 2012 led to 10,000 delay minutes between England and Scotland (Jaroszweski, Hooper, Baker, et al., Citation2015).
Current literature focused on Nordic countries typically explores the impacts of snow and low temperatures. In Norway, extreme low temperatures and snow were the main contributing factors of low punctuality to passenger services (Zakeri & Olsson, Citation2018). In 2010 long periods of low temperatures along with heavy snowfall and strong winds had the greatest impacts on freight punctuality in Sweden, Norway, Finland, Poland, and Switzerland (Ludvigsen & Klæboe, Citation2014). In a Swedish context, low temperatures and high snow depths are the main contributing factors of cancellations and large delays (Ochsner & Palmqvist, Citation2022). Similarly, when temperatures fall below 0°C or reach temperatures above 23°C, punctuality decreases exponentially. Punctuality drops by almost 2% points when a quarter of all the trains analysed were exposed to at least 30 mm of precipitation and drops by 20% when wind speeds reach 10 m/s (Palmqvist, Olsson, Winslott, et al., Citation2017).
2.2. Weather and climate change impacts on railway infrastructure
Other literature has focused on the impact of weather on the physical railway infrastructure assets rather than the effect on train services. Analysis of heat-related infrastructure failures in the Southeast of England has concluded that the majority of heat-related failures occur during early/midsummer then and reduced significantly, despite extremely high temperatures due to a process known as failure harvesting (Ferranti, Chapman, Lowe, et al., Citation2016). Wind-related infrastructure failures can result in windblown objects such as trees blocking tracks or damaging catenaries (Palin et al., Citation2021), and predicting the risk of wind-related infrastructure failures has been explored (Fu & Easton, Citation2018; Szymczak, Bott, Babeck, et al., Citation2022).
Other literature expands the analysis of historic incidents to increase understanding of future impacts. Liu, Wang, and Zhou (Citation2021) used a machine learning approach to analyse the relationship between precipitation change and railway vulnerability to disasters such as floods, landslides, and other debris flows now and under various climate change projections in China. Concluding that due to climate change, the vulnerability of railways to precipitation-related disasters is expected to increase.
In Sweden, research has quantified the risks of weather on railway infrastructure and how climate change might impact maintenance. Sub-zero temperatures are currently a significant risk to switches which have the highest failure occurrence (Ochsner, Ivina, & Palmqvist, Citation2023) and have been shown to be increasingly vulnerable over the last 20 years (Garmabaki, Odelius, Thaduri, et al., Citation2022). Switches are the most probable asset to fail during winter when work orders double or triple (Stenström, Famurewa, Parida, et al., Citation2012). Due to climate change Sweden is expected to see an increase in railway maintenance and disturbance costs (Thaduri, Garmabaki, & Kumar, Citation2021) and the level of adaptation needs to be increased (Garmabaki, Thaduri, Famurewa, et al., Citation2021; Lindgren, Jonsson, & Carlsson-Kanyama, Citation2009). Similar results are discussed by Dépoues (Citation2017).
In Europe, the current annual damage of flood events on railways is roughly €581 million, and due to climate change, it is expected that the annual cost of flood impacts in Europe will increase by 310% (Bubeck, Dillenardt, Alfieri, et al., Citation2019). Palin, Thornton, Mathison, et al. (Citation2013) quantified temperature-related climate change impacts on the railway network of Great Britain. There will also be a greater risk due to increased temperatures, leading to increased embankment slope failures (Powrie & Smethurst, Citation2019). In addition, sea level rise is a risk to coastal railway lines (Dawson, Shaw, & Roland Gehrels, Citation2016) and there will be an increasing need for adaptation Forzieri, Bianchi, Silva, et al. (Citation2018). However, studies have also found that failures related to low temperatures and snow are expected to decrease (Kellermann, Bubeck, Kundela, et al., Citation2016; Oslakovic, Ter Maat, Hartmann, et al., Citation2012).
2.3. Applications for asset management
Research that has quantified the impact of weather on railway infrastructure has informed decision-making, asset management, and extreme weather planning to provide greater resilience of railway networks. Thresholds are a key mechanism used to inform preparatory and preventative asset management ahead of extreme weather (Network Rail, Citation2021). More recently they are being applied to understand the scale of impacts under future climates.
Thresholds have been developed for different weather hazards. For instance (Oslakovic, Ter Maat, & Dewulf, Citation2013), concluded that failure occurrence is most significant on two railway lines in the Netherlands when temperatures fall below −12°C, exceed +35°C, and when daily snowfall exceeds 58 mm. Furthermore, the number of failures due to low temperatures and snow are expected to decrease while the number of failures related to heat may double.
By considering the frequency of exposure of railway assets to different weather hazards Fisher (Citation2021) quantified weather-related rates of faults in Great Britain. The analysis found that the fault rate relationship between track and maximum daily temperature becomes significant once the air temperature reaches 30°C. Greenham (Citation2023) has extended this fault rate analysis to inform predictions of future frequencies of fault events on the London Underground. By establishing future estimated days per year with different maximum temperatures, they were able to determine an estimated future frequency of faults for different emissions scenarios. This is a significant step to establishing the future risk of asset failures under future climates.
3. Overview of data
We utilise infrastructure fault data, weather data, and Köppen-Geiger climate zone data over the course of a 14-year period (2006–2020). Fault rates for four types of assets (switch, signal, track, and catenary) and weather variables (temperature, precipitation, snow depth, and wind speed) were calculated to quantify the vulnerability of each asset to each weather variable. An overview of the data is presented in this section, while the method is presented in Section 4.
3.1. Infrastructure fault data
The Swedish Transport Administration is the owner and infrastructure manager for majority of the railway infrastructure in Sweden. This study uses infrastructure fault data from the Swedish Transport Administration from 2006 to 2020, with a total of 945,329 reported faults. The dataset describes a number of different fault mechanisms (). We refer to a fault as any type of unexpected or abnormal infrastructure condition, not just those which lead to delays. The database consists of error reports which include information about the date when a fault was reported, location of the fault, asset type, description of the fault with a possible cause, and the date when the fault was rectified. This study focuses on switch, signal, track, and catenary asset faults, as these key assets have the greatest number of faults, with 126,369 reported faults ().
Figure 1. Distribution of faults between 2006–2020.
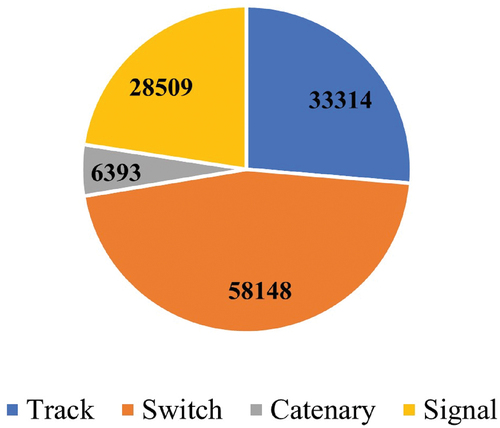
Table 1. Fault Examples.
The dataset’s primary function is to keep a record of railway infrastructure faults to ensure that the fault is understood, a solution is identified, and that the failed asset is repaired or replaced. The reporting of fault causes can be subjective and not accurately reflect the role of weather, which can create challenges when undertaking causation analysis. However, the dataset used is sufficiently large (with over 126,000 observations) to undertake a high-level analysis of the faults experienced under a variety of weather conditions to understand the correlation of faults with weather variables. The large sample size limits the influence of outliers and erroneous observations.
In this study, we focus on switch, signal, track, and catenaries assets. In the dataset of infrastructure faults, these assets are the parent asset category which can be further broken down. In the case of track assets, the parent asset category is track, while track is further composed of ballast, fastener, rails, joints, sleepers, and track. highlights the top five reasons for faults for each of the six subcategories of track, for example. The reporting of these more detailed assets becomes more subjective and prone to error and inconsistency, and for those reasons, and for brevity, we focus on the parent asset category.
Table 2. Top five reasons for faults of six different track components.
3.2. Weather data
We utilised historical open access weather data provided by the Swedish Meteorological and Hydrological Institute (SMHI). This data covers historical observations across Sweden for temperature, precipitation, snow depth, and wind speed. For the analysis, we used daily observations for average temperature, average precipitation, average snow depth, and maximum wind speed ().
Table 3. Overview of weather variables, collected between 2006 and 2020.
As weather and train stations are typically not located near one another, a sensitivity analysis comparing weather stations at 25 km, 50 km, and 75 km away from railway stations was conducted to determine a threshold distance between the two types of stations (see Appendix A). Limiting to 25 km eliminates over 70% of the fault event observations, whilst less than 20% of the fault event observations are eliminated at 50 km. Furthermore, the thresholds do not vary greatly between the three boundaries, therefore, 50 km is considered a feasible boundary.
3.3. Köppen-Geiger climate data
Sweden is a large country with varying geography; therefore, weather exposure of infrastructure varies throughout the country. To account for this, we can apply Köppen-Geiger climate zones based on Beck, Zimmermann, McVicar, et al. (Citation2018). There are four climate zones in Sweden: Cfb, Dfb, Dfc, and ET. Cfb describes a temperate climate, while Dfb a humid continental climate, Dfc a sub-arctic climate, and ET a polar, tundra climate (Beck, Zimmermann, McVicar, et al., Citation2018). highlights the number of stations in each climate zone, for simplicity, the two stations from Cfb were added to Dfb. The distribution of the railway network and weather stations in relation to the Köppen-Geiger climate zones is shown in respectively.
Figure 2. Distribution of railway stations amongst the Köppen-Geiger climate zones (adapted from Beck, Zimmermann, McVicar, et al. (Citation2018), the Swedish Transport Administration, and the University of Texas). Top right subset map to highlight climate zone Cfb.
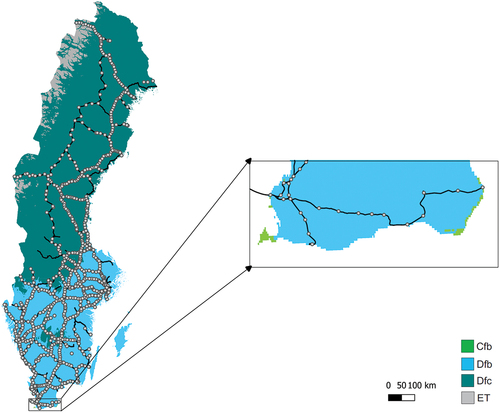
Figure 3. Distribution of weather stations amongst the Köppen-Geiger climate zones (adapted from Beck, Zimmermann, McVicar, et al. (Citation2018), the Swedish Meteorological and Hydrological Institute, and the University of Texas).
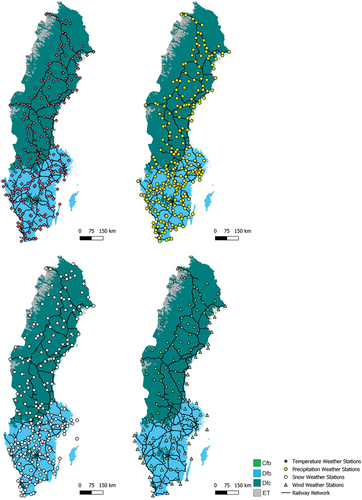
Table 4. Number of railway stations in each climate zone.
4. Method
In order to achieve the aim of this study and answer the research questions described in Section 1.1, we aggregate the data presented in Section 3 in order to conduct a fault rate analysis. This analysis entails a two-step normalisation process: first by the number of assets at each station and second, by the weather condition the station is exposed to on a particular day. The method is further described in this section.
4.1. Aggregating the infrastructure fault data to fault rates
The first step in quantifying the vulnerability of common railway assets to various conditions was to aggregate the fault data to the daily number of faults at the station level across four asset types: switches, signals, track, and catenary. To adjust for the fact that some stations are much more complex than others, we accounted for the number of switches and signal assets per station. Normalising by asset number enables the vulnerability across different stations to be compared fairly, without the influence of asset quantity. For track and catenary, we used the sum of the distance between entry and exit signals for each track at each station as a proxy for the station length and define the fault rates as the number of faults per kilometre.
We have a dataset with 3,017,128 stations and days, each with fault rates and weights for switches, signals, track, and catenary, respectively. On average, this covered 551 stations per day, or 3382 days per station. Some data points may be missing due to incomplete weather observations, fault information, or station closures during the studied period. The weights are defined as the number of switches, number of signals, and station length as a proxy for track length and catenary length at each station.
summarises the variables used for the analysis. There are fields that specify the date, the station, and its climate zone and coordinates; the number of each type of asset; the number of faults for each asset type at that station and day; the rate of assets that failed that day (no. faults divided by no. assets); weights for each type of asset (no. of each asset divided by total no. of that asset across all stations and days); weather variables representing the conditions at that station and day; then the weighted average fault rates for each asset types (using separate weights for each type of asset); the weighted standard deviation of fault rates for each asset type; and finally a set of variables that use the mean average plus one standard deviation of each rate as a fault rate threshold.
Table 5. Overview of the variables used for the analysis.
4.2. Weather-related fault rates
To investigate the link between the weather variables and fault rates, we group the data along each weather variable in turn, taking the weighted average of the fault rate for each type of asset. To ensure reasonable sample sizes, the weather variables were rounded to intervals to create discrete bins with larger numbers of observations ().
Table 6. Sample size bins for each weather variable.
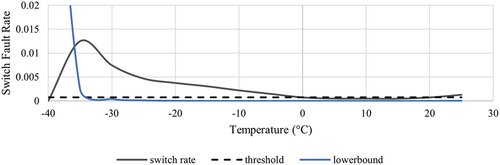
The fault rate considers the asset exposure (here the number of days a railway station is exposed to a specific type and magnitude of weather) which normalises the number of faults for each of the weather variable bins. Example values for switches are shown in . This enables greater comparison across geographies and infrastructure asset densities compared with typical methodologies which consider only the total incidence of faults regardless of relative exposure. However, for those weather conditions that occur infrequently, the low sample size can result in unreliable fault rates. Based on Fisher (Citation2021), we define a lower bound for the fault rate, which is set at one divided by the number of observations at the given weather conditions, creating a boundary for exclusion from analysis. For example, illustrates the lower bound for switches at −35°C. By eliminating the far tails of the distributions, the fault rates identified are reported with confidence. However, we recognise that this excludes high impact, low-frequency events from the analysis.
Figure 4. Example of fault rate with lower bound for switches and temperature (°C).
The number of switches and signals also varies notably across railway stations. In this paper, we are interested in the fault rate of a switch or signal across a range of weather conditions, and the rates of fault may vary across stations with differing numbers of these assets. For these reasons, we use the weighted averages when we compare fault rates. For instance, a station with 200 switches should have a higher weight than one with only two, in the estimation of the overall fault rate. For switches and signals, we thus use the weighted averages and standard deviations throughout, using the number of each asset type as weights in the respective analyses. As a reminder: for track and catenary, we used the sum of the distance between entry and exit signals for each track at each station as a proxy for the station length and define the fault rates as the number of faults per kilometre.
In order to address research question 2, presented in Section 1.1, we calculate a threshold. The threshold is weighted fault rate average plus one standard deviation, and once the fault rate crosses the threshold this is determined to be a significant rate of faults, as it deviates from the mean. The fault rate analysis was then conducted again for each of the climate zones.
5. Fault rate analysis
This section uses a fault rate analysis to answer RQ1 and RQ2 presenting the findings for each weather variable in turn. More detailed results can be found in Appendix B.
5.1. Effects of temperature
highlights the fault rates for the four infrastructure assets and daily average temperature (°C) with thresholds indicated by the dotted line. shows that switches are most vulnerable to low temperatures as the fault rate becomes significant at temperatures below 0°C and continues to increase substantially as temperature decreases. Signals () show a constant and relatively low fault rate compared with the other assets, indicating that signals are more resilient to temperature. The threshold is the highest for tracks () and here the threshold is crossed both below and above freezing temperatures, −30°C and + 5°C respectively. The fault rate increases sharply at +20°C. Lastly, catenaries () are vulnerable when temperatures are notably below freezing, with the fault rate becoming significant at temperatures below −20°C and above +5°C. However, indicates a greater vulnerability to low temperatures compared to high temperatures.
Figure 5. Fault rates for switches, signals, tracks, and catenaries and daily average temperature (°C).
These results are comparable to other studies in Sweden where switches were identified as a common asset to fail, especially during periods of temperatures below freezing (Garmabaki, Odelius, Thaduri, et al., Citation2022; Ochsner, Ivina, & Palmqvist, Citation2023; Stenström, Famurewa, Parida, et al., Citation2012). Due to climate change, the average temperature in Sweden is expected to increase, especially during the winter months (Thaduri, Garmabaki, & Kumar, Citation2021). Therefore, the number of switch and catenary faults may decrease as temperatures rise. However, there may also be a shift towards more high temperature faults, which may increase the fault rate at these temperatures without adequate extreme weather planning processes.
5.2. Effects of precipitation
In the fault rates for switches, signals, tracks, and catenaries and daily average precipitation (mm) are shown. indicate that switches and signals do not have a strong relationship with precipitation, as the fault rate lines are low and constant. Although in the threshold is crossed at 0 mm it decreases as precipitation increases, indicating a vulnerability to drought conditions. suggest that the threshold is crossed at 20 mm and 10 mm for track and catenaries respectively and increase significantly at 40 mm and 50 mm.
Figure 6. Fault rates for switches, signals, tracks, and catenary and daily average precipitation (mm).
highlights that tracks and catenaries are most vulnerable to precipitation. Due to climate change, there is an increased risk of extreme precipitation and flooding due to climate change (Thaduri, Garmabaki, & Kumar, Citation2021) which may lead to an increased risk of track and catenary assets in the future.
5.3. Effects of snow depth
The fault rates for switches, signals, tracks, and catenaries and daily average snow depth (cm) are highlighted in . Switches () are the most vulnerable to snow as the threshold is crossed at 10 cm and the fault rate continues to increase from this point, reaching a maximum at 170 cm. indicate that signals and catenary assets are the least vulnerable to snow depth as the fault rate remains relatively constant and lower compared to switch and track assets. Track faults () have the highest threshold, which is crossed at 100 cm. The fluctuations past 100 cm can be explained by the decreased number of observations of snow depths recorded past 100 cm during the studied time period.
Figure 7. Fault rates for switches, signals, tracks, and catenaries and daily average snow depth (cm).
These results are comparable to other studies in Sweden where switches were identified as vulnerable to snowfall, typically due to the blockage of moving parts (Garmabaki, Odelius, Thaduri, et al., Citation2022; Ochsner, Ivina, & Palmqvist, Citation2023; Stenström, Famurewa, Parida, et al., Citation2012). The varying geography and climate of Sweden leads to differences in snow projections for future climates, however, the duration of snow cover is expected to decrease (Thaduri, Garmabaki, & Kumar, Citation2021). This may lead to an overall decrease in snow-related faults in the future. However, this will vary across different regions and could translate to an increase in precipitation and flooding-related failures.
5.4. Effects of wind speed
The relationship between infrastructure faults and maximum wind speed (m/s) is presented in . indicate that switches and signals are not as vulnerable to wind when compared to track () and catenaries () as the fault rate remains low and mostly constant. In , the threshold is already crossed at 5 m/s and below, this is likely due to the influence of other unidentified factors. Track has the highest threshold but also the greatest increase in fault rate. The threshold is crossed at 10 m/s and the fault rate steadily increases until 35 m/s where it rapidly increases. Regarding catenaries, the fault rate remains constant until 15 m/s when the fault rate increases and crosses the threshold.
Figure 8. Fault rates for switches, signals, tracks, and catenaries and daily maximum wind speed (m/s).
These results are similar to Ochsner, Ivina, and Palmqvist (Citation2023) who determined tracks and catenaries as assets most vulnerable to tree fall, likely due to high wind speeds. Track faults are by far the most vulnerable asset to wind, followed by catenaries. The future wind climate in Sweden is difficult to predict (Thaduri, Garmabaki, & Kumar, Citation2021). If Sweden were to experience an increase in frequency and severity of wind the vulnerability of track and catenary assets may increase.
5.5. Summary of results: RQ1 and RQ2
Overall, switches are vulnerable to low temperatures and snow, this aligns with findings in existing literature. Signals were found to be the most resilient asset of those studied, while tracks are vulnerable (to varying degrees) to all weather variables. Lastly, catenaries are vulnerable to low temperatures, precipitation, and wind speed, but remain unaffected by snow depth. indicates a summary of results with the most prevalent relationships that are carried through in the analysis in Section 5.
Table 7. Summary of relationships being carried to Section 5, where ‘X’ indicates a determined relationship.
highlights the summary of results in regard to RQ2, at what levels are temperature, precipitation, snow depth, and wind speed associated with significant fault rates for switches, signals, track, and catenaries. These values are the first point the fault rate crosses the threshold line.
Table 8. Summary of results regarding the thresholds of significant fault rates.
6. Climate zone fault rate analysis
There are a range of climates experienced across Sweden, which may influence the fault rates and thresholds due to differences in infrastructure asset exposure and resilience. This section presents the results of climate zone analysis of fault rates for the nine relationships highlighted in .
6.1. Effects of temperature between climate zones
highlights the fault rates for switches, tracks, and catenaries and the daily average temperature (°C) for climate zones Dfb and Dfc. Dfb is a more humid continental climate and temperatures are typically not as low as in climate zone Dfc, a polar, tundra climate. Based on , the vulnerability of switches () does not differ greatly between climate zones. The vulnerability of tracks () differs between climate zones. The fault rate is higher in Dfb, and the threshold is only crossed for temperatures above 0°C. While in Dfc the threshold is crossed at −30°C and +20°C. Lastly, there is no difference in the vulnerability of catenaries across climate zones ().
Figure 9. Fault rates for switches, tracks, and catenaries and daily average temperature (°C) between climate zones Dfb and Dfc.
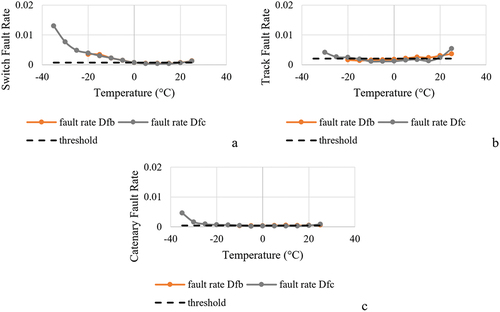
Climate zone Dfc, located in the north of Sweden, experiences lower temperatures compared to Dfb. Consequently, maintenance and operations for low temperatures are well established in the north. Temperature increases associated with climate change are expected to impact northern Sweden the most (Thaduri, Garmabaki, & Kumar, Citation2021). At 20°C the track fault rate in Dfc sharply increases and may continue to increase in the future. Climate zone Dfb has a higher overall track fault rate, and the threshold is only crossed at temperatures above freezing. Due to climate change both climate zones may experience an increase in infrastructure faults.
6.2. Effects of precipitation between climate zones
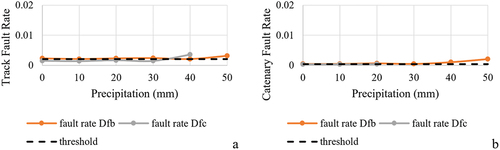
shows the fault rates for track and catenaries and daily average precipitation (mm) for the two climate zones. In the fault rate in climate zone Dfb is overall slightly higher than in Dfc for tracks. Additionally, the threshold is crossed at 0 mm in Dfb and increases more significantly at 40 mm, however, the threshold is not crossed until 40 mm in Dfc. The fault rate for tracks is overall higher in climate zone Dfb signifying that tracks are more vulnerable to precipitation in this zone. indicates that there is no great difference between the climate zones for catenary vulnerability.
Figure 10. Fault rates for tracks and catenaries and daily average precipitation (mm) between climate zones Dfb and Dfc.
6.3. Effects of snow depth between climate zones
highlights the fault rates for switches and tracks between the two climate zones. There is no great difference in the vulnerability of switches between climate zones (). However, there is a slight increase in track vulnerability to snow in Dfb (), where the threshold is crossed at 40 cm, compared to 90 cm in Dfc.
Figure 11. Fault rates for switches and tracks and daily average snow depth (cm) between climate zones Dfb and Dfc.
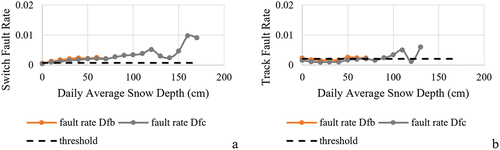
Climate zone Dfc is exposed to higher volumes of snow compared to Dfb, therefore, the operation and maintenance strategies in this zone are likely to be more robust compared to Dfb. Despite this both track and switch fault rates increase at snow depths greater than 90 cm in the Dfc climate zone.
6.4. Effects of wind speed between climate zones
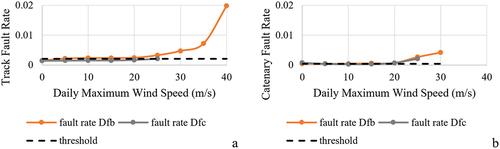
Whilst the Köppen-Geiger classification does not include wind this was still explored. highlights the fault rates for tracks () and catenaries () for daily maximum wind speed (m/s). For tracks (), the fault rate is higher in Dfb when compared to Dfc, crossing the threshold at 0 m/s but increasing more significantly at around 30 m/s. Dfb is located in the more southern region of the country which is more coastal and exposed to windstorms, especially during the winter months. However, there is no notable difference for catenaries ().
Figure 12. Fault rates for tracks and catenaries and daily maximum wind speed (m/s) between climate zones Dfb and Dfc.
6.5. Summary of results: RQ3
summarise the results of RQ3, highlighting that only track assets vary significantly in vulnerability between the two dominant climate zones in Sweden. The fault rate for Dfc in look similar to the fault rates discussed in Section 4.0 (), and the fault rate for Dfb in look similar to the fault rates presented in as the analysis in Section 4 considers the exposure of stations to different weather conditions for the entire country. For example, extreme low temperatures, high snow depths are more common in climate zone Dfc while stations in climate zone Dfb are more exposed to high levels of precipitation and wind speed. The results of this analysis can be useful for asset management strategies between climate zones.
Table 9. Summary of results regarding the differences in asset vulnerability between climate zones. Where ‘–’ indicates the relationships not carried forward in this analysis and ‘X’ indicates a strong difference between climate zones.
Table 10. Summary of results regarding differences in thresholds between climate zones.
7. Approach, limitations, and future work
This paper presents an analysis of the vulnerability of four types of railway assets to four types of weather variables, across the Swedish railway network between 2006 and 2020. The approach used is built on previous analysis by Fisher (Citation2021), better accounting for asset quantities and the preparedness of infrastructure management across different climate zones. However, the approach is not without its limitations and assumptions.
The approach used takes a holistic stance to understand the relationship between weather variables and railway fault incidents. The approach quantifies the correlation rather than causation of faults, by applying normalisation techniques to confidently draw conclusions about the influence of weather on railway assets. This can be further improved by leveraging more accurate asset quantities to provide comprehensive weightings across railway stations. For instance, for track and catenary, we used the sum of the distance between entry and exit signals for each track at each station as a proxy for the station length and define the fault rates as the number of faults per kilometre. More detailed information on track and catenary length would be useful in further developing this method.
Further work would be needed to investigate the specific causation of these weather-related incidents, which may be possible with these datasets, however, is limited significantly by the quality of the data available. In particular, the reporting of weather-related faults is subjective and influenced by the knowledge and experience of the fault reporter as well as the limitations of the system within which they are reporting the fault. Consequently, the approach taken here has endeavoured to limit the influence of subjective and erroneous fault incident attribution to weather causes or lack thereof. Future work may also investigate recovery and restoration times in order to gain a further understanding of the impact of faults from a temporal scale perspective.
This analysis was also limited in terms of the resolution of weather observations available compared with Fisher (Citation2021) who utilised reanalysed gridded weather datasets with a 5 km resolution. However, a sensitivity analysis was undertaken to maximise the quantity of fault events and the accuracy of weather observations. In addition, the number of stations in climate zone Dfc is less than in climate zone Dfb, therefore the amount of data points differs, which could also influence the results. Furthermore, future analyses would benefit from investigating the impact of multi-hazard events, such as storms.
This type of analysis would benefit from further work to consider the future impacts of climate change on Sweden’s railway infrastructure. Whilst this has been explored in some literature (Greenham, Citation2023; Thaduri, Garmabaki, & Kumar, Citation2021), there is significant work needed to accurately quantify the future impacts of climate change, not only on infrastructure but on disruption to services and the resulting economic consequences. This will help inform adaptation policy and action (Dépoues, Citation2017; Lindgren, Jonsson, & Carlsson-Kanyama, Citation2009).
8. Conclusion
The results of this research build on an existing understanding of the vulnerability of Sweden’s railway infrastructure to weather impacts. Overall, track was found to be vulnerable across all four weather variables, catenary was not impacted by snow depth, and switches were impacted by low temperatures and snow depth. However, signals were not found to have any significant relationships with any of the variables. Further analysis identified specific thresholds where rates of failure become significant, and in many cases increase substantially. This finding is of particular interest to asset managers who can leverage these findings to inform more resilient extreme weather planning strategies.
Our analysis expanded on these findings to investigate the influence of the dominant climate zones in Sweden. We found that there were only notable differences across climate zones for track assets where vulnerability differed across all weather variables. This indicates that differences in preparedness and asset management across Sweden’s railway influences the resilience of track assets to weather variables. This is likely to be further exacerbated by climate change. Further work is needed to assess the risk of climate change to Sweden’s railway network to ensure resilient mobility for the future.
Revised Appendix A Sensitivity Analysis.docx
Download MS Word (2.7 MB)Revised Appendix B Detailed Results.docx
Download MS Word (1.9 MB)Acknowledgments
This research has been funded by the Swedish Transport Administration through grant numbers TRV2020/119576, TRV2021/99838, TRV2023/30667, and TRV2024/2731. The authors would like to thank Carl Johnsson for help in downloading and processing the weather data.
Disclosure statement
No potential conflict of interest was reported by the author(s).
Data availability statement
Datasets are available from the corresponding author upon reasonable request.
Supplementary material
Supplemental data for this article can be accessed online at https://doi.org/10.1080/23789689.2024.2340371
Additional information
Funding
Notes on contributors
Michelle Ochsner
Michelle Ochsner is a PhD student at Lund University and is affiliated with K2 - The Swedish Knowledge Centre for Public Transport. Her research is focused on adapting railway infrastructure to climate change.
Rachel Fisher
Rachel Fisher is an assistant professor at the Department of Civil Engineering at the University of Birmingham and the Birmingham Centre for Railway Research and Education. Their research focuses on extreme weather hazards, transport infrastructure resilience, and climate change adaptation.
Carl-William Palmqvist
Carl-William Palmqvist is an Associate Professor at the Department of Technology and Society at Lund University and affiliated with K2 - The Swedish Knowledge Centre for Public Transport. He leads a research group focusing on railway operations.
References
- Baker, C. J., Chapman, L., Quinn, A., & Dobney, K. (2010). Climate change and the railway industry: A review. Proceedings of the Institution of Mechanical Engineers, Part C: Journal of Mechanical Engineering Science, 224(3), 519–528. https://doi.org/10.1243/09544062JMES1558
- Beck, H. E., Zimmermann, N. E., McVicar, T. R., Vergopolan, N., Berg, A., & Wood, E. F. (2018). Present and future Köppen-geiger climate classification maps at 1-km resolution. Scientific Data, 5(1), 180214. https://doi.org/10.1038/sdata.2018.214
- Brazil, W., White, A., Nogal, M., Caulfield, B., O’Connor, A., & Morton, C. (2017). Weather and rail delays: Analysis of metropolitan rail in Dublin. Journal of Transport Geography, 59, 69–76. https://doi.org/10.1016/j.jtrangeo.2017.01.008
- Bubeck, P., Dillenardt, L., Alfieri, L., Feyen, L., Thieken, A. H., & Kellermann, P. (2019). Global warming to increase flood risk on European railways. Climatic Change, 155(1), 19–36. https://doi.org/10.1007/s10584-019-02434-5
- Chen, Z., & Wang, Y. (2019). Impacts of severe weather events on high-speed rail and aviation delays. Transportation Research Part D: Transport & Environment, 69, 168–183. https://doi.org/10.1016/j.trd.2019.01.030
- Dawson, D., Shaw, J., & Roland Gehrels, W. (2016). Sea-level rise impacts on transport infrastructure: The notorious case of the coastal railway line at Dawlish, England. Journal of Transport Geography, 51, 97–109. https://doi.org/10.1016/j.jtrangeo.2015.11.009
- Dépoues, V. (2017). Organisational uptake of scientific information about climate change by infrastructure managers: The case of adaptation of the French railway company. Climatic Change, 143(3–4), 473–486. https://doi.org/10.1007/s10584-017-2016-y
- Dobney, K., Baker, C. J., Chapman, L., & Quinn, A. D. (2010). The future cost to the United Kingdom’s railway network of heat-related delays and buckles caused by the predicted increase in high summer temperatures owing to climate change. Proceedings of the Institution of Mechanical Engineers, Part F: Journal of Rail & Rapid Transit, 224(1), 25–34. https://doi.org/10.1243/09544097JRRT292
- Dobney, K., Baker, C. J., Quinn, A. D., & Chapman, L. (2009). Quantifying the effects of high summer temperatures due to climate change on buckling and rail related delays in south-east United Kingdom: climate change and railway buckling. Meteorological Applications, 16(2), 245–251. https://doi.org/10.1002/met.114
- Fabella, V. M., & Szymczak, S. (2021). Resilience of railway transport to four types of natural hazards: An analysis of daily train volumes. Infrastructures, 6(12), 174. https://doi.org/10.3390/infrastructures6120174
- Ferranti, E., Chapman, L., Lee, S., Jaroszweski, D., Lowe, C., McCulloch, S., & Quinn, A. (2018). The hottest July day on the railway network: Insights and thoughts for the future. Meteorological Applications, 25(2), 195–208. https://doi.org/10.1002/met.1681
- Ferranti, E., Chapman, L., Lowe, C., McCulloch, S., Jaroszweski, D., & Quinn, A. (2016). Heat-related failures on Southeast England’s railway network: Insights and implications for heat risk management. Weather, Climate, and Society, 8(2), 177–191. https://doi.org/10.1175/WCAS-D-15-0068.1
- Fisher, R. S. (2021). Quantifying the vulnerability of GB rail to temperature and precipitation in order to improve resilience [ Doctoral thesis]. University of Birmingham.
- Forzieri, G., Bianchi, A., Silva, F. B. E., Marin Herrera, M. A., Leblois, A., Lavalle, C., Aerts, J. C. J. H., & Feyen, L. (2018). Escalating impacts of climate extremes on critical infrastructures in Europe. Global Environmental Change, 48, 97–107. https://doi.org/10.1016/j.gloenvcha.2017.11.007
- Fu, Q., & Easton, J. M. (2018). Prediction of weather-related incidents on the rail network: Prototype data Model for wind-related delays in Great Britain. ASCE-ASME Journal of Risk and Uncertainty in Engineering Systems, Part A: Civil Engineering, 4(3), 04018027. https://doi.org/10.1061/AJRUA6.0000975
- Garmabaki, A. H. S., Odelius, J., Thaduri, A., Mayowa, S., & Kumar, U. (2022). Climate change impact assessment on railway maintenance. Proceedings of the 32nd European Safety and Reliability Conference (ESREL 2022) (pp. 2913–2920). https://doi.org/10.3850/978-981-18-5183-4_S25-01-126-cd
- Garmabaki, A. H. S., Thaduri, A., Famurewa, S., & Kumar, U. (2021). Adapting railway maintenance to climate change. Sustainability, 13(24), 13856. https://doi.org/10.3390/su132413856
- Greenham, S. (2023). Quantifying the Impact of Heat and Climate Change on London Underground’s Infrastructure [Doctoral thesis]. University of Birmingham.
- Greenham, S., Ferranti, E., Quinn, A., & Drayson, K. (2020). The impact of high temperatures and extreme heat to delays on the London underground rail network: An empirical study. Meteorological Applications, 27(3), 27. https://doi.org/10.1002/met.1910
- Jaroszweski, D., Hooper, E., Baker, C., Chapman, L., & Quinn, A. (2015). The impacts of the 28 June 2012 storms on UK road and rail transport: Impacts of the 28 June 2012 storms on UK transport. Meteorological Applications, 22(3), 470–476. https://doi.org/10.1002/met.1477
- Jaroszweski, D., Hooper, E., & Chapman, L. (2014). The impact of climate change on urban transport resilience in a changing world. Progress in Physical Geography: Earth and Environment, 38(4), 448–463. https://doi.org/10.1177/0309133314538741
- Johansson, J., Hassel, H., & Cedergren, A. (2011). Vulnerability analysis of interdependent critical infrastructures: Case study of the Swedish railway system. International Journal of Critical Infrastructures, 7(4), 289. https://doi.org/10.1504/IJCIS.2011.045065
- Kellermann, P., Bubeck, P., Kundela, G., Dosio, A., & Thieken, A. (2016). Frequency analysis of critical meteorological conditions in a changing climate—Assessing future implications for railway transportation in Austria. Climate, 4(2), 25. https://doi.org/10.3390/cli4020025
- Lindgren, J., Jonsson, D. K., & Carlsson-Kanyama, A. (2009). Climate adaptation of railways: Lessons from Sweden. European Journal of Transport and Infrastructure Research, 9(2), 2009. https://doi.org/10.18757/EJTIR.2009.9.2.3295
- Liu, K., Wang, M., & Zhou, T. (2021). Increasing costs to Chinese railway infrastructure by extreme precipitation in a warmer world. Transportation Research Part D: Transport & Environment, 93, 102797. https://doi.org/10.1016/j.trd.2021.102797
- Ludvigsen, J., & Klæboe, R. (2014). Extreme weather impacts on freight railways in Europe. Natural Hazards, 70(1), 767–787. https://doi.org/10.1007/s11069-013-0851-3
- Lu, Q.-C., Xu, P., Cui, X., & Li, J. (2022). Railway vulnerability and resilience. In R. Calçada & S. Kaewunruen (Eds.), Rail infrastructure resilience: A best-practices handbook (pp. 5–35). Elsevier. https://doi.org/10.1016/B978-0-12-821042-0.00020-4.
- Maduranga, U. G. D., Edirisinghe, M., Alahacoon, N., & Ranagalage, M. (2022). Spatiotemporal variability of lightning activity over the railway network in Sri Lanka with special attention to the proposed suburban railway electrification network. Infrastructures, 7(7), 92. https://doi.org/10.3390/infrastructures7070092
- Mattsson, L.-G., & Jenelius, E. (2015). Vulnerability and resilience of transport systems – A discussion of recent research. Transportation Research Part A: Policy and Practice, 81, 16–34. https://doi.org/10.1016/j.tra.2015.06.002
- Network Rail. (2021). Catalogue of network rail standards. Network Rail.
- Ochsner, M., Ivina, D., & Palmqvist, C.-W. (2023). Weather-related railway infrastructure failures in Sweden: An exploratory study. Presented at the The 10th International Conference on Railway Operations Modelling and Analysis (ICROMA), Belgrade.
- Ochsner, M., & Palmqvist, C.-W. (2022). Weather and Train Disruptions in Sweden, 2011–2019. Presented at the COMPRAIL 2022, Valencia, Spain, 213, 113–120. https://doi.org/10.2495/CR220101
- Oslakovic, I. S., Ter Maat, H., & Dewulf, G. P. M. R. (2013). Risk assessment of climate change impacts on railway infrastructure. Working paper series, Proceedings of the Engineering Project Organization (EPOC 2013), (Working Paper Proceedings) (Vol. 2013, pp. 1–16). Winter Park, Colorado, July 9–11, 2013.
- Oslakovic, I. S., Ter Maat, H., Hartmann, A., & Dewulf, G. (2012). Climate change and infrastructure performance: Should we worry about? Procedia – Social & Behavioral Sciences, 48, 1775–1784. https://doi.org/10.1016/j.sbspro.2012.06.1152
- Palin, E. J., Stipanovic Oslakovic, I., Gavin, K., & Quinn, A. (2021). Implications of climate change for railway infrastructure. WIREs Climate Change, 12(5), 12. https://doi.org/10.1002/wcc.728
- Palin, E. J., Thornton, H. E., Mathison, C. T., McCarthy, R. E., Clark, R. T., & Dora, J. (2013). Future projections of temperature-related climate change impacts on the railway network of Great Britain. Climatic Change, 120(1–2), 71–93. https://doi.org/10.1007/s10584-013-0810-8
- Palmqvist, C.-W., Olsson, O. E., Winslott, N., & Hiselius, L. (2017). Some influencing factors for passenger train punctuality in Sweden. International Journal of Prognostics and Health Management, 8(3), 20. https://doi.org/10.36001/ijphm.2017.v8i3.2649
- Powrie, W., & Smethurst, J. (2019). Climate and vegetation impacts on infrastructure cuttings and embankments. Proceedings of the 8th International Congress on Environmental Geotechnics Volume 1: Towards a Sustainable Geoenvironment 8th (pp. 128–144). Hangzhou, China.
- Pregnolato, M., Giordano, P. F., Prendergast, L. J., Vardanega, P. J., & Limongelli, M. P. (2023). Comparison of risk-based methods for bridge scour management. Sustainable and Resilient Infrastructure, 8(5), 514–531. https://doi.org/10.1080/23789689.2023.2175141
- Stenström, C., Famurewa, S. M., Parida, A., & Galar, D. (2012). Impact of cold climate on failures in railway infrastructure effect of cold climate on failures in railway infrastructure. Presented at the 2nd International Congress on Maintenance Performance Measurement & Management Conference Proceedings (MPMM 2012) Lulea, Sweden.
- Szymczak, S., Bott, F., Babeck, P., Frick, A., Stöckigt, B., & Wagner, K. (2022). Estimating the hazard of tree fall along railway lines: A new GIS tool. Natural Hazards, 112(3), 2237–2258. https://doi.org/10.1007/s11069-022-05263-5
- Thaduri, A., Garmabaki, A., & Kumar, U. (2021). Impact of climate change on railway operation and maintenance in Sweden: A state-of-the-art review. Maintenance, Reliability and Condition Monitoring, 1(2), 52–70. https://doi.org/10.21595/mrcm.2021.22136
- Wang, T., Qu, Z., Yang, Z., Nichol, T., Clarke, G., & Ge, Y.-E. (2020). Climate change research on transportation systems: Climate risks, adaptation and planning. Transportation Research Part D: Transport & Environment, 88, 102553. https://doi.org/10.1016/j.trd.2020.102553
- Woodburn, A. (2019). Rail network resilience and operational responsiveness during unplanned disruption: A rail freight case study. Journal of Transport Geography, 77, 59–69. https://doi.org/10.1016/j.jtrangeo.2019.04.006
- Xia, Y., Van Ommeren, J. N., Rietveld, P., & Verhagen, W. (2013). Railway infrastructure disturbances and train operator performance: The role of weather. Transportation Research Part D: Transport & Environment, 18, 97–102. https://doi.org/10.1016/j.trd.2012.09.008
- Zakeri, G., & Olsson, N. O. E. (2018). Investigating the effect of weather on punctuality of Norwegian railways: A case study of the Nordland Line. Journal of Modern Transportation, 26(4), 255–267. https://doi.org/10.1007/s40534-018-0169-7