
 ?Mathematical formulae have been encoded as MathML and are displayed in this HTML version using MathJax in order to improve their display. Uncheck the box to turn MathJax off. This feature requires Javascript. Click on a formula to zoom.
Abstract
Accurate evaluation of food accessibility is the prerequisite for developing sustainable food policies. Most existing studies have evaluated food accessibility by setting a single service area size for all food retailers across a study area. In reality, service area sizes can vary significantly among different types of food retailers in different geographical regions, thus forming a retailer hierarchy. In this study, we propose a new machine learning method to delineate service areas and hierarchical levels for all food retailers in a large study area. Based on the proposed method, a comprehensive case study of 79,419 food retailers was carried out in Wuhan, China. This study revealed three hierarchical levels of food retailers in Wuhan. Retailers at higher positions in the hierarchy had fewer entities but larger service areas. The hierarchical levels of food retailers can be accurately determined by fifteen attractiveness factors. These results underscore the dominant role of middle- and upper-level retailers in determining food accessibility; that is, they accounted for only 6.9 percent of total retailers but contributed to 96.3 percent of total accessibility. Ignoring the hierarchical structure of food retailers will introduce significant bias in food accessibility evaluations.
对食品可及性的准确评估, 是制定可持续食品政策的先决条件。大多数研究都为研究区内所有食品零售商设置了单一的服务区, 以评估食品可及性。事实上, 不同区域的不同类型食品零售商的服务区大小, 有显著的差异, 从而形成了零售商等级体系。我们提出了一种新的机器学习方法, 在研究区内对所有食品零售商划定服务区和等级。利用这种方法, 对中国武汉市79,419家食品零售商进行了综合案例研究。本研究揭示了武汉市食品零售商的三个等级。级别较高的零售商较少、但服务区较大。15个吸引力因子能准确地确定食品零售商的等级。这些结果, 强调了中高级别零售商对食品可及性的主导性决定作用: 它们只占零售商总数的6.9%, 但占总可及性的96.3%。忽视食品零售商的等级结构, 会导致食品可及性评估的重大偏差。
Una evaluación exacta de la accesibilidad a los alimentos es el prerrequisito para desarrollar políticas alimentarias sustentables. La mayoría de los estudios existentes han evaluado la accesibilidad a los alimentos estableciendo un tamaño único del área de servicios para todos los minoristas de alimentos en un área de estudio. En realidad, los tamaños de las áreas de servicio pueden variar significativamente entre los diferentes tipos de minoristas del comercio de alimentos en diferentes regiones geográficas, formando así una jerarquía de minoristas. En este estudio, proponemos un nuevo método de aprendizaje automático para delinear las áreas de servicio y los niveles de jerarquía para todos los minoristas de alimentos de un área de estudio grande. Con base en el método propuesto, se efectuó un estudio de caso exhaustivo que incluyó 79.419 minoristas de alimentos en Wuhan, China. El estudio reveló tres niveles jerárquicos de minoristas de alimentos en aquella ciudad. Los minoristas de las posiciones más altas en la jerarquía tenían mucho menos entidades, pero sí áreas de servicio más grandes. Los niveles jerárquicos de los minoristas de alimentos pueden determinarse con exactitud por medio de quince factores de atractivo. Estos resultados subrayan el papel dominante de los minoristas de los niveles medio y superior para determinar la accesibilidad alimentaria; o sea, solo representaban el 6,9 por ciento del total de minoristas, pero contribuían el 96,3 por ciento de la accesibilidad total. Ignorar la estructura jerárquica de los minoristas de alimentos, introducirá un sesgo significativo en las evaluaciones de la accesibilidad a los alimentos.
Health is highly related to dietary behaviors. Unhealthy diets—for example, those with insufficient fruits and vegetables, and foods high in salt and fat—are associated with obesity and many chronic diseases, such as cardiovascular disease, diabetes, and esophageal cancer (Neuhouser Citation2019). Socioecological models of behavior suggest that dietary choices and health outcomes are shaped by neighborhood food environments (Townshend and Lake Citation2009; Cannuscio et al. Citation2013). Individuals living in food deserts with limited access to healthy and affordable foods could experience poor nutrition and subsequent adverse health outcomes (Shannon Citation2016). Considering these theoretical relationships, the provision of sufficient access to healthy and affordable foods for everyone is increasingly seen as a priority for many governments around the world. For example, the United States passed the Farm Bill, which established the Food Insecurity Nutrition Incentive to provide tax incentives or financial support for new full-service supermarkets in food deserts (Liu, Han, and Cohen Citation2015).
Comprehensive evaluations of the food environment are a prerequisite to fully understand its relationship between food accessibility and health outcomes, informing the development of sustainable food policies. In the literature, the food environment in a residential neighborhood is typically evaluated by spatial accessibility to food retailers (Lytle and Sokol Citation2017; Li and Wang Citation2022). Several place-based accessibility measures have been developed largely in terms of the proximity to food retailers. One of the most commonly used measures is the cumulative-opportunity measure. This metric evaluates the food accessibility of a location using the number of food retailers within local neighborhoods as defined by buffers around homes (e.g., one-mile buffers) or administrative units (e.g., census tract). Using these measures, much research has focused on investigating the empirical relationships between food environments and health outcomes. These investigations, however, showed inconsistent results: Some findings suggested a relationship (Caspi et al. Citation2012; An, He, and Shen Citation2020) but others found no significant relationship between food environments and health outcomes (Cummins, Flint, and Matthews Citation2014). One major reason for these inconsistent results could be that these evaluations of neighborhood food environments deploy oversimplified models of retailer choice behavior; that is, residents select food retailers based on only the proximity factor (Shannon Citation2016; Scharadin, Ver Ploeg, and Dicken Citation2022).
The Complexities of Retailer Choice Behaviors
The complexities of retailer choice behaviors of neighborhood residents have been well documented by many empirical studies. For example, Cannuscio et al. (Citation2013) found that almost all participants did their primary food shopping at large chain supermarkets, rather than shopping at the supermarket closest to home. Dubowitz et al. (Citation2015) found a similar result and observed that individual obesity outcomes had no significant relationship with the distance to the closest supermarket but showed a strong correlation with the distance to primary food shopping sites. Liu, Han, and Cohen (Citation2015) found that widely employed definitions of local neighborhoods cannot cover well the food retailers actually visited by neighborhood residents (e.g., buffers of one or two miles around a home covered only 55 percent to 65 percent of food retailers visited). Shannon (Citation2016) observed a significant difference in median travel distance to various types of food retailers. This study also found that several key factors, apart from the proximity, influenced residents’ food retailer choice decisions, including the characteristics of food retailers, the availability of public transport options, and perceptions of neighborhood safety. These empirical studies highlight the complexities of retailer choice behaviors, which further lead to heterogeneous travel distances to various food retailers. To accurately quantify residents’ neighborhood food environments, it is thereby necessary to incorporate the complexities of retailer choice behaviors into the food accessibility evaluations. Ignoring such complexities would inhibit a consistent understanding of the fundamental relationships between neighborhood food environments and health outcomes.
Retailer Service Area Delineation
One possible way to incorporate the heterogeneity of travel distances to various retailers into the food accessibility evaluations is to use the service-area measure from the retailer perspective. This measure evaluates the food accessibility of a location in terms of the number of retailers whose service areas cover the location (Russell and Heidkamp Citation2011; H. Wang and Qiu Citation2016). The service area of a food retailer is defined as the areal extent within which the majority of a retailer’s customers will be found (Dolega, Pavlis, and Singleton Citation2016). This measure is equivalent to the cumulative-opportunity measure when a single service area size is set for all food retailers. Setting an appropriate service area size for every food retailer, however, can generalize the cumulative-opportunity measure by explicitly considering heterogeneous travel distances to various retailers. Nevertheless, how to delineate appropriate service area sizes for all food retailers in a large study area remains unresolved.
The problem of delineating retailer service areas for shopping centers has been intensively studied in the literature (Ballantyne et al. Citation2023). Several methods have been developed for this purpose, such as the Huff model (Huff Citation1964; Dolega, Pavlis, and Singleton Citation2016). It is widely recognized that shopping centers are naturally organized into a hierarchical structure. A few centers at upper hierarchical positions have large service areas, whereas a greater number of centers at lower hierarchical positions have smaller service areas. This hierarchy of shopping centers can be interpreted by the central place theory (Christaller Citation1933). Shopping centers toward the upper end of the hierarchy provide multipurpose comparison shopping experiences that attract customers from a greater distance. By contrast, shopping centers at the lower end of the hierarchy offer convenience goods and are more frequently patronized by local communities. Using emerging big geospatial data, many recent studies have confirmed the hierarchical structure of shopping centers and further revealed attractiveness factors representing the choice preferences of residents that determine the hierarchical positions of shopping centers, including shopping center size, retail tenant mix, the numbers of leisure outlets, anchor stores, and parking facilities (Comber et al. Citation2020; Ballantyne et al. Citation2023). Little is known, however, about whether food retailers are organized into a hierarchical structure, and how retailer choice preferences determine service area sizes and the hierarchical positions of food retailers.
Research Objectives
This study seeks to fill two gaps in food accessibility research: to develop a new method for delineating service area sizes and hierarchical positions of food retailers by explicitly capturing complexities of resident retailer choice behaviors, and to empirically investigate how various food retailers in a large study area are organized into a hierarchical structure, how various attractive factors influence hierarchical positions of food retailers, and how the hierarchical structure of food retailers affects the spatial patterns of food accessibility. To achieve these two research objectives, we propose a powerful machine learning method to delineate service areas and hierarchical levels of all food retailers in a large study area. Based on the proposed method, we conducted an empirical study in a Chinese megacity, Wuhan, using 79,419 food retailers. The results of this study will advance methodologies to delineate service areas and hierarchical levels of food retailers and enrich our understanding of how retailer hierarchy shapes food accessibility in a large metropolitan area.
Literature Review
Food Accessibility Measures
Accessibility is a fundamental concept in geographical research and other related fields. It refers to the ease with which opportunities can be reached from a particular location (or by individuals at that location) using a particular transportation system (Kwan Citation1998). Food accessibility (i.e., accessibility to food retailers) can be evaluated following the generic accessibility evaluation framework. Existing accessibility measures can be roughly classified into two categories: place-based and people-based measures (Kwan Citation1998). People-based measures quantify the accessibility of an individual by considering the individual’s characteristics and everyday mobility. By using individual tracking data, these measures have been used to evaluate individual exposure to food retailers beyond residential neighborhoods (X. Chen and Kwan Citation2015; Smith et al. Citation2022). People-based measures require individual-level data, however, which can be expensive and difficult to acquire on a large scale.
Place-based measures evaluate the accessibility of a location by considering land-use and transportation components but ignoring the individual component. They require a few aggregated data and thus have been widely applied to evaluate neighborhood food environments. Three commonly used food accessibility methods are cumulative-opportunity, service-area, and density-based measures. As mentioned earlier, the cumulative-opportunity measure calculates the number of accessible food retailers within a single buffer zone centered at the home location. As an extension, the density-based measure calculates the supply-to-demand ratio by simply normalizing the number of accessible food retailers with a neighborhood population (Maimaiti et al. Citation2019) or using advanced methods of two-step floating catchment (B. Y. Chen et al. Citation2020). The service-area measure can generalize the cumulative-opportunity measure by considering heterogeneous service areas of various food retailers. Most existing studies, however, simply set a single service area size for all food retailers, which could introduce considerable bias (Russell and Heidkamp Citation2011; H. Wang and Qiu Citation2016). Therefore, the heterogeneity of retailer service area sizes should be delineated and explicitly considered when using the service-area measure.
Retailer Service Area Delineation Methods
The problem of delineating retailer service areas can also be formulated as the problem of calibrating a distance decay function; for example, This function reveals that the customer visit probability
to a specific retailer
decreases with travel distance
and
is a distance decay parameter required for calibrations. With the calibrated function, the service area size of a retailer can be determined as the inverse cumulative probability function at a certain probability level (e.g., the 85th percentile).
Several methods have been developed for delineating service areas of shopping centers and can be classified into three categories. The first category of methods is to directly estimate distance decay parameters through field surveys or retailer transaction data (Reed, Buckmaster, and Reed Citation2018). Field surveys or retailer transaction data are not typically available for every shopping center in a large study area, however.
The second category is comprised of methods that determine the service area sizes by their positions within the shopping center hierarchy (Dennis, Marsland, and Cockett Citation2002; Dolega, Pavlis, and Singleton Citation2016). Empirical evidence has shown that the positions within the shopping center hierarchy can be determined according to a set of attractiveness factors (Dennis, Marsland, and Cockett Citation2002; Reimers and Clulow Citation2009; Dolega, Pavlis, and Singleton Citation2016). Researchers have developed composite attractiveness indexes by calculating a weighted sum of multiple attractiveness factors. The relationship is further calibrated between the developed composite indexes and hierarchical positions. The service area sizes of shopping centers, thereby, can be determined according to their hierarchical positions.
The last category of methods is the Huff model and its variants (Huff Citation1964; Yue et al. Citation2012). The Huff model formulates the probability of a customer choosing a shopping center by considering three variables: travel distance, attractiveness, and competition. The competition effect is formulated using a behavioral assumption that the visit probability of a specific shopping center is proportional to the customer visit utility with respect to attractiveness, travel distance, and the distance decay parameter. A Huff model can be used to calibrate the distance decay parameter by collecting data on customer shopping center choice probability, which is traditionally collected by field surveys (Reed, Buckmaster, and Reed Citation2018). Recent studies have used big mobility data to extract shopping center choice probability, including taxi trajectories (Yue et al. Citation2012), and mobile phone data (Ballantyne et al. Citation2023).
These three categories of methods, however, cannot be used to calibrate the distance decay parameters for all food retailers in a large study area. There are often a large number of food retailers in the whole study area (e.g., 79,419 food retailers in Wuhan). Therefore, it is difficult to use field survey data to directly estimate the distance decay parameters of every food retailer. In addition, the attractiveness factors that influence the position of food retailers within a hierarchy could be different from those of shopping centers. Therefore, the composite attractiveness index developed for shopping centers is not applicable when predicting the hierarchical positions of food retailers. Finally, the behavioral assumption in Huff models (i.e., the visit probability of a specific shopping center is proportional to the visit utility of customers) might not be valid for the food purchasing behavior. Further, taxi trajectories and mobile phone data might not be feasible for extracting food purchase trips for most food retailers with small sizes or surrounded by other points of interest (POIs). Therefore, a new method should be developed for delineating service areas of all food retailers in a large study area.
Method
Service-Area Measure to Evaluate Food Accessibility
This section introduces the service-area measure to evaluate food accessibility (H. Wang and Qiu Citation2016; Y. Wang et al. Citation2018). Let be a set of food retailers. Each food retailer
has a geographical location. Let
be the food accessibility level of residents at location
It can be calculated by the total number of food retailers whose service areas cover location
(1)
(1)
where
is the travel distance from location i to retailer
in the transport network, and
is a binary function indicating whether location i is covered by the service area of retailer
(2)
(2)
where
is the service area size of retailer
It delineates the service area of a retailer where the majority of its customers will be found (Dolega, Pavlis, and Singleton Citation2016). The total accessibility across the whole study area, denoted by A, can be calculated as:
(3)
(3)
The spatial inequity of food accessibility across the whole study area can be quantified using the Gini coefficient (B. Y. Chen et al. Citation2020), denoted by GC, as:
(4)
(4)
where N is the total number of locations in the study area, and
is the accessibility value at location j. The Gini coefficient ranges from 0 to 1. A higher value indicates a more unequal distribution of food accessibility among different locations.
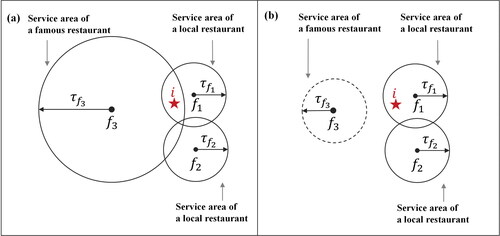
This service-area method effectively captures the heterogeneous service area sizes of food retailers. An illustrative example is given in . There are three restaurants: and
are two local restaurants with
= 1 km (i.e., walking time of 15 minutes), and
is a famous restaurant in the city center with
km (i.e., driving time of 15 minutes). As shown in Figure 1, residents at location
can access
and
as their service areas cover location
Thus, we have
in this example. As illustrated in , if we simply set a single service area size of 1 km for all three restaurants, then a significant bias occurs when evaluating the food accessibility with
Therefore, appropriate service area sizes should be applied to all food retailers to accurately evaluate food accessibility.
Figure 1. Illustrative examples of service-area method: (A) the hierarchical service area size scenario; (B) the single service area size scenario.
Proposed Machine Learning Method of Delineating Retailer Service Area Sizes
This section introduces the proposed service area delineation method. It builds on two hypotheses: (1) The service area sizes of various food retailers reveal a hierarchical structure, and (2) hierarchical positions of food retailers can be determined by a set of attractiveness factors representing retailer choice preferences of residents. Using these hypotheses, we formulate the problem of delineating service areas of all food retailers as a problem of classifying retailers into a specific number of hierarchical levels. To solve the problem, we propose a new machine learning method by making full use of unsupervised learning, semisupervised learning, and SHapley Additive exPlanations (SHAP) techniques. The unsupervised learning technique uses small-scale field survey data to delineate the service area sizes and hierarchical levels of a few representative retailers. The representative retailers with hierarchical levels are used as labeled samples, whereas other retailers are used as unlabeled samples. Rich retailer information is extracted from big geospatial data as attractiveness factors for all labeled and unlabeled samples. The semisupervised learning technique is then applied to classify the hierarchical levels of all the food retailers by integrating all labeled and unlabeled samples. The SHAP technique is finally used to quantify the relative importance of attractiveness factors in determining hierarchical levels of food retailers.
Compared to existing methods, the proposed method offers several advantages. First, it requires field surveys for only a few representative retailers. This approach, therefore, is applicable to a large study area with numerous food retailers. Second, it classifies hierarchical levels of food retailers by integrating small-scale field survey data with rich retailer information extracted from big geospatial data. In recent years, rich retailer information (e.g., retailer location, type, price, user rating, user comments, etc.) has become publicly available through many location-based service applications (e.g., Google Map and Baidu Map). The integration of such information could significantly enhance the classification accuracy of retailer hierarchical levels. Third, it can not only delineate service areas and hierarchical levels of food retailers but also quantify the influences of attractiveness factors on retailer hierarchical levels. The powerful semisupervised learning and SHAP techniques can effectively quantify the attractiveness factor influences by capturing their complicated nonlinear or multicollinearity relationships. Thus, the proposed method provides an effective means for investigating retailer choice behaviors of residents from the perspective of food retailer hierarchy.
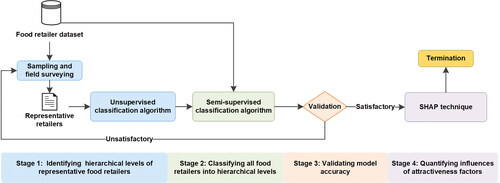
shows a detailed flowchart of the proposed method. It consists of four stages. Stage 1 is to conduct field surveys and use the unsupervised learning technique to delineate service area sizes and hierarchical levels for a few representative food retailers. Stage 2 is to employ the semisupervised learning technique to classify all food retailers into hierarchical levels. Stage 3 is to validate the accuracy of Stage 2 according to ground truth data provided by experienced local residents. If the validation results are satisfactory, we can terminate the hierarchical-level classification process. Otherwise, we should add more representative food retailers by conducting field surveys and repeat the process given. Finally, Stage 4 is to use the SHAP technique to quantify influences of attractiveness factors in determining retailer hierarchical levels. The procedure for each stage is described in the following sections.
Figure 2. Flowchart of the proposed machine learning method.
First Stage: Identifying the Hierarchical Levels of Representative Food Retailers. This stage is to determine service area sizes and hierarchical levels for representative food retailers using field survey data. It consists of three steps. The first step is to conduct a field survey to collect service area data on a certain number of representative food retailers. To ensure representativeness, stratified sampling is employed. Food retailers should be sampled by all retailer categories within each residential community, and residential communities should be evenly sampled across the whole study area.
For a representative retailer the service area size
can be quantified as the spatial region that covers the majority of a retailer’s customers (Applebaum and Cohen Citation1961; Dolega, Pavlis, and Singleton Citation2016). Therefore, in the first step, we collect the travel distance,
from a customer’s residence i to the location of retailer
by face-to-face inquiry using a structural questionnaire (Supplemental Table S.1). The questionnaire consists of a set of closed-ended questions. Question Q1 is designed to collect the respondents’ last activity location. Question Q2 is to estimate the travel distance
for the food purchase trip. To obtain more reliable travel distance estimates, we ask respondents about the transport mode and travel time spent. If multiple transport modes are used, the respondents are asked to record the time spent in each mode in the questionnaire. Then, the travel distance
can be calculated by multiplying the speed of each transport mode by the time spent in that mode:
(5)
(5)
where
(in km/h) is the speed of transport mode q, Q represents all transport modes used during that customer’s travel, and
(in hours) is the travel time spent using transport mode m. Questions about consumer frequency (Q3) and travel purposes (Q4) ensure that the questionnaire responses are reasonable. The questionnaire includes two demographic variables, namely gender and age group. Other variables, such as income, are not included in the field survey, because the collection of these variables could lead to a high refusal rate.
The second step is to identify the hierarchical levels of representative food retailers using a well-developed unsupervised learning algorithm, the TwoStep Cluster algorithm. This clustering algorithm automatically determines the optimal number of clusters with the need for manual inputs or trial-and-error. Let be the set of travel distance data obtained from all respondents of the same retailer
The 85th percentile, mean, and standard deviation of
are denoted by
and
respectively. These three values are used as the input features for clustering. The TwoStep Cluster algorithm first scans the data set and creates small subclusters by grouping similar cases. Then, the algorithm applies an agglomerative clustering to the preclustered subgroups, merging them into larger clusters based on their similarities (Tkaczynski Citation2017). After this step, we can determine the number of hierarchical levels in the food retailer hierarchy.
The third step is to calculate the service area size threshold (denoted by ) for each retailer
in hierarchical level k. In this study, we merge the
of all representative retailers in the same hierarchical level into a single travel distance distribution
This distribution is used to fit distance decay functions using three commonly used functions: the inverse power function
the exponential function
and the Gaussian function
Using the calibrated function, the service area size threshold
of a retailer can be determined as the inverse cumulative probability function at a specific confidence level (i.e., 85th percentile; Applebaum and Cohen Citation1961; Dolega, Pavlis, and Singleton Citation2016). This service area size threshold
is assigned to all food retailers in the same hierarchical level within the study area.
Second Stage: Classifying All Food Retailers into Hierarchical Levels. This stage is to classify all food retailers within the study area into hierarchical levels using a semisupervised learning technique (Qi and Luo Citation2020). The representative food retailers with the identified hierarchical levels in Stage 1 are used as samples with labels, whereas other food retailers are regarded as samples without labels. Let = {(
), (
), ., (
)} be the set of labeled samples, where
is a feature vector representing a retailer’s attractiveness factors, and
is the corresponding label representing the hierarchical level. Let
= {
.,
} be the set of unlabeled samples. The feature vector
for every food retailer
(e.g., retailer size, type, and price) is extracted from big geospatial data. This semisupervised learning technique determines
for every food retailer
by integrating
and
We employ a well-developed semisupervised learning algorithm, namely the tri-training classification algorithm (Zhou and Li Citation2005). This algorithm uses three classifiers—
and
—to collaboratively learn from a small data set of labeled samples and a larger data set of unlabeled samples, leveraging the consensus among classifiers to improve the learning process. In this study, XGBoost, CatBoost, and Decision Tree are employed as the three classifiers. The training process for the tri-training classification model is depicted in , and the detailed pseudo-code is provided in Supplemental Table S.2. In the initialization step, the algorithm trains each classifier
{1, 2, 3} by using the labeled data set L (i.e.,
). In the pseudo-labeling and consistency check step, the algorithm iteratively trains each classifier
as follows:
Figure 3. Training process of the tri-training classification algorithm.
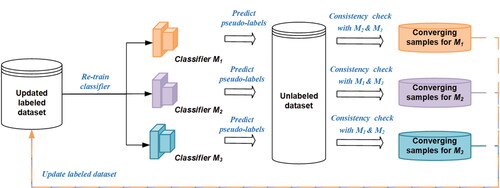
Use
to predict the pseudo-labels (i.e., hierarchical levels) of retailers in U, obtaining a set of pseudo-labeled samples
Select converging samples from
Add
Retrain each classifier
The algorithm repeats the pseudo-labeling and consistency check until all classifiers converge on the same label for every sample
After the algorithm terminates, we can determine the hierarchical level (
) for every food retailer
in the study area.
Third Stage: Validating Model Accuracy. This stage involves validating the accuracy of retailer hierarchical levels classified by the semisupervised classification model. We invited experienced local residents to provide ground truth information for hierarchical levels of a set of retailers according to their knowledge and experiences. The model accuracy of a classifier combination, M, can be calculated as
(6)
(6)
where
is the number of food retailers correctly classified by classifier combination M, and TF is the total number of food retailers validated by local residents. If the validation result is satisfactory, we can terminate the service area delineation process. Otherwise, we should increase the number of representative food retailers and reconduct the service area delineation process. This process continues until satisfactory model results are achieved.
Fourth Stage: Quantifying Influences of Attractiveness Factors. This stage uses the SHAP method (Lundberg and Lee Citation2017) to analyze the importance of attractiveness factors in the hierarchical-level classification. SHAP is a unified interpretative method of attribute importance for machine learning models. It is based on cooperative game theory, specifically the concept of Shapley values, to equitably distribute the contribution of each attribute to the prediction for an input retailer instance. Let be the jth attribute in the feature vector. We use the relative SHAP value (denoted by
) to determine the percentage of an attribute’s marginal contribution to the hierarchical level of a retailer
We first calculate the mean SHAP value (denoted by
), which refers to the average magnitude of the contribution of attribute
to the semisupervised model’s classifications across all samples in the unlabeled data set
The mean SHAP value
can be calculated as:
(7)
(7)
where
is the SHAP value of attribute
to the classification results made by the classifier
for a specific unlabeled sample
and m is the number of food retailers in the data set U. Then, the relative SHAP value
can be calculated as:
(8)
(8)
where p is the total number of attributes used in the classification model. The higher the
value, the larger the contribution to the classification prediction results.
Study Area and Data Collection
Study Area
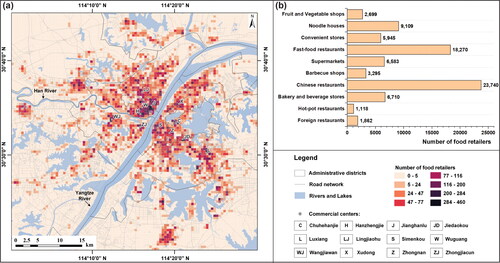
We selected, Wuhan, a megacity in central China, as the study area. As shown in , Wuhan lies in the middle reaches of the Yangtze River at the intersection of the Yangtze and Han Rivers (Y. Wang et al. Citation2018). It covers about 8,594 km2 and has a population of about 11 million. Wuhan is the world’s largest “university town,” with 1.2 million university-level students and eight-five universities or colleges. Wuhan has a polycentric urban structure with twelve commercial centers. The large population and multicenter urban structure result in a wide range of food preferences and foster a diverse food environment in the city. These unique characteristics of Wuhan make it an interesting area for studying food accessibility.
Figure 4. Study area of Wuhan, China.
Data Collection
Three data sets were collected: a big POI data set, a field survey data set, and a transport network data set. The big POI data set was collected from Baidu Map (see https://map.baidu.com) in December 2019. This data set consisted of 79,419 food retailers within ten food categories in Wuhan. shows the spatial distribution and quantity of the collected food retailers in various categories. As can be seen, food retailers were not evenly distributed in the city but rather clustered around twelve commercial centers.
We extracted fifteen attributes for all food retailers. A detailed description of these attributes is summarized in . Reasons for extracting these attributes are given later. According to Dubowitz et al. (Citation2015), residents’ travel distances to food retailers are different among various types, suggesting that the retailer type (namely RetailerType) could be a factor influencing retailers’ service area sizes. As observed by Cannuscio et al. (Citation2013), residents prefer to do primary food shopping at large chain supermarkets with high food quality and prices. We thereby extracted three additional retailer attributes, namely AvgPrice, isChainStore, and RetailerSize. According to the interview reported by Shannon (Citation2016), the accessibility to transport options could affect the residents’ retailer choices. We thus extracted three transport accessibility attributes, namely ParkinglotNum, MetroStationNum, and BusStationNum. Inspired by shopping center studies (Comber et al. Citation2020; Ballantyne et al. Citation2023), we also extracted four build environment attributes: WithinShopCenter, HousingPrice, SimilarRetailerNum, and NearbyRetailerNum. The WithinShopCenter attribute indicates whether the food retailer is located in a large shopping center, which can attract residents from a large distance for multipurpose activity participation including food purchases. The HousingPrice attribute denotes the average price of housing at the location of the food retailer. The NearbyRetailerNum attribute represents the density of food retailers of all types. The SimilarRetailerNum attribute is the number of retailers of the same type. We further extracted four word-of-mouth attributes: UserRating, CommentNum, ImageNum, and isFamousRestaurant. The UserRating attribute is the average user rating of the food retailer. The CommentNum and ImageNum attributes are the number of customers’ comments and images of the food retailer, respectively. The isFamousRestaurant is a binary attribute indicating whether the food retailer is a famous restaurant.
Table 1. Descriptions of 15 attributes of food retailers
The field survey data set was collected through a field survey conducted during January and February 2021 that collected customer travel distance data of eighty-eight representative retailers, which were randomly selected from the POI data set using stratified sampling. The retail types and spatial locations of representative retailers are given in Supplemental Figure S.1. The field survey was conducted by face-to-face interviews using a structured and anonymous questionnaire (questionnaire design was discussed earlier). For each representative retailer, we recruited twenty to thirty respondents who were currently making purchases inside the retail store. We excluded customers under the age of fourteen in the field survey. To express our gratitude for their participation, we gave each respondent a portable shopping bag. Consequently, 1,824 respondents answered our questionnaire. After excluding six questionnaires with missing responses, we obtained 1,818 valid questionnaires for eighty-eight representative retailers. The descriptive statistics for the sex and age attributes of all respondents are given in Supplemental Table S.3. Compared with the general population in Wuhan (Bureau of Statistics of Wuhan Citation2022), we observed that the percentage of women is higher than that of the general population (55.7 percent vs. 48.1 percent), and the percentage of middle-aged people (older than fourteen and younger than sixty years old) is higher than that of the general population (85.8 percent vs. 80.2 percent). These observations are reasonable because middle-aged people—especially middle-aged women—in Wuhan typically take on more food purchasing duties.
The transport network data set was collected to estimate the service areas of food retailer from the threshold
by using the road network distance instead of the Euclidean distance. As shown in Supplemental Figure S.2, the Wuhan road network includes 40,351 nodes and 58,550 links. In the field survey, respondents provided their travel times with different transport modes. To convert them into the travel distance using EquationEquation 5
(5)
(5) , traffic speed data for different transport modes were required. To estimate the road network speed data for private cars and taxis, we collected trajectories of 4,484 taxis during a two-hour period from 13:00 to 15:00 on 9–13 December 2019. The method used in B. Y. Chen et al. (Citation2018) was adopted to estimate mean travel times based on the collected taxi trajectories. Following previous studies (Cherry and Cervero Citation2007; Xing, Liu, and Liu Citation2018), we set the travel speeds for walking, biking, e-biking, bus, and metro modes to be 4, 10, 12, 15, and 30 km/h, respectively.
Model Validation Survey
To validate the model accuracy, we invited fifteen experienced local residents. These residents, who had lived in Wuhan for more than twenty years, were familiar with the food retailers in their communities (see Supplemental Table S.4). We showed them the results of service area sizes and hierarchical levels determined using eighty-eight representative retailers; and then asked them to classify their familiar retailers into hierarchical levels. Consequently, these fifteen residents determined the ground truths of hierarchical levels for 10,028 food retailers, representing about 13 percent of the total food retailers in this study.
Results
Delineation of Service Areas of Food Retailers
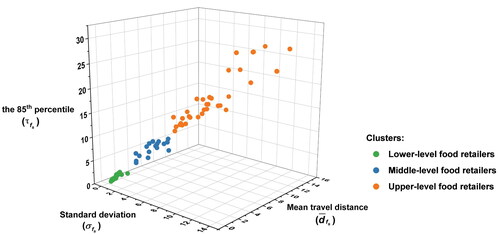
shows the clustering results of eighty-eight representative food retailers collected from the field survey. Each point in Figure 5 represents a representative food retailer. The x, y, and z axes represent standard deviation (), mean travel distance (
), and the 85th percentile (
) of the travel distance distributions (
). As can be seen, three distinctive clusters were determined by the TwoStep Cluster algorithm (see Stage 1 of the proposed method). The largest cluster consists of thirty-six small food retailers, shown in green in Figure 5. These retailers had small values with respect to
and
The second-largest cluster consisted of thirty-four large food retailers, shown in orange in Figure 5, which had large
and
but moderate
The last cluster covered eighteen middle-sized food retailers, shown in blue in Figure 5. Such food retailers had moderate
and
but small
Therefore, eighty-eight representative food retailers were grouped into three distinct hierarchical levels. For convenience, we refer to these three hierarchical levels as lower, middle- and upper level retailers.
Figure 5. Clustering results for eighty-eight representative food retailers in Wuhan.
shows a histogram of the travel distance distribution () for the lower level retailers. This histogram was constructed by merging the travel distances of 730 customers from thirty-six representative lower level food retailers. Using this histogram, we fitted a distance decay function for representative lower level retailers. It was well fitted to the inverse power function of
with
This result of
is consistent with previous observations that the distance decay parameter
is typically between 0.8 and 2.5 (Kwan Citation1998; Dolega, Pavlis, and Singleton Citation2016). With this fitted distance decay function, the service area size threshold
for lower level retailers was determined as 1.0 km.
Figure 6. The calibrated distance decay functions and service area size thresholds for three hierarchical levels: (A) lower level, (B) middle level, and (C) upper level.
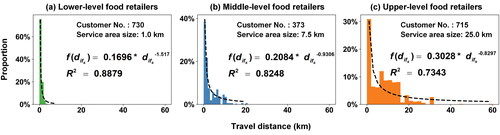
shows a histogram for middle-level retailers. It was constructed by using the travel distances of 373 customers from eighteen representative middle-level retailers. This histogram was well fitted into the inverse power function of with
It can be seen that the distance decay parameter (i.e.,
) was significantly smaller than that of lower level retailers (i.e.,
), indicating a weaker distance decay effect on customer visits to middle-level retailers. Thus, a larger service area size threshold was determined as
km for middle-level retailers.
shows a histogram for upper level retailers. This histogram was given using the travel distances of 715 customers from thirty-four representative upper level food retailers. It was fitted into the inverse power function of with
This fitted distance decay parameter (i.e.,
) was the smallest among those of the three hierarchical levels. This suggests that upper level retailers attract customers from a large area. The largest service area size threshold of
km was obtained for upper level retailers.
The eighty-eight representative food retailers with the determined hierarchical levels were used as the set of labeled samples (L). A semisupervised learning technique (see Stage 2 of the proposed method) was used to classify all 79,419 retailers (including U with 79,331 unlabeled samples) into three hierarchical levels. XGBoost, CatBoost, and Decision Tree were used as the three classifiers in the tri-training classification model used. shows the classification results. As can be seen, the proportions of lower level, middle-level, and upper level retailers account for 93.1 percent, 3.4 percent, and 3.5 percent, respectively. This hierarchical structure of food retailers is consistent with previous findings on shopping center hierarchies, in which shopping centers at higher positions in the hierarchy are fewer in number but have larger service areas (Christaller Citation1933; Dennis, Marsland, and Cockett Citation2002).
Figure 7. Classification of all food retailers into hierarchical levels: (A) spatial distribution of food retailers in a hierarchical structure; (B) proportion of food retailers under various types.
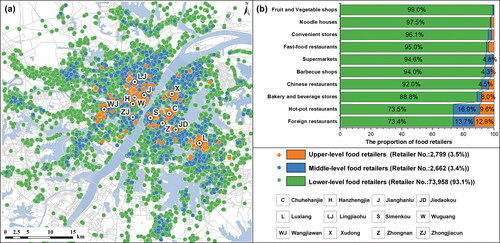
The spatial distributions of retailers in these three levels are given in . The upper level retailers shown in orange were located around twelve commercial centers and transport hubs (e.g., metro stations), whereas middle-level retailers (in blue) were located nearby upper level retailers. Lower level retailers (in green) were distributed throughout the entire urban area. These heterogeneous arrangements of food retailer locations at different hierarchical positions differed from the central place theory, in which shopping centers at every hierarchical level were not clustered at each hierarchical level (Christaller Citation1933; Dennis, Marsland, and Cockett Citation2002). This result highlights the complexities in the spatial arrangement of food retailer hierarchies compared to shopping center hierarchies.
The proportions of retailers in three hierarchical levels for different retailer types are summarized in . Retailers of different types revealed substantial variations in hierarchical levels. For example, foreign restaurants were classified into three hierarchical levels. About 73.4 percent, 13.7 percent, and 12.9 percent of foreign restaurants were classified as lower level, middle-level, and upper level retailers, respectively. About 99 percent of fruit and vegetable shops, however, were classified as lower level retailers, and only 1 percent of shops were classified as middle-level retailers, but no shops were classified as upper level retailers. Foreign restaurants had the largest proportion of upper level retailers, accounting for 12.9 percent. This result also reveals the complexities of food retailer hierarchies with respect to various retailer types.
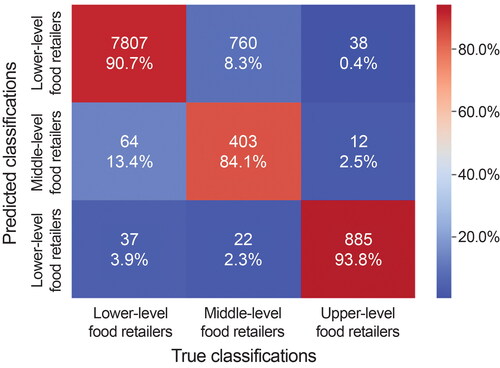
According to the ground truth information about 10,028 food retailers as provided by experienced local residents, the semisupervised learning technique (i.e., the tri-training classification model using XGBoost, CatBoost, and Decision Tree) achieved an overall classification accuracy of 90.7 percent. shows the detailed accuracy confusion matrix. The diagonal elements show the performance of classifying retailers at a specific hierarchical level. Their accuracy for lower level, middle-level, and upper level retailers was 90.7 percent, 84.1 percent, and 93.8 percent, respectively. These results indicated that the approach was sufficiently accurate to classify the hierarchical levels of all food retailers in the whole study area. Therefore, it justifies the first hypothesis made in the proposed method, that food retailers across the entire study area reveal a hierarchical structure. We also tested the robustness of the tri-training classification model by using four other combinations of classifiers. As shown in Supplemental Table S.5, all combinations of three classifiers can achieve a classification accuracy of over 84 percent.
Figure 8. Accuracy confusion matrix of the used semisupervised learning technique.
Attributes Influencing the Hierarchical Level of Retailers
reports the relative importance of fifteen attributes influencing the hierarchical levels of food retailers. This relative importance (i.e., relative SHAP value ) represents the percentage of an attribute’s (
) marginal contribution to the hierarchical level classification in a specific classifier. The higher the relative SHAP value, the greater the contribution of this attribute to the hierarchical-level classification. shows the results for the XGBoost classifier. As shown, the CommentNum attribute contributed the most, with
= 42.2 percent. This was followed by the WithinShopCenter attribute with
= 20.8 percent, the AvgPrice attribute with
= 10.1 percent, the NearbyRetailerNum attribute with
= 6.1 percent, and the BusStationNum attribute with
= 4.9 percent. The top five attributes contributed to 84.1 percent of the total marginal contributions. These were followed by the isFamousRestaurant attribute, with
= 4.4 percent, the UserRating with
= 3.5 percent, the RetailerSize attribute with
= 2.5 percent, the MetroStationNum attribute with
= 1.5 percent, and the HousePrice attribute with
= 1.4 percent. These top ten attributes contributed 97.4 percent of the total marginal contributions.
Figure 9. The relative importance of attributes influencing the hierarchical level of retailers for (A) XGBoost, (B) CatBoost, and (C) Decision Tree.
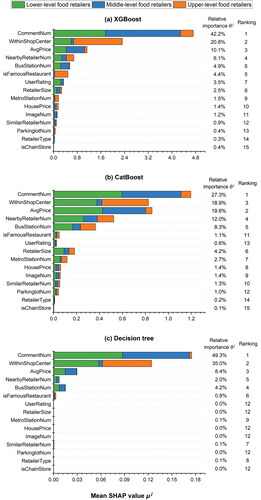
It should be noted that these attributes have significantly different roles in the classification of retailers at different hierarchical levels. For example, the CommentNum attribute contributed percent,
percent, and
percent to determine lower level, middle-level, and upper level retailers, respectively. The relationship
always holds. Focusing on the classification of upper level retailers, the WithinShopCenter attribute is the most influential attribute, with
percent. This result is reasonable, because food retailers within shopping centers tend to attract customers from far away (Dolega, Pavlis, and Singleton Citation2016). The isFamousRestaurant attribute was the second-most influential attribute, with
percent. This result was expected because customers would be willing to travel a long distance to eat at a famous restaurant. The CommentNum attribute was the third-most influential attribute, with
percent. This CommentNum attribute can be interpreted as a type of electronic word-of-mouth contribution to customer food purchases from retailers (Y. Wang, Kim, and Kim Citation2021). A large number of comments posted by customers indicates the popularity of food purchases from upper level retailers. The NearbyRetailerNum attribute is the fourth-most influential attribute, with
percent. A high value for this attribute suggests a food retailer agglomeration effect at that location and enhances the attractiveness of the neighborhood food environment. It was followed by the MetroStationNum attribute, with
percent. This confirms that food retailers with higher accessibility levels to metro stations attract more customers using public transport systems (Shannon Citation2016). These top five attributes were significantly different from previous shopping center studies (Dennis, Marsland, and Cockett Citation2002; Dolega, Pavlis, and Singleton Citation2016; Ballantyne et al. Citation2023), which found shopping center size, retail tenant mix, and the number of leisure outlets, anchor stores, and parking facilities to be key attractiveness factors to determine shopping center hierarchies.
shows the relative importance of the fifteen attributes for the CatBoost classifier. The CommentNum attribute was the most influential attribute, with percent. It was followed by the AvgPrice attribute with
percent, the WithinShopCenter with
percent, the NearbyRetailerNum attribute with
percent, and the BusStationNum attribute with
percent. These top five attributes contributed to 86.1 percent of the total marginal contributions. They were followed by the RetailerSize attribute with
percent, the MetroStationNum attribute with
percent, the HousePrice attribute with
percent, the ImageNum attribute with
percent, and the SimilarRetailerNum attribute with
percent. These top ten attributes contributed to 97.0 percent of the total marginal contributions. We observed that the relative importance values of these top five and ten attributes were different from those of the XGBoost classifier. This observation is common in the tri-training classification model. We found that both the CatBoost and XGBoost classifiers shared the same top five attributes, however.
shows the relative importance of the fifteen attributes for the Decision Tree classifier. The CommentNum attribute was the most influential attribute, with percent. It was followed by WithinShopCenter with
percent, the AvgPrice attribute with
percent, the BusStationNum attribute with
percent, and the NearbyRetailerNum attribute with
percent. These top five attributes contributed to 98.9 percent of the total marginal contributions. The other ten attributes contributed to only 1.1 percent of the total marginal contributions. As can be seen, the difference between this classifier and XGBoost was more obvious. They still share the same top five attributes, however. The consistency of three classifiers and the reported satisfactory classification accuracy (i.e., 90.7 percent) suggest that these fifteen attributes were effective for classifying hierarchical levels of food retailers. Therefore, these results justify the second hypothesis made in the proposed method, that the hierarchical level of a food retailer can be determined by its attractiveness factors.
Impact of the Hierarchical Structure of Retailers on Food Accessibility
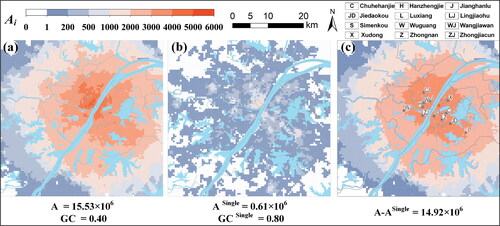
shows the spatial distribution of food accessibility () using different service area size thresholds (
) for retailers in three distinctive hierarchical levels. Specifically, we set
km for 73,958 lower level retailers,
km for 2,662 middle-level retailers, and
km for 2,799 upper level retailers (see and ). As shown, food accessibility was not evenly distributed in the study area. Rather, it displayed a concentric pattern. Distinctive peaks (
) were found in areas near four commercial centers on both sides of the Yangtze River: Wugang, Zhongjiacun, Shimengkou, and Xudong. Food accessibility decreased with the distance to peaks, and troughs were found in the suburban areas. The Gini coefficient for food accessibility was
indicating noticeable spatial inequality in food accessibility of different regions in Wuhan. The total accessibility provided by retailers in the three hierarchical levels was
Figure 10. The impacts of retailer hierarchy on food accessibility: (A) food accessibility using three hierarchical levels of service area sizes; (B) food accessibility using a single level of service area sizes; and (C) accessibility difference between the hierarchical and single level of service area sizes.
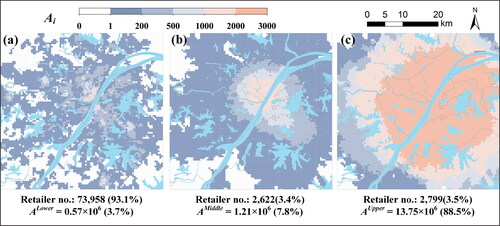
reports the food accessibility provided by retailers of each hierarchical level. The food accessibility at location i provided by lower level, middle-level, and upper level retailers is denoted by
and
respectively. The relationship
always holds. shows the food accessibility provided by lower level retailers (i.e.,
). As shown, a low level of accessibility (i.e.,
) was observed for most regions, with a moderate level of accessibility (i.e.,
) in small areas near the four commercial centers. The total accessibility provided by the lower level retailers for the whole study area was
which is only 3.7 percent of the total accessibility provided by all retailers in three hierarchical levels. This suggests that lower level retailers make only minor contributions to food accessibility in Wuhan, although the number of lower level retailers was very large, accounting for 92.8 percent of all retailers in Wuhan.
Figure 11. Food accessibility provided by retailers in three hierarchical levels: (A) lower level; (B) middle level; and (C) upper level.
gives the food accessibility provided by middle-level retailers (i.e., ). A moderate level of accessibility (i.e.,
) was observed for areas near both sides of the Yangtze River. The total accessibility provided by the middle-level retailers for the whole study area was
accounting for 7.8 percent of the total accessibility provided by all retailers in the three hierarchical levels. This indicates that the contributions of these middle-level retailers to food accessibility in Wuhan were significant, given that the number of middle-level retailers was only 3.4 percent of all retailers.
shows food accessibility provided by upper level retailers (i.e., ). A high level of food accessibility (i.e.,
) was provided by upper level retailers for a large area in Wuhan. The total accessibility provided by upper level retailers was
accounting for 88.5 percent of all food accessibility provided by all retailers in the three hierarchical levels. This highlights the critical role of upper level retailers in determining food accessibility in Wuhan, given that upper level retailers comprise only 3.5 percent of all retailers in Wuhan. Therefore, middle-level and upper level retailers accounted for only 6.9 percent of total retailers, yet contributed to 96.3 percent of food accessibility.
shows the food accessibility using a single service area size for all retailers in Wuhan, denoted by Specifically, we set the hierarchical level of all retailers to the local level, and the service area size threshold of all retailers was set to 1.0 km. This setting ignored the hierarchical structure of food retailers, as in most previous food accessibility studies (Jiao et al. Citation2012; H. Wang and Qiu Citation2016; Rybarczyk et al. Citation2020). It can be seen that accessibility
had a similar spatial pattern to accessibility
shown in . This result is reasonable. Using a single service area size, the total food accessibility was
In this case, the total accessibility provided by lower level retailers was still
accounting for 93.4 percent of
Due to the reduced size of service areas, the total accessibility provided by middle-level and upper level retailers was significantly underestimated (by 99.7 percent) from
to
which accounted for only 6.6 percent of
Therefore, using a single service area size significantly underestimates the contributions of middle-level and upper level retailers to the total accessibility in Wuhan.
shows the accessibility difference between hierarchical and single-level service area sizes (i.e., ). This difference reveals the degree of accessibility underestimations in different regions caused by using a single level instead of hierarchical levels of service area sizes. As shown, serious underestimations of food accessibility were found for a large region in Wuhan, especially in the areas near the twelve commercial centers. This result is obvious, due to the reduction in accessibility provided by middle-level and upper level retailers in these areas. Such accessibility reductions can lead to overestimations of the spatial inequality of food accessibility. Comparing ,
for
twice as high as
for
This result underlines the high level of food accessibility provided by middle-level and upper level retailers, which contributes to a more equitable and sustainable distribution of food accessibility in different regions across the whole study area in Wuhan.
Discussion and Conclusions
In this study, we proposed a machine learning method to delineate service areas and hierarchical levels of all food retailers in a large study area. The developed method made full use of unsupervised learning, semisupervised learning, and SHAP techniques. The unsupervised learning technique used small-scale field survey data to delineate service area sizes and hierarchical levels for a few representative retailers (as labeled samples). Other retailers were regarded as unlabeled samples. Fifteen attributes were extracted from the big POI data set for all labeled and unlabeled samples. The semisupervised learning algorithm (i.e., the tri-training classification model using XGBoost, CatBoost, and Decision Tree) was applied to classify hierarchical levels of all food retailers by integrating both labeled and unlabeled samples. The SHAP technique was used to quantify the relative importance of fifteen attributes in determining retailer hierarchical levels. Using these techniques, the proposed method can not only delineate service area sizes and hierarchical levels of food retailers but also quantify how fifteen attributes influence retailer hierarchical levels. The results of our case study showed that the proposed method can achieve satisfactory accuracy (i.e., 90.7 percent) when classifying the hierarchical levels of 79,419 food retailers in Wuhan. Therefore, this study advanced existing service area delineation methods (Dennis, Marsland, and Cockett Citation2002; Drezner Citation2006; Dolega, Pavlis, and Singleton Citation2016) by developing a powerful machine learning method.
Using the proposed method, a comprehensive case study was carried out in Wuhan, to examine the impacts of retailer hierarchy on food accessibility. The results of the case study provided several empirical insights into food accessibility studies. First, this study uncovered how food retailers in a large study area organized into a hierarchical structure. Using field surveys on a small set of representative samples, several previous studies observed the heterogeneity of residents’ travel distances to various types of food retailers (Hillier et al. Citation2011; Dubowitz et al. Citation2015; Liu, Han, and Cohen Citation2015; Shannon Citation2016). This study extended previous studies by delineating service area sizes and hierarchical levels for all food retailers (i.e., 79,419) in a metropolitan area. Along the line of central place theory (i.e., hierarchical structure of shopping centers), this study found that food retailers in Wuhan revealed distinct hierarchical structure with respect to three hierarchical levels, namely lower, middle, and upper levels. Lower level retailers have a large number of entities (i.e., 73,958) but a small service area (i.e., ). Middle-level retailers have only a few entities (i.e., 2,622) but a large service area (i.e.,
). Upper level retailers also have a few entities (i.e., 2,799) but the largest service area (i.e.,
). Diverging from classical central place theory, this study found that food retailers of various hierarchical levels in Wuhan have different spatial distribution patterns. Upper level retailers tend to cluster at commercial centers and transport hubs. Middle-level retailers are located near upper level retailers, and lower level retailers are distributed across the entire urban area. Therefore, these findings deepen our understanding of the heterogeneity of food retailers in a large metropolitan area.
Second, this study quantified how residents’ retailer choice preferences (i.e., attractiveness factors) determine the hierarchical levels of food retailers. Previous studies using field interviews of selective residents observed that several attractiveness factors influenced residents’ retailer choice decisions (Cannuscio et al. Citation2013; Shannon Citation2016; Hillier et al. Citation2017). Unlike the previous qualitative studies, this study employed semisupervised classification and SHAP techniques to quantify the relative importance of fifteen attractiveness factors determining the hierarchical levels of food retailers. The results of this study found that word-of-mouth attributes (e.g., CommentNum), built environment characteristics (e.g., WithinShopCenter and NearbyRetailerNum), retailer characteristics (e.g., AvgPrice), and transport accessibility indicators (e.g., BusStationNum) could well explain the hierarchical levels of food retailers with a classification accuracy over 90.7 percent. Therefore, these findings enrich our understanding of how residents’ retailer choice preferences determine the service area sizes of various food retailers.
Third, this study uncovered how retailer hierarchy shapes food accessibility. Most existing food accessibility studies only considered the proximity factor in residents’ food retailer choice decisions; for example, setting a single service area size of one mile to all food retailers (Jiao et al. Citation2012; H. Wang and Qiu Citation2016; Rybarczyk et al. Citation2020). As an extension to previous studies, this study explicitly incorporated the hierarchical structure of food retailers into food accessibility evaluation. The results of this study found that retailers at higher positions within the food retailer hierarchy dominated food accessibility throughout the study area. Lower level retailers accounted for 93.1 percent of total retailers but contributed to only 3.7 percent of total accessibility. By contrast, middle- and upper level retailers accounted for only 6.9 percent of total retailers but contributed to 96.3 percent of total accessibility. Using a single service area size of lower level retailers to all food retailers can significantly underestimate overall food accessibility (by 96 percent) and overestimate the Gini coefficient of food accessibility (by 100 percent). Therefore, these findings highlight the significant impacts of retailer hierarchy on food accessibility patterns across the whole study area.
The results of this study have several important implications for developing sustainable food policies. Planners and policymakers should be aware of the complexities of residents’ retailer choice behaviors in their food policy decision-making. The results of this study clearly revealed that residents make food retailer choices by considering not only retailer proximity but also a set of attractiveness factors, including retailer characteristics, word-of-mouth attributes, built environment characteristics, and transport accessibility levels. These complexities of residents’ retailer choice behaviors can lead to heterogeneous service area sizes of various food retailers. Ignoring such complexities in residents’ retailer choice behaviors can introduce considerable bias in food accessibility evaluations and related policy decision-making. In addition, planners and policymakers should be aware of the hierarchical structure of various food retailers in the study area. Apart from building new food retailers, the provision of healthy foods by retailers at higher hierarchical positions is an effective way to promote equitable and healthy food accessibility. Food retailers at higher hierarchical positions have a larger service area size. The availability of healthy foods at these retailers provides access to healthy foods to residents from farther away, and thus promotes more equitable accessibility to residents across a large area. Further, planners and policymakers should pay attention to the dominant role of a few retailers in higher hierarchical positions in determining overall food accessibility. A higher standard of food quality control should be given to these key retailers in higher hierarchical positions. Healthy and affordable food options from such retailers can significantly improve healthy food accessibility for most residents in the study area.
There are several fruitful directions for future research. First, this study conducted field surveys to collect customers’ food purchase trips for only eighty-eight representative food retailers as labeled samples used in the semisupervised classification technique, and achieved a high classification accuracy of 90.7 percent. The increase in labeled sample size could further improve the accuracy of semisupervised classification. How to use emerging mobility big data to extract food purchase trips to various food retailers needs further investigation. Second, this study investigated the total accessibility to all types of food retailers. We did not differentiate accessibility by food categories, for example, healthy foods and unhealthy foods (Lytle and Sokol Citation2017). Future studies, therefore, should evaluate the accessibility to different categories of foods by considering the food retailer hierarchy. Third, we evaluated food accessibility by following a place-based accessibility evaluation framework (Y. Wang et al. Citation2018). This ignored individual characteristics, such as income, mobility, and other personal needs. It is worth investigating individual-based accessibility to food retailers by considering individual characteristics and everyday activity behaviors (X. Chen and Kwan Citation2015). Last but not least, the proposed machine learning method was applied to determine the service areas and hierarchical positions of food retailers. Applying it to other service facilities with hierarchical structures (e.g., shopping centers and hospitals) is another interesting topic for future studies.
Supplemental Material
Download Zip (14 MB)Disclosure Statement
No potential conflict of interest was reported by the author(s).
Supplemental Material
Supplemental data for this article can be accessed on the publisher’s site at: https://doi.org/10.1080/24694452.2023.2294892
Additional information
Funding
Notes on contributors
Bi Yu Chen
BI YU CHEN is a Professor in the State Key Laboratory of Information Engineering in Surveying, Mapping and Remote Sensing, Wuhan University, Wuhan 430079, China. E-mail: [email protected]. His research interests include geographical information systems for transportation, transport geography, behavioral geography, and spatiotemporal big data analytics.
Chenxi Fu
CHENXI FU is a PhD Student in the State Key Laboratory of Information Engineering in Surveying, Mapping and Remote Sensing, Wuhan University, Wuhan 430079, China. E-mail: [email protected]. Her research interests include healthy geography, behavioral geography, and spatiotemporal big data analytics.
Donggen Wang
DONGGEN WANG is Chair Professor and Head of the Department of Geography, Hong Kong Baptist University, Kowloon Tong, Kowloon, Hong Kong. He is also the Director of the Center for China Urban and Regional Studies (CURS). E-mail: [email protected]. His major research interests span the built environment and travel behavior, sociospatial segregation, and geography of health and well-being.
Tao Jia
TAO JIA is an Associate Professor with the School of Remote Sensing and Information Engineering, Wuhan University, Wuhan 430079, China. E-mail: [email protected]. His research interests include geographical information science in general, and spatiotemporal data mining, complex network analysis and modeling, intelligent transportation systems, and human dynamics in particular.
Jianya Gong
JIANYA GONG is a Professor at Wuhan University and also an academician of the Chinese Academy of Science, Wuhan 430079, China. E-mail: [email protected]. His research interests include photogrammetry, remote sensing, geospatial data modeling, and geographical information systems.
References
- An, R., L. He, and M. S. J. Shen. 2020. Impact of neighbourhood food environment on diet and obesity in China: A systematic review. Public Health Nutrition 23 (3):457–73. doi: 10.1017/S1368980019002167.
- Applebaum, W., and S. B. Cohen. 1961. The dynamics of store trading areas and market equilibrium. Annals of the Association of American Geographers 51 (1):73–101. doi: 10.1111/j.1467-8306.1961.tb00369.x.
- Ballantyne, P., A. Singleton, L. Dolega, and J. Macdonald. 2023. Integrating the who, what, and where of U.S. retail center geographies. Annals of the American Association of Geographers 113 (2):488–510. doi: 10.1080/24694452.2022.2098087.
- Bureau of Statistics of Wuhan. 2022. 2020 Wuhan Statistical Yearbook. Accessed October 8, 2022. https://tjj.wuhan.gov.cn/tjfw/tjnj/202102/t20210202_1624445.shtml.
- Cannuscio, C. C., K. Tappe, A. Hillier, A. Buttenheim, A. Karpyn, and K. Glanz. 2013. Urban food environments and residents’ shopping behaviors. American Journal of Preventive Medicine 45 (5):606–14. doi: 10.1016/j.amepre.2013.06.021.
- Caspi, C. E., G. Sorensen, S. V. Subramanian, and I. Kawachi. 2012. The local food environment and diet: A systematic review. Health & Place 18 (5):1172–87. doi: 10.1016/j.healthplace.2012.05.006.
- Chen, B. Y., X.-P. Cheng, M.-P. Kwan, and T. Schwanen. 2020. Evaluating spatial accessibility to healthcare services under travel time uncertainty: A reliability-based floating catchment area approach. Journal of Transport Geography 87:102794. doi: 10.1016/j.jtrangeo.2020.102794.
- Chen, B. Y., Y. Wang, D. Wang, Q. Li, W. H. K. Lam, and S.-L. Shaw. 2018. Understanding the impacts of human mobility on accessibility using massive mobile phone tracking data. Annals of the American Association of Geographers 108 (4):1115–33. doi: 10.1080/24694452.2017.1411244.
- Chen, X., and M.-P. Kwan. 2015. Contextual uncertainties, human mobility, and perceived food environment: The uncertain geographic context problem in food access research. American Journal of Public Health 105 (9):1734–37. doi: 10.2105/AJPH.2015.302792.
- Cherry, C., and R. Cervero. 2007. Use characteristics and mode choice behavior of electric bike users in China. Transport Policy 14 (3):247–57. doi: 10.1016/j.tranpol.2007.02.005.
- Christaller, W. 1933. Central places in southern Germany. Englewood Cliffs, NJ: Prentice-Hall.
- Comber, S., D. Arribas-Bel, A. Singleton, G. Dong, and L. Dolega. 2020. Building hierarchies of retail centers using Bayesian multilevel models. Annals of the American Association of Geographers 110 (4):1150–73. doi: 10.1080/24694452.2019.1667219.
- Cummins, S., E. Flint, and S. A. Matthews. 2014. New neighborhood grocery store increased awareness of food access but did not alter dietary habits or obesity. Health Affairs (Project Hope) 33 (2):283–91. doi: 10.1377/hlthaff.2013.0512.
- Dennis, C., D. Marsland, and T. Cockett. 2002. Central place practice: Shopping centre attractiveness measures, hinterland boundaries and the UK retail hierarchy. Journal of Retailing and Consumer Services 9 (4):185–99. doi: 10.1016/S0969-6989(01)00021-2.
- Dolega, L., M. Pavlis, and A. Singleton. 2016. Estimating attractiveness, hierarchy and catchment area extents for a national set of retail centre agglomerations. Journal of Retailing and Consumer Services 28:78–90. doi: 10.1016/j.jretconser.2015.08.013.
- Drezner, T. 2006. Derived attractiveness of shopping malls. IMA Journal of Management Mathematics 17 (4):349–58. doi: 10.1093/imaman/dpl004.
- Dubowitz, T., S. N. Zenk, B. Ghosh-Dastidar, D. A. Cohen, R. Beckman, G. Hunter, E. D. Steiner, and R. L. Collins. 2015. Healthy food access for urban food desert residents: Examination of the food environment, food purchasing practices, diet and BMI. Public Health Nutrition 18 (12):2220–30. doi: 10.1017/S1368980014002742.
- Hillier, A., C. C. Cannuscio, A. Karpyn, J. McLaughlin, M. Chilton, and K. Glanz. 2011. How far do low-income parents travel to shop for food? Empirical evidence from two urban neighborhoods. Urban Geography 32 (5):712–29. doi: 10.2747/0272-3638.32.5.712.
- Hillier, A., T. E. Smith, E. D. Whiteman, and B. W. Chrisinger. 2017. Discrete choice model of food store trips using national household food acquisition and purchase survey (FoodAPS). International Journal of Environmental Research and Public Health 14 (10):1133. doi: 10.3390/ijerph14101133.
- Huff, D. L. 1964. Defining and estimating a trade area. Journal of Marketing 28 (3):34–38. doi: 10.1177/002224296402800307.
- Jiao, J., A. V. Moudon, J. Ulmer, P. M. Hurvitz, and A. Drewnowski. 2012. How to identify food deserts: Measuring physical and economic access to supermarkets in King County, Washington. American Journal of Public Health 102 (10):e32–e39. doi: 10.2105/AJPH.2012.300675.
- Kwan, M. P. 1998. Space-time and integral measures of individual accessibility: A comparative analysis using a point-based framework. Geographical Analysis 30 (3):191–216. doi: 10.1111/j.1538-4632.1998.tb00396.x.
- Li, L., and D. Wang. 2022. Do neighborhood food environments matter for eating through online-to-offline food delivery services? Applied Geography 138:102620. doi: 10.1016/j.apgeog.2021.102620.
- Liu, J. L., B. Han, and D. A. Cohen. 2015. Beyond neighborhood food environments: Distance traveled to food establishments in 5 US cities, 2009–2011. Preventing Chronic Disease 12:E126. doi: 10.5888/pcd12.150065.
- Lundberg, S. M., and S.-I. Lee. 2017. A unified approach to interpreting model predictions. In Advances in Neural Information Processing Systems 30, ed. I. Guyon, U. V. Luxburg, S. Bengio, H. Wallach, R. Fergus, S. Vishwanathan, and R. Garnett, 4768–77. Long Beach, CA: Curran Associates, Inc.
- Lytle, L. A., and R. L. Sokol. 2017. Measures of the food environment: A systematic review of the field, 2007–2015. Health & Place 44:18–34. doi: 10.1016/j.healthplace.2016.12.007.
- Maimaiti, M., X. Ma, X. Zhao, M. Jia, J. Li, M. Yang, Y. Ru, F. Yang, N. Wang, and S. Zhu. 2019. Multiplicity and complexity of food environment in China: Full-scale field census of food outlets in a typical district. European Journal of Clinical Nutrition 74 (3):397–408. doi: 10.1038/s41430-019-0462-5.
- Neuhouser, M. L. 2019. The importance of healthy dietary patterns in chronic disease prevention. Nutrition Research 70:3–6. doi: 10.1016/j.nutres.2018.06.002.
- Qi, G. J., and J. Luo. 2020. Small data challenges in big data era: A survey of recent progress on unsupervised and semi-supervised methods. IEEE Transactions on Pattern Analysis and Machine Intelligence 44 (4):2168–87. doi: 10.1109/TPAMI.2020.3031898.
- Reed, M. P., R. Buckmaster, and R. Reed. 2018. The contribution of GIS to understanding retail property. In Real estate and GIS, ed. R. Reed and C. Petit, 65–79. London and New York: Routledge.
- Reimers, V., and V. Clulow. 2009. Retail centres: It’s time to make them convenient. International Journal of Retail & Distribution Management 37 (7):541–62. doi: 10.1108/09590550910964594.
- Russell, S. E., and C. P. Heidkamp. 2011. “Food desertification”: The loss of a major supermarket in New Haven, Connecticut. Applied Geography 31 (4):1197–1209. doi: 10.1016/j.apgeog.2011.01.010.
- Rybarczyk, G., D. Taylor, S. Brines, and R. Wetzel. 2020. A geospatial analysis of access to ethnic food retailers in two Michigan cities: Investigating the importance of outlet type within active travel neighborhoods. International Journal of Environmental Research and Public Health 17 (1):166. doi: 10.3390/ijerph17010166.
- Scharadin, B., M. Ver Ploeg, and C. Dicken. 2022. Geographic boundary definitions and the robustness of common food retail environment measures. Annals of the American Association of Geographers 112 (5):1403–23. doi: 10.1080/24694452.2021.1977109.
- Shannon, J. 2016. Beyond the supermarket solution: Linking food deserts, neighborhood context, and everyday mobility. Annals of the American Association of Geographers 106 (1):186–202. doi: 10.1080/00045608.2015.1095059.
- Smith, L. G., M. J. Widener, B. Liu, S. Farber, L. M. Minaker, Z. Patterson, K. Larsen, and J. Gilliland. 2022. Comparing household and individual measures of access through a food environment lens: What household food opportunities are missed when measuring access to food retail at the individual level? Annals of the American Association of Geographers 112 (2):542–62. doi: 10.1080/24694452.2021.1930513.
- Tkaczynski, A. 2017. Segmentation using two-step cluster analysis. In Segmentation in social marketing: Process, methods and application, ed. T. Dietrich, S. Rundle-Thiele, and K. Kubacki, 109–25. Singapore: Springer Singapore.
- Townshend, T., and A. A. Lake. 2009. Obesogenic urban form: Theory, policy and practice. Health & Place 15 (4):909–16. doi: 10.1016/j.healthplace.2008.12.002.
- Wang, H., and F. Qiu. 2016. Fresh food access revisited. Cities 51:64–73. doi: 10.1016/j.cities.2015.11.026.
- Wang, Y., B. Y. Chen, H. Yuan, D. Wang, W. H. K. Lam, and Q. Li. 2018. Measuring temporal variation of location-based accessibility using space-time utility perspective. Journal of Transport Geography 73:13–24. doi: 10.1016/j.jtrangeo.2018.10.002.
- Wang, Y., J. Kim, and J. Kim. 2021. The financial impact of online customer reviews in the restaurant industry: A moderating effect of brand equity. International Journal of Hospitality Management 95:102895. doi: 10.1016/j.ijhm.2021.102895.
- Xing, L., Y. Liu, and X. Liu. 2018. Measuring spatial disparity in accessibility with a multi-mode method based on park green spaces classification in Wuhan, China. Applied Geography 94:251–61. doi: 10.1016/j.apgeog.2018.03.014.
- Yue, Y., H.-D. Wang, B. Hu, Q. Li, Y.-G. Li, and A. G. O. Yeh. 2012. Exploratory calibration of a spatial interaction model using taxi GPS trajectories. Computers, Environment and Urban Systems 36 (2):140–53. doi: 10.1016/j.compenvurbsys.2011.09.002.
- Zhou, Z.-H., and M. Li. 2005. Tri-training: Exploiting unlabeled data using three classifiers. IEEE Transactions on Knowledge and Data Engineering 17 (11):1529–41.