
Abstract
Swimming performance is important for fish migration, habitat selection, and predator-prey interaction, as well as for fish passage design. Procedural choices made when experimentally estimating it may influence the results. Systematic experiments were conducted to study the effect of different in-flume habituation times, habituation behaviour, and the use of external encouragement on burst swimming performance of Rutilus aula, a small-sized cyprinid, in a fixed velocity testing protocol. Increasing habituation times from 30 s to 5 or 20 min substantially increased the success proportion of swimming trials and estimated fish swimming performance, with no difference between the latter two habituation times. Fish resting on the downstream grid before the start of testing velocity outperformed those who swam during habituation and transition periods. Fish swimming volitionally in response to flow at testing velocity showed a significantly improved performance compared to fish motivated by external poking. The results of this study highlight that in-flume habituation time is important, and fish behaviour before actual testing may influence the outcomes of swimming performance results.
Introduction
Swimming performance is important for fish migration, habitat selection, and predator-prey interaction, as well as for fish passage design (Castro-Santos Citation2002; Domenici and Blake Citation1997; Katopodis and Gervais Citation2012; Peake et al. Citation1997b; Tudorache et al. Citation2008; Watson et al. Citation2019). Typically, fish swimming is categorized into three modes: sustained, prolonged, and burst (Beamish Citation1978; Hammer Citation1995). Although several techniques and devices provide fish swimming performance metrics (Katopodis et al. Citation2019), commonly, laboratory studies are carried out using one of the two testing methodologies: increasing velocity or fixed velocity method (Brett Citation1964; Hammer Citation1995). In the former, a fish is forced to swim at a regularly increasing flow velocity with fixed incremental time until fatigued. In the latter, a fish is forced to swim at a fixed velocity until fatigued. Both methods have been widely used in the literature and provide information about fish performance to inform both ecological theory and fisheries management, with particular focus on the design of fish passage structures (Brett Citation1964; Deslauriers and Kieffer Citation2012; Farrell et al. Citation2003; Hammer Citation1995; Mu et al. Citation2019; Schiavon et al. Citation2023).
Despite the wide application of fish swimming tests, significant variations in testing protocols and nomenclature are found in the scientific literature. One such example is the use of different and rather arbitrary habituation periods. In the swimming performance literature this is the time fish are allowed to adjust to experimental conditions before testing begins, and more often is referred to as “acclimation period (or time)”, “conditioning period”, “settling period” or “recovery period (or time)” (Jones et al. Citation1974; Myrick and Cech Citation2000; Nikora et al. Citation2003; Penghan et al. Citation2016; Silva et al. Citation2012; Tudorache et al. Citation2007). Time allotted to habituation varies enormously among studies, typically without empirical support: 5 mins (Louison et al. Citation2019; Schiavon et al. Citation2023), 10 mins (Nikora et al. Citation2003; Plew et al. Citation2007), 15 mins (Lupandin Citation2005), 30 mins (Deslauriers and Kieffer Citation2011), 1 h (Myrick and Cech Citation2000; Palstra et al. Citation2020; Silva et al. Citation2021), 11 h (Tritico and Cotel Citation2010), 12 h (Silva et al. Citation2011), and overnight habituation (Hvas and Oppedal Citation2019; Tudorache et al. Citation2008). While such a wide variation of the habituation time may stem from the different study objectives, the choices made appear to be rather arbitrarily taken and rarely supported by either robust arguments or empirical evidence. Jones et al. (Citation1974) studied the effect of 1, 2, 12, and 16 h habituation times at a water velocity of 10 cm/s on Arctic grayling Thymallus arcticus and Longnose suckers Catostomus catostomus and found no significant difference in critical swimming speed among different habituation times. Similarly, Peake et al. (Citation1997a) conducted a study on juvenile Rainbow trout Oncorhynchus mykiss and found no significant difference in the average critical swimming speed when tested at 6 °C and 18 °C after different habituation times of 0, 0.5, 1, 2, 4, 8, and 16 h at a flow velocity of 26.5 cm/s. Long habituation times can significantly increase the overall duration of the experimental study, and this could create potential confounding effects related to fish physiology and ontogeny changing over time. Furthermore, a longer study duration requires increased costs, leading towards a trade-off with sample size. These elements cause many researchers optioning for short habituation times (Hvas and Oppedal Citation2019; Louison et al. Citation2019; Lupandin Citation2005; Plew et al. Citation2007). Despite their widespread use, however, studies on the effects of short habituation times are apparently lacking in the literature.
Fish behaviour during the habituation time may affect swimming performance, and is sometimes used as a criterion for inclusion in performance studies (Heuer et al. Citation2021). During the habituation period, fish may, for example, rest on the downstream grid or actively explore the flume. Although often not reported, in some experiments, non-cooperative fish are subject to exclusion or physical encouragement using subjective criteria. While Quintella et al. (Citation2010) excluded the fish that showed signs of stress and poor swimming behavior, i.e. moving back and forth in the swim chamber, other research studies have also reported exclusion criteria where a fish was unable to orient to the flow (Myrick and Cech Citation2000; Nikora et al. Citation2003), refused to swim at all (Santos et al. Citation2007), or declined to leave the net (which was being used to handle the fish) (Shiau et al. Citation2020). Sometimes, encouragements such as electric shocks are also used to prevent the fish from resting on the rear of the swim chamber during habituation period before their exclusion (Stevens Citation1979).
The transition period between habituation velocity and testing velocity is another integral part of increasing and fixed velocity tests. Energy spent under the transition between habituation and increasing velocity test, is likely to affect swimming performance (Videler Citation1993) but is often not described or glossed over in the fish swimming literature. Some studies have reported very short transition times of less than 2 and up to 5 s (Deslauriers and Kieffer Citation2011, Citation2012; Nikora et al. Citation2003; Plew et al. Citation2007). Although theoretically it may seem straightforward to minimize the swimming time and conserve energy spent during transition, fast transitions are not always possible (e.g. due to behavioural or logistic constraints). However, although typically ignored or deemed insignificant, it is unclear to what extent the behaviour of fish during the transition time affect the measured performance.
Physical tapping is often used to encourage the fish to swim during the swimming trials (Aedo et al. Citation2021; Karlsson-Drangsholt et al. Citation2018; Nikora et al. Citation2003; Plew et al. Citation2007; Schiavon et al. Citation2023). Alternatively the use of electric shocks is also a frequently found method in the literature to prevent fish from resting on the downstream grid (Brett Citation1967; Farrell et al. Citation1990; Romão et al. Citation2012; Silva et al. Citation2021; Van Den Thillart et al. Citation2004; Webb et al. Citation1984). Motivation, however, is important for fish swimming performance (Goerig and Castro-Santos Citation2017; Videler Citation1993), and fish actively choosing to enter a swimming trial, in volitional swimming tests, sometimes outperform forced swimmers (Castro-Santos et al. Citation2013; Peake Citation2008b). Surprisingly, in forced performance tests, the difference in swimming performance between fish swimming voluntarily and fish that are encouraged (forced) to swim is still unexplored in the published literature.
In this study, we investigate potential effects of the fish swimming testing protocol on the estimated swimming performance. The goal of this study is to elucidate the effects on time to fatigue of: (1) three different, relatively short, in-flume habituation times; (2) fish behaviour during habituation; and (3) external stimuli to provoke swimming (poking). We hypothesize that time to fatigue increases with: increasing habituation time, active swimming during habituation period, and the use of external stimuli to provoke swimming. Systematic experiments were conducted using a fixed velocity testing protocol on Rutilus aula, a small-sized riverine Cyprinid (Fortini Citation2016).
Materials and methods
Fish
Juvenile R. aula with an average fork length of 5.19 cm (S.D. ± 0.37 cm) and average mass of 1.79 g (S.D. ± 0.44 g) were captured from the Orba stream in the Province of Alessandria, Italy (44°45′46.7″N 8°40′15.6″E) using electrofishing on January 30, 2023. The fish were brought to the hatchery facility in Predosa, Alessandria, Italy and were left to habituate to hatchery conditions in a spring-fed flow-through tank. After three days from their capture date, a random subset of fish was tested in a separate experimental campaign in the hatchery, and then returned to the holding tank. All fish rested at least 4 days before testing. The water temperature in the tank was measured by a HOBO MX-2202 logger at regular intervals of 10 mins, with a mean temperature of 11.82 °C (S.D. ± 0.3 °C). The fish were fed commercial aquaria fish pellets (Tetra TabiMin) but were starved 24 h before the experiments to ensure a post-absorptive state. The fish remained healthy looking throughout and after the 3 days experimental campaign, displaying active swimming behaviour, and no fish mortality was observed. The study was conducted in accordance with the Ufficio Tecnico Faunistico e Ittiofauna of the Provincia di Alessandria (permit number 1570, issued on 19th January 2023), under the provisions of art.2 of the national Decree n.26/2014 (implementation of Dir. 2010/63/EU).
Flume description
Experiments were carried out using a hydraulic flume whose channel is 280 cm long and has a 30 cm by 30 cm rectangular cross section. A pump allows for water recirculation from a small upstream tank, through the channel to a 600 L downstream tank, which is connected back to the upstream tank via a 8.5 cm diameter stainless steel pipe (see ). Flow rate was monitored using a AquaTransTM AT600 flow meter sensor and controlled by means of an inverter (DGFIT MT 12) and a flow opening valve located at the pump outlet. A flow straightener located 75 cm from the channel inlet was employed to damp the intensity of turbulence generated by the pump. The swimming arena utilized for the tests was 80 cm long and was bounded upstream by the flow straightener and downstream by a net grid. For all the experiments the flow depth was kept at 7.5 cm. Hydrodynamic conditions were carefully assessed using advanced laser diagnostics (i.e. Laser Doppler Anemometry), which revealed that flow conditions were nicely uniform along the spanwise direction and that the flow straightener generated turbulence whose intensity (estimated as the standard deviation of the longitudinal velocity component normalized with its local mean) decayed along the longitudinal direction and never exceeded 10.72%.
Figure 1. The experimental flume used for the swimming performance tests with all components connected. The flume consisted of an upstream tank connected with the main open channel flume which discharges water in the downstream water collection tank. The water is recirculated using a water pump via a combination of a stainless steel and plastic pipes connecting the whole flume system.
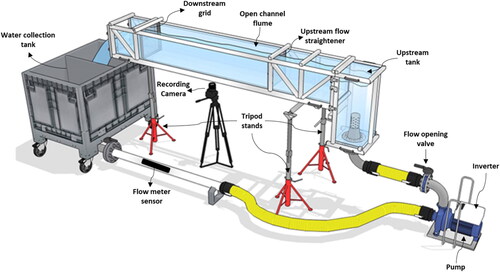
Throughout testing, water in the system was maintained at an average temperature of 10.64 °C (S.D. ± 0.23 °C) and cooled intermittently with a chiller unit (TECO TK-2000). The temperature difference between the holding tanks and the testing flume was never larger than 1 °C to avoid any potential adverse effects of a sudden temperature change on swimming performance (Tudorache et al. Citation2010b; Vezza et al. Citation2020). Sony AX43 Handycams were used to video record the swimming tests at a resolution of 1920 × 1080 with a frame rate of 50 frames/s.
Habituation times
Fish were tested using a fixed velocity testing protocol. Three different in-flume habituation times, prior to the onset of testing velocity, were used: 30 sec (Treatment 0.5), 5 mins (Treatment 5), and 20 mins (Treatment 20). Thirty-five fish were tested per treatment, resulting in a total sample size of 105 fish. Each fish was tested only once. The flow velocity during habituation time was set to 5 cm/s (around 1 BL/s). At the end of the habituation time, the flow rate was progressively increased within 20 sec transition time to achieve the mean testing flow velocity of 50 cm/s (around 10 BL/s). The flow velocity value of 50 cm/s was selected because, according to preliminary testing, it is within the burst swimming range of juvenile R. aula, resulting in fatigue times of, at most, a few seconds to tens of seconds (Beamish Citation1978; Nikora et al. Citation2003; Videler Citation1993). The 20 sec transition time was chosen to allow a gentle increase in flow rate to prevent fish from startling or loosing equilibrium. Each trial concluded when the fish was fatigued. Fatigue was defined as fish resting/impinged on the downstream grid despite gentle tapping from the downstream end of the downstream grid. The fish was tapped no more than three times to motivate it to swim. Fish were anesthetized in clove oil (Aroma Labs, Kalamazoo, MI, USA; approximately 0.2 ml clove oil/l water) and measured at the end of each trial for fork length in centimetres (cm) and mass in grams (g).
Fish behaviour definitions
Differences between the three habituation treatments were tested with respect to proportion of successful swimming tests (i.e. a test trial where fish actively swims against the flow until fatigued) and time to fatigue. Data was then pooled and effects of behaviour during habituation and the start of the swimming trial on swimming performance was evaluated. During habituation, fish were observed to either (1) swim or stay without motion, away from the downstream grid (“in the flume”) or (2) rest on the downstream grid (“on grid”). Typically, fish in the flume at the end of the habituation period were also swimming during transition, while fish resting at the end of the habituation period were also resting during transition, making position correlate strongly with swimming through transition. In addition, fish resting on the grid were observed to display two different behaviours: laterally impinged or resting on the grid with head facing the flow. Difference in success proportion and time to fatigue was tested between fish in the flume or on the grid at the end of habituation using the whole pool of fish, as well between fish laterally impinged and fish facing on the flow among the on the grid fish.
From the successful swimming trials, we tested difference in time-to-fatigue between fish displaying two behaviours: swimming volitionally in response to flow (“no poke”) or swimming first after having been externally motived by poking (“poked”).
Chi-square test of independence was performed to compare the proportion of successful swimming trials between treatments and behavioural groups. Swimming performance data were non-normally distributed so Kruskal-Wallis and Mann-Whitney tests were used to compare performance and behaviour outcomes among treatments and behavioural groups. One-way ANOVA was used to test any significant differences among treatments based on fish length and weight. All statistical tests were run using R version 4.1.2 (R Foundation for Statistical Computing, Vienna, Austria. URL https://www.R-project.org). Package dplyr was used for data management (https://CRAN.R-project.org/package=dplyr), package ggplot2 was used for plotting (https://CRAN.R-project.org/package=ggplot2), and package car was used to run ANOVA tests (https://CRAN.R-project.org/package=car).
Results
There were no differences in length or weight between fish in the different habituation treatments (ANOVA, p > 0.38). In total 65 out of 105 swimming trials resulted in successful fish swimming tests (i.e. a fish with time to fatigue data). Fish with 30 sec habituation time had a substantially lower success proportion (20%) compared to fish habituated to flume for 5 min (77.14%; chi-square, p = 5.53 e-06) and 20 min (88.57%; chi-square, p-value = 3.42 e-08). There was no difference in proportion of successful trials between the 5 min and 20 min habituation treatments (chi-square, p = 0.34).
Time to fatigue (median = 8 sec, IQR = 7 sec; ) differed significantly among the three habituation treatments (Kruskal-Wallis, p = 0.03). As shown in , fish habituated for 30 s fatigued significantly faster than fish habituated for 20 min (Wilcoxon, p = 0.03). The same tendency was seen between fish habituated for 30 s and fish habituated for 5 min (Wilcoxon, p = 0.06). Habituation for 5 min or 20 min did not affect time-to-fatigue (Wilcoxon, p = 0.36).
Figure 2. Box plot of time-to-fatigue for 0.5 [min] (n = 7), 5 [min] (n = 27), and 20 [min] (n = 31) habituation time treatments. The red dot is the mean, whereas the solid black horizontal line inside the bounding box is the median fatigue time. The black dots represent the outliers, whereas the bounding box defines the Interquartile Range (IQR) of the time-to-fatigue data for each treatment. The vertical solid black lines mark Q1 – 1.5*IQR (bottom end) and Q3 + 1.5*IQR (top end), where Q1 and Q3 are the 25th and 75th percentiles, respectively.
![Figure 2. Box plot of time-to-fatigue for 0.5 [min] (n = 7), 5 [min] (n = 27), and 20 [min] (n = 31) habituation time treatments. The red dot is the mean, whereas the solid black horizontal line inside the bounding box is the median fatigue time. The black dots represent the outliers, whereas the bounding box defines the Interquartile Range (IQR) of the time-to-fatigue data for each treatment. The vertical solid black lines mark Q1 – 1.5*IQR (bottom end) and Q3 + 1.5*IQR (top end), where Q1 and Q3 are the 25th and 75th percentiles, respectively.](/cms/asset/88d3c9da-df4c-4bb5-a72b-513f3a3d1f0e/tjoe_a_2306411_f0002_c.jpg)
Due to very low proportion of success and poor swimming performance among the fish habituated for only 30 s, these thirty-five fish were excluded from the further behavioural analysis. Therefore, the following results only include data from Treatment 5 and 20, i.e. a total of 70 test fish with 58 successful trials.
At the end of the habituation time, fish were either resting on the downstream grid (n = 37) or present upstream in the flume arena (swimming or resting; n = 21). The position of the fish at the end of the habituation time did not affect the proportion of successful trials (64.2% for fish resting on the grid, and 35.7% for fish in flume arena; chi-square, p = 0.052). Fish in flume (either swimming or motionless) at the end of habituation and start of transition, however, performed significantly worse than fish resting on the grid (Wilcoxon, p = 0.02; ).
Figure 3. Box plot of time-to-fatigue for the fish swimming or resting in the flume (n = 21) or resting on the grid (n = 37) at the end of habituation/beginning of transition. The red dot is the mean, whereas the solid black line is the median fatigue time. The black dots represent the outliers, whereas the bounding box defines the Interquartile Range (IQR) of the time-to-fatigue data for each treatment. The vertical solid black lines mark Q1 – 1.5*IQR (bottom end) and Q3 + 1.5*IQR (top end), where Q1 and Q3 are the 25th and 75th percentiles, respectively.
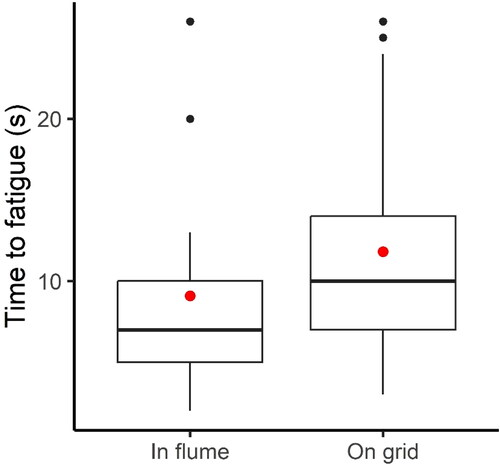
All but one fish who swam during habituation also swam during the transition period. Among the fish resting on the grid, no difference in time-to-fatigue was seen between fish facing the flow or fish being laterally impinged (Wilcoxon, p = 0.35).
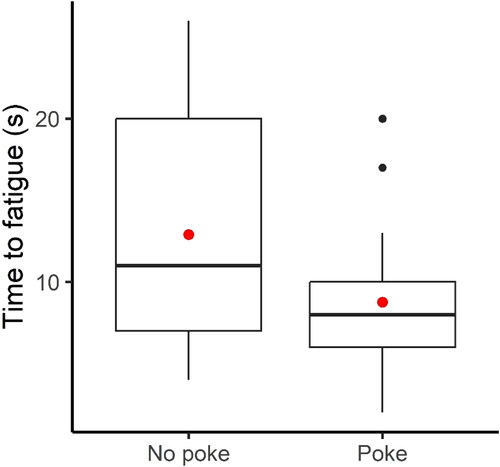
Fish were either swimming volitionally in response to flow (“no poke”, n = 29) or first after being physically encouraged to swim (“poked”, n = 29). Fish swimming volitionally in response to flow (“no poke”) displayed a significantly longer time-to-fatigue compared to fish that had to be poked to swim (Wilcoxon, p = 0.01; ).
Figure 4. Box plot of time-to-fatigue for fish swimming volitionally in response to flow (“no poke”, n = 29) or swimming first after having been externally motived by poking (“poked”, n = 29). The red dot is the mean, whereas the solid black line is the median fatigue time. The black dots represent the outliers, whereas the bounding box defines the Interquartile Range (IQR) of the time-to-fatigue data for each treatment. The vertical solid black lines mark Q1 – 1.5*IQR (bottom end) and Q3 + 1.5*IQR (top end), where Q1 and Q3 are the 25th and 75th percentiles, respectively.
Discussion
Increasing habituation time from 30 s to 5 or 20 min substantially increased the proportion of swimming trials resulting in successful swimming tests, and also resulted in increased time-to-fatigue. No difference, however, in either success proportion and time-to-fatigue was found between fish habituating to the flume for 5 and 20 min. Fish resting on the grid performed better than fish located in the upstream area of the flume during habituation time, and fish swimming volitionally in response to the testing velocity outperformed fish poked to swim.
The large difference in the proportion of successful trials between the 30 s habituation treatment and the 5 and 20 min habituation treatments highlights the importance of in-flume habituation time. Fish handling before its release in the flume causes fish stress and energy expenditure, important factors known to reduce fish performance (Arnekleiv et al. Citation2004; Barton and Schreck Citation1987; Pickering et al. Citation1982; Schreck and Tort Citation2016). Barton and Schreck (Citation1987) showed the adverse effect of acute physical stress in juvenile Steelhead O. mykiss limiting the energy available by about one-quarter for activities such as swimming. Moreover, capture and handling are known to elevate plasma lactate concentration levels, that also limits burst swimming performance (Videler Citation1993). Black (Citation1957) reported increase in mean lactate levels after handling in Rainbow trout O. mykiss from 15.7 mg% to 31.9 mg% when forced to swim slowly (9.7 − 12.4 cm/s) for 15 min. Olla et al. (Citation1992) found that juvenile Coho Salmon O. kisutch regained their previous ability to avoid predation in less than 90 min after significant handling (held out of water for 1 min). In our experiments, only 20% of the fish subjected to 30 s of habituation resulted in successful swimming trials compared to 80–90% among the fish given more time to habituate to the flume and recuperate after handling. Karlsson-Drangsholt et al. (Citation2018) highlighted in his study on Haddock Melanogrammus aeglefinus that it may take more than 6 h to recover the blood lactate levels. Likely, 30 s (Treatment 0.5) were insufficient to recuperate the white muscle energy reserves allowing the fish to swim at testing velocity (McFarlane and McDonald Citation2002; Videler Citation1993). On the other hand, the minimal differences in the proportion of successful trials and in the time-to-fatigue between habituation times of 5 or 20 min may indicate a logarithmic relationship between habituation time and time-to-fatigue (i.e. above a certain threshold the effects of habituation time upon fish burst swimming performance become negligible or milder compared to those related to the flow velocity at which fish are exposed). This potential relationship should be further investigated including other habituation times. Comparing burst swimming speeds after 20 min habituation time with even longer habituation times may clarify if also the longest habituation time tested in our study (i.e. 20 min) carry a potential cost due to insufficient habituation.
Sometimes, during habituation or transition periods, fish not showing rheotactic behaviour, orienting and swimming against the flow, are excluded from fish swimming performance experiments (Heuer et al. Citation2021; Myrick and Cech Citation2000; Nikora et al. Citation2003; Quintella et al. Citation2010; Santos et al. Citation2007). The underpinning idea is that these fish are likely to under-perform also in the swimming trial (Van Den Thillart et al. Citation2004). In our experiment, contrary to expectations, fish actively swimming at the end of habituation displayed lower swimming performance compared to fish resting on the grid. Importantly, 20 out of 21 (95.24%) of these fish were also swimming during the transition time, therefore spending energy reserves already before the initiation of the swimming test (McKenzie Citation2011; Vezza et al. Citation2020). Since such a transition time is unavoidable in forced swimming tests, our results suggest that this might cause an underestimate of time-to-fatigue. This is especially relevant when experiments are performed using velocities within the burst range, where the transition to test period ratio is relatively large. Volitional swimming tests, where the fish chooses its own velocity would be a way around this problem (Castro-Santos Citation2005; Castro-Santos et al. Citation2013; Colavecchia et al. Citation1998; Haro et al. Citation2004).
Other times, orientation but not swimming is used as an inclusion criterion in swimming trials, allowing fish to rest on the grid during habituation as long as it faces the flow (Myrick and Cech Citation2000). Among the fish resting on the grid, however, no difference in proportion of successful test or swimming performance was found between fish laterally impinged or fish resting on the grid facing the flow. This is somewhat surprising, given that being laterally impinged seems a highly unnatural behaviour, indicating a stressed condition (Tudorache et al. Citation2010a), that however, may still have allowed fish to conserve energy to be used during the test period (Liao Citation2007).
Giving external physical stimulation to encourage fish to swim is commonly used in forced swimming tests in flumes and swim chambers. In our study, fish resting on the downstream grid were poked from the downstream side of the grid to motivate them to start swimming. Comparing fish swimming volitionally in response to the flow (no poke) with fish that swam after having been poked at the start of the testing velocity showed that the former outperformed the latter. Motivation to swim could potentially influence swimming performance (T. Castro-Santos Citation2005; Goerig and Castro-Santos Citation2017). For example, fish tested in protocols where they voluntarily enter the swimming arena and are allowed to choose their own swimming velocity have been observed to perform better than conspecific in forced swimming trials (Peake and Farrell Citation2004; Tudorache et al. Citation2010a; Videler Citation1993). Our results highlight the role of motivation in fish swimming, and also, again, suggest that volitional swimming tests may increase the precision of our estimates of swimming capability (Castro-Santos et al. Citation2013; Colavecchia et al. Citation1998; Peake Citation2008a).
Fish swimming performance varies not only due to the different testing methodologies adopted but also due to the intrinsic variation in fish ability, behaviour, and motivation (Goerig and Castro-Santos Citation2017; Jones et al. Citation2020). In our experiments, only one fish species belonging to a specific age and size group was tested at a specific swimming velocity and temperature. This poses a limitation to the generalization of our results towards other species and sizes swimming at different speeds and temperatures. For example, would fish swimming performance at lower velocity, in the prolonged or sustained swimming modes, encompassing also aerobic processes, react in the same way in relation to habituation time? Also, as this experiment also alludes to, swimming performance is the product of capability and behaviour. Volitional swimming test protocol, where fish choose to swim or not, could avoid the potential pitfalls of forced performance tests and may improve our assessments of fish actual swimming capability (Colavecchia et al. Citation1998; Haro et al. Citation2004; Peake Citation2008b). In addition, while 5 min habituation time may be enough for a small-sized fish, the results of this study may not hold true for larger fish as they may require longer times to recuperate from fish handling stress prior to the testing since fish body size is known to scale with its total anaerobic capacity (Casselberry et al. Citation2023; Goolish Citation1989; Karlsson-Drangsholt et al. Citation2018; Somero and Childress Citation1980). Given that the results of fish performance studies are used for the fishway design and management of fisheries (Enders et al. Citation2017; Knapp et al. Citation2019), it is imperative to investigate the effect of habituation time on fish swimming abilities and behaviour for different species, sizes, and swimming modes, prompts for similar experiments.
The present paper highlights the importance of in-flume habituation time in forced performance tests. While extremely short habituation times need to be avoided, findings suggest that, in burst swimming performance tests, a 5-min habituation time may be sufficient, or at least as effective as 20 min habituation time, at least for small sized fish. Furthermore, the study also highlights potential impacts of fish behaviour – and researcher choices – on performance estimates, underlining that fish swimming performance is context dependent. This underlines the subjectivity of fish swimming performance estimates, and calls for a unifying methodology.
Acknowledgements
We would like to acknowledge Alessandro Candiotto for his assistance in electrofishing and fish husbandry, and the Province of Alessandria for use of the hatchery facilities.
Disclosure statement
The authors declare no competing interests.
Additional information
Funding
References
- Aedo JR, Otto KR, Rader RB, Hotchkiss RH, Belk MC. 2021. Size matters, but species do not: no evidence for species-specific swimming performance in co-occurring great basin stream fishes. Water. 13(18):2570. doi: 10.3390/w13182570.
- Arnekleiv JV, Urke HA, Kristensen T, Halleraker JH, Flodmark LEW. 2004. Recovery of wild, juvenile brown trout from stress of flow reduction, electrofishing, handling and transfer from river to an indoor simulated stream channel. J Fish Biol. 64(2):541–552. doi: 10.1111/j.0022-1112.2004.00320.x.
- Barton BA, Schreck CB. 1987. Metabolic cost of acute physical stress in juvenile steelhead. Trans Am Fish Soc. 116(2):257–263.
- Beamish FWH. 1978. Fish physiology. London: Academic Press. (W. S. Hoar & D. J. Randall, Eds.; 1st ed., Vol. 7).
- Black EC. 1957. Alterations in the blood level of lactic acid in certain salmonoid fishes following muscular activity: i. Kamloops trout, Salmo gairdneri. J Fish Res Bd Can. 14(2):117–134. doi: 10.1139/f57-004.
- Brett JR. 1964. The respiratory metabolism and swimming performance of young sockeye salmon. J Fish Res Bd Can. 21(5):1183–1226. doi: 10.1139/f64-103.
- Brett JR. 1967. Swimming performance of Sockeye Salmon (Oncorhynchus nerka) in relation to fatigue time and temperature. J Fish Res Bd Can. 24(8):1731–1741. doi: 10.1139/f67-142.
- Casselberry GA, Drake JC, Perlot N, Cooke SJ, Danylchuk AJ, Lennox RJ. 2023. Allometric scaling of anaerobic capacity estimated from a unique field-based data set of fish swimming. Physiol Biochem Zool. 96(1):17–29. doi: 10.1086/722134.
- Castro-Santos T. 2005. Optimal swim speeds for traversing velocity barriers: an analysis of volitional high-speed swimming behavior of migratory fishes. J Exp Biol. 208(Pt 3):421–432. doi: 10.1242/jeb.01380.
- Castro-Santos TR. 2002. Swimming performance of upstream migrant fishes: new methods, new perspectives. University of Massachusetts Amherst. https://scholarworks.umass.edu/dissertations/AAI3056208.
- Castro-Santos T, Sanz-Ronda FJ, Ruiz-Legazpi J. 2013. Breaking the speed limit—comparative sprinting performance of brook trout (Salvelinus fontinalis) and brown trout (Salmo trutta). Can J Fish Aquat Sci. 70(2):280–293. doi: 10.1139/cjfas-2012-0186.
- Colavecchia M, Katopodis C, Goosney R, Scruton DA, McKinley RS. 1998. Measurement of burst swimming performance in wild Atlantic salmon (Salmo salar L.) using digital telemetry. Regul Rivers: Res Mgmt. 14(1):41–51.
- Deslauriers D, Kieffer JD. 2011. The influence of flume length and group size on swimming performance in shortnose sturgeon Acipenser brevirostrum. J Fish Biol. 79(5):1146–1155. doi: 10.1111/j.1095-8649.2011.03094.x.
- Deslauriers D, Kieffer JD. 2012. Swimming performance and behaviour of young-of-the-year shortnose sturgeon (Acipenser brevirostrum) under fixed and increased velocity swimming tests. Can J Zool. 90(3):345–351. doi: 10.1139/z2012-004.
- Domenici P, Blake R. 1997. The kinematics and performance of fish fast-start swimming. J Exp Biol. 200(Pt 8):1165–1178. doi: 10.1242/jeb.200.8.1165.
- Enders EC, Castro-Santos T, Lacey RWJ. 2017. The effects of horizontally and vertically oriented baffles on flow structure and ascent performance of upstream-migrating fish. J Ecohydraul. 2(1):38–52. doi: 10.1080/24705357.2017.1288555.
- Farrell AP, Johansen JA, Steffensen JF, Moyes CD, West TG, Suarez RK. 1990. Effects of exercise training and coronary ablation on swimming performance, heart size, and cardiac enzymes in rainbow trout, Oncorhynchus mykiss. Can J Zool. 68(6):1174–1179. doi: 10.1139/z90-174.
- Farrell AP, Lee CG, Tierney K, Hodaly A, Clutterham S, Healey M, Hinch S, Lotto A. 2003. Field-based measurements of oxygen uptake and swimming performance with adult Pacific salmon using a mobile respirometer swim tunnel. J Fish Biol. 62(1):64–84. doi: 10.1046/j.1095-8649.2003.00010.x.
- Fortini N. 2016. Nuovo atlante dei pesci delle acque interne italiane: guida completa ai pesci, ciclostomi, crostacei decapodi di acque dolci e salmastre. Canterano: Aracne Ed.
- Goerig E, Castro-Santos T. 2017. Is motivation important to brook trout passage through culverts? Can J Fish Aquat Sci. 74(6):885–893. doi: 10.1139/cjfas-2016-0237.
- Goolish EM. 1989. The scaling of aerobic and anaerobic muscle power in rainbow trout (Salmo Gairdneri). J Experiment Biol. 147(1):493–505. doi: 10.1242/jeb.147.1.493.
- Hammer C. 1995. Fatigue and exercise tests with fish. Compar Biochem Physiol A: Physiol. 112(1):1–20. doi: 10.1016/0300-9629(95)00060-K.
- Haro A, Castro-Santos T, Noreika J, Odeh M. 2004. Swimming performance of upstream migrant fishes in open-channel flow: a new approach to predicting passage through velocity barriers. Can J Fish Aquat Sci. 61(9):1590–1601. doi: 10.1139/f04-093.
- Heuer RM, Stieglitz JD, Pasparakis C, Enochs IC, Benetti DD, Grosell M. 2021. The effects of temperature acclimation on swimming performance in the pelagic mahi-mahi (Coryphaena hippurus). Front Mar Sci. 8:654276. doi: 10.3389/fmars.2021.654276.
- Hvas M, Oppedal F. 2019. Influence of experimental set‐up and methodology for measurements of metabolic rates and critical swimming speed in Atlantic salmon Salmo salar. J Fish Biol. 95(3):893–902. doi: 10.1111/jfb.14087.
- Jones DR, Kiceniuk JW, Bamford OS. 1974. Evaluation of the swimming performance of several fish species from the Mackenzie River. J Fish Res Bd Can. 31(10):1641–1647. doi: 10.1139/f74-206.
- Jones PE, Svendsen JC, Börger L, Champneys T, Consuegra S, Jones JAH, Garcia De Leaniz C. 2020. One size does not fit all: inter- and intraspecific variation in the swimming performance of contrasting freshwater fish. Conserv Physiol. 8(1):coaa126. doi: 10.1093/conphys/coaa126.
- Karlsson-Drangsholt A, Svalheim RA, Aas-Hansen Ø, Olsen S-H, Midling K, Breen M, Grimsbø E, Johnsen HK. 2018. Recovery from exhaustive swimming and its effect on fillet quality in haddock (Melanogrammus aeglefinus). Fish Res. 197:96–104. doi: 10.1016/j.fishres.2017.09.006.
- Katopodis C, Cai L, Johnson D. 2019. Sturgeon survival: the role of swimming performance and fish passage research. Fish Res. 212:162–171. doi: 10.1016/j.fishres.2018.12.027.
- Katopodis C, Gervais R. 2012. Ecohydraulic analysis of fish fatigue data. River Res Apps. 28(4):444–456. doi: 10.1002/rra.1566.
- Knapp M, Montgomery J, Whittaker C, Franklin P, Baker C, Friedrich H. 2019. Fish passage hydrodynamics: insights into overcoming migration challenges for small-bodied fish. J Ecohydraul. 4(1):43–55. doi: 10.1080/24705357.2019.1604091.
- Liao JC. 2007. A review of fish swimming mechanics and behaviour in altered flows. Philos Trans R Soc Lond B Biol Sci. 362(1487):1973–1993. doi: 10.1098/rstb.2007.2082.
- Louison MJ, Stein JA, Suski CD. 2019. The role of social network behavior, swimming performance, and fish size in the determination of angling vulnerability in bluegill. Behav Ecol Sociobiol. 73(10):139. doi: 10.1007/s00265-019-2754-0.
- Lupandin AI. 2005. Effect of flow turbulence on swimming speed of fish. Biol Bull Russ Acad Sci. 32(5):461–466. doi: 10.1007/s10525-005-0125-z.
- McFarlane WJ, McDonald DG. 2002. Relating intramuscular fuel use to endurance in juvenile rainbow trout. Physiol Biochem Zool. 75(3):250–259. doi: 10.1086/341815.
- McKenzie DJ. 2011. The energetics of fish swimming. Amsterdam: Elsevier Inc; p. 1075–1080.
- Mu X, Cao P, Gong L, Baiyin B, Li X. 2019. A classification method for fish swimming behaviors under incremental water velocity for fishway hydraulic design. Water. 11(10):2131. doi: 10.3390/w11102131.
- Myrick CA, Cech JJ. 2000. Swimming performances of four california stream fishes: temperature effects. Environ Biol Fishes. 58(3):289–295. doi: 10.1023/A:1007649931414.
- Nikora VI, Aberle J, Biggs BJF, Jowett IG, Sykes JRE. 2003. Effects of fish size, time-to-fatigue and turbulence on swimming performance: a case study of Galaxias maculatus: swimming performance of Inanga. J Fish Biol. 63(6):1365–1382. doi: 10.1111/j.1095-8649.2003.00241.x.
- Olla BL, Davis MW, Schreck CB. 1992. Notes: comparison of predator avoidance capabilities with corticosteroid levels induced by stress in Juvenile Coho Salmon. Trans Am Fish Soc. 121(4):544–547. doi: 10.1577/1548-8659(1992)121<0544:NCOPAC>2.3.CO;2.
- Palstra AP, Kals J, Böhm T, Bastiaansen JWM, Komen H. 2020. Swimming performance and oxygen consumption as non-lethal indicators of production traits in Atlantic Salmon and Gilthead Seabream. Front Physiol. 11:759. doi: 10.3389/fphys.2020.00759.
- Peake S. 2008a. Behavior and passage performance of northern pike, walleyes, and white suckers in an experimental raceway. N American J Fish Manag. 28(1):321–327. doi: 10.1577/M06-260.1.
- Peake S. 2008b. Gait transition speed as an alternate measure of maximum aerobic capacity in fishes. J Fish Biol. 72(3):645–655. doi: 10.1111/j.1095-8649.2007.01753.x.
- Peake S, Farrell AP. 2004. Locomotory behaviour and post-exercise physiology in relation to swimming speed, gait transition and metabolism in free-swimming smallmouth bass (Micropterus dolomieu). J Exp Biol. 207(Pt 9):1563–1575. doi: 10.1242/jeb.00927.
- Peake S, McKinley RS, Barth C. 1997a. Effect of recovery parameters on critical swimming speed of juvenile rainbow trout (Oncorhynchus mykiss). Can J Zool. 75(10):1724–1727. doi: 10.1139/z97-800.
- Peake S, McKinley RS, Scruton DA. 1997b. Swimming performance of various freshwater Newfoundland salmonids relative to habitat selection and fishway design. J Fish Biol. 51(4):710–723. doi: 10.1111/j.1095-8649.1997.tb01993.x.
- Penghan L-Y, Pang X, Fu S-J. 2016. The effects of starvation on fast-start escape and constant acceleration swimming performance in rose bitterling (Rhodeus ocellatus) at two acclimation temperatures. Fish Physiol Biochem. 42(3):909–918. doi: 10.1007/s10695-015-0184-0.
- Pickering AD, Pottinger TG, Christie P. 1982. Recovery of the brown trout, Salmo trutta L., from acute handling stress: a time-course study. J Fish Biol. 20(2):229–244. doi: 10.1111/j.1095-8649.1982.tb03923.x.
- Plew DR, Nikora VI, Larned ST, Sykes JRE, Cooper GG. 2007. Fish swimming speed variability at constant flow: Galaxias maculatus. New Zealand J Marine Freshwater Res. 41(2):185–195. doi: 10.1080/00288330709509907.
- Quintella BR, Mateus CS, Costa JL, Domingos I, Almeida PR. 2010. Critical swimming speed of yellow- and silver-phase European eel (Anguilla anguilla, L.): critical swimming speed of yellow- and silver-phase European eel. J Appl Ichthyol. 26(3):432–435. doi: 10.1111/j.1439-0426.2010.01457.x.
- Romão F, Quintella BR, Pereira TJ, Almeida PR. 2012. Swimming performance of two Iberian cyprinids: the Tagus nase Pseudochondrostoma polylepis (Steindachner, 1864) and the bordallo Squalius carolitertii (Doadrio, 1988): critical swimming speed of two Iberian cyprinids. J Appl Ichthyol. 28(1):26–30. doi: 10.1111/j.1439-0426.2011.01882.x.
- Santos HdAe, Pompeu PdS, Martinez CB. 2007. Swimming performance of the migratory neotropical fish Leporinus reinhardti (Characiformes: anostomidae). Neotrop Ichthyol. 5(2):139–146. doi: 10.1590/S1679-62252007000200007.
- Schiavon A, Comoglio C, Candiotto A, Hölker F, Ashraf MU, Nyqvist D. 2023. Survival and swimming performance of a small-sized Cypriniformes (Telestes muticellus) tagged with passive integrated transponders. J Limnol. 82:2129. doi: 10.4081/jlimnol.2023.2129.
- Schreck CB, Tort L. 2016. The concept of stress in fish. In Fish Physiology. Vol. 35. Cambridge, MA, USA: Academic Press; p. 1–34. doi: 10.1016/B978-0-12-802728-8.00001-1.
- Shiau J, Watson JR, Cramp RL, Gordos MA, Franklin CE. 2020. Interactions between water depth, velocity and body size on fish swimming performance: implications for culvert hydrodynamics. Ecol Eng. 156:105987. doi: 10.1016/j.ecoleng.2020.105987.
- Silva AT, Katopodis C, Santos JM, Ferreira MT, Pinheiro AN. 2012. Cyprinid swimming behaviour in response to turbulent flow. Ecol Eng. 44:314–328. doi: 10.1016/j.ecoleng.2012.04.015.
- Silva AT, Santos JM, Ferreira MT, Pinheiro AN, Katopodis C. 2011. Effects of water velocity and turbulence on the behaviour of Iberian barbel (Luciobarbus bocagei, Steindachner 1864) in an experimental pool-type fishway: Iberian Barbel’s response to velocity and turbulence. River Res Apps. 27(3):360–373. doi: 10.1002/rra.1363.
- Silva SS, Alexandre CM, Quintella BR, de Almeida PR. 2021. Seasonal environmental variability drives the swimming performance of a resident Iberian fish. Ecol Freshwater Fish. 30(3):366–374. doi: 10.1111/eff.12587.
- Somero GN, Childress JJ. 1980. A violation of the metabolism-size scaling paradigm: activities of glycolytic enzymes in muscle increase in larger-size fish. Physiol Zool. 53(3):322–337. doi: 10.1086/physzool.53.3.30155794.
- Stevens ED. 1979. The effect of temperature on tail beat frequency of fish swimming at constant velocity. Can J Zool. 57(8):1628–1635. doi: 10.1139/z79-214.
- Tritico HM, Cotel AJ. 2010. The effects of turbulent eddies on the stability and critical swimming speed of creek chub (Semotilus atromaculatus). J Exp Biol. 213(Pt 13):2284–2293. doi: 10.1242/jeb.041806.
- Tudorache C, O'Keefe RA, Benfey TJ. 2010a. Flume length and post-exercise impingement affect anaerobic metabolism in brook charr Salvelinus fontinalis. J Fish Biol. 76(3):729–733. doi: 10.1111/j.1095-8649.2009.02513.x.
- Tudorache C, O'Keefe RA, Benfey TJ. 2010b. The effect of temperature and ammonia exposure on swimming performance of brook charr (Salvelinus fontinalis). Comp Biochem Physiol A Mol Integr Physiol. 156(4):523–528. doi: 10.1016/j.cbpa.2010.04.010.
- Tudorache C, Viaene P, Blust R, Vereecken H, De Boeck G. 2008. A comparison of swimming capacity and energy use in seven European freshwater fish species. Ecol Freshwater Fish. 17(2):284–291. doi: 10.1111/j.1600-0633.2007.00280.x.
- Tudorache C, Viaenen P, Blust R, De Boeck G. 2007. Longer flumes increase critical swimming speeds by increasing burst-glide swimming duration in carp Cyprinus carpio, L. J Fish Biol. 71(6):1630–1638. doi: 10.1111/j.1095-8649.2007.01620.x.
- Van Den Thillart G, Van Ginneken V, Körner F, Heijmans R, Van Der Linden R, Gluvers A. 2004. Endurance swimming of European eel. J Fish Biol. 65(2):312–318. doi: 10.1111/j.0022-1112.2004.00447.x.
- Vezza P, Libardoni F, Manes C, Tsuzaki T, Bertoldi W, Kemp PS. 2020. Rethinking swimming performance tests for bottom-dwelling fish: the case of European glass eel (Anguilla anguilla). Sci Rep. 10(1):16416. doi: 10.1038/s41598-020-72957-w.
- Videler JJ. 1993. Fish swimming. Netherlands: Springer. doi: 10.1007/978-94-011-1580-3.
- Watson JR, Goodrich HR, Cramp RL, Gordos MA, Yan Y, Ward PJ, Franklin CE. 2019. Swimming performance traits of twenty-one Australian fish species: a fish passage management tool for use in modified freshwater systems. bioRxiv, 861898. doi: 10.1101/861898.
- Webb PW, Kostecki PT, Stevens ED. 1984. The effect of size and swimming speed on locomotor kinematics of rainbow trout. J Experiment Biol. 109(1):77–95. doi: 10.1242/jeb.109.1.77.